Estimated zip code population in 2022: 7,828
Zip code population in 2010: 8,229
Zip code population in 2000: 9,403
Houses and condos: 3,669
Renter-occupied apartments: 1,076
% of renters here:
33%State:
33%
March 2022 cost of living index in zip code 44405: 88.7
(less than average, U.S. average is 100)
Land area: 3.5
sq. mi.
Water area: 0.0
sq. mi.
Population density: 2,229 people per square mile (low).
OSM Map
General Map
Google Map
MSN Map
OSM Map
General Map
Google Map
MSN Map
OSM Map
General Map
Google Map
MSN Map
OSM Map
General Map
Google Map
MSN Map
Please wait while loading the map...
Real estate property taxes paid for housing units in 2022:
This zip code:
1.4% ($1,152)Ohio:
1.3% ($2,639)
Median real estate property taxes paid for housing units with mortgages in 2022: $1,327 (1.1%)
Median real estate property taxes paid for housing units with no mortgage in 2022: $1,073 (1.4%)
Business Search - 14 Million verified businesses
Males: 3,635 Females: 4,193
For population 25 years and over in 44405:
High school or higher: 83.1%Bachelor's degree or higher: 18.0%Graduate or professional degree: 5.4%Unemployed: 10.1%Mean travel time to work (commute): 20.4 minutes
For population 15 years and over in 44405:
Never married: 38.8%Now married: 34.7%Separated: 1.7%Widowed: 8.2%Divorced: 16.6%
Zip code 44405 compared to state average:
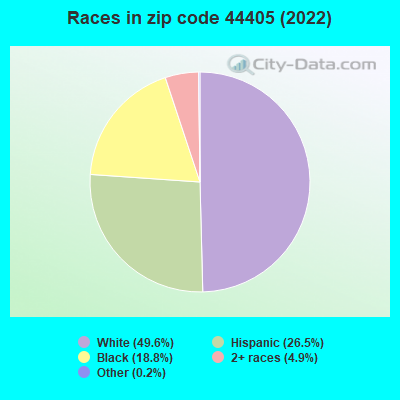
Median household income below state average. Median house value significantly below state average. Unemployed percentage above state average. Hispanic race population percentage significantly above state average. Length of stay since moving in significantly above state average. Percentage of population with a bachelor's degree or higher below state average. 3,885 49.6% White 2,073 26.5% Hispanic or Latino 1,474 18.8% Black 380 4.9% Two or more races 13 0.2% Some other race
Data:
Median household income ($)
Median household income (% change since 2000)
Household income diversity
Ratio of average income to average house value (%)
Ratio of average income to average rent
Median household income ($) - White
Median household income ($) - Black or African American
Median household income ($) - Asian
Median household income ($) - Hispanic or Latino
Median household income ($) - American Indian and Alaska Native
Median household income ($) - Multirace
Median household income ($) - Other Race
Median household income for houses/condos with a mortgage ($)
Median household income for apartments without a mortgage ($)
Races - White alone (%)
Races - White alone (% change since 2000)
Races - Black alone (%)
Races - Black alone (% change since 2000)
Races - American Indian alone (%)
Races - American Indian alone (% change since 2000)
Races - Asian alone (%)
Races - Asian alone (% change since 2000)
Races - Hispanic (%)
Races - Hispanic (% change since 2000)
Races - Native Hawaiian and Other Pacific Islander alone (%)
Races - Native Hawaiian and Other Pacific Islander alone (% change since 2000)
Races - Two or more races (%)
Races - Two or more races (% change since 2000)
Races - Other race alone (%)
Races - Other race alone (% change since 2000)
Racial diversity
Unemployment (%)
Unemployment (% change since 2000)
Unemployment (%) - White
Unemployment (%) - Black or African American
Unemployment (%) - Asian
Unemployment (%) - Hispanic or Latino
Unemployment (%) - American Indian and Alaska Native
Unemployment (%) - Multirace
Unemployment (%) - Other Race
Population density (people per square mile)
Population - Males (%)
Population - Females (%)
Population - Males (%) - White
Population - Males (%) - Black or African American
Population - Males (%) - Asian
Population - Males (%) - Hispanic or Latino
Population - Males (%) - American Indian and Alaska Native
Population - Males (%) - Multirace
Population - Males (%) - Other Race
Population - Females (%) - White
Population - Females (%) - Black or African American
Population - Females (%) - Asian
Population - Females (%) - Hispanic or Latino
Population - Females (%) - American Indian and Alaska Native
Population - Females (%) - Multirace
Population - Females (%) - Other Race
Coronavirus confirmed cases (May 31, 2024)
Deaths caused by coronavirus (May 31, 2024)
Coronavirus confirmed cases (per 100k population) (May 31, 2024)
Deaths caused by coronavirus (per 100k population) (May 31, 2024)
Daily increase in number of cases (May 31, 2024)
Weekly increase in number of cases (May 31, 2024)
Cases doubled (in days) (May 31, 2024)
Hospitalized patients (Apr 18, 2022)
Negative test results (Apr 18, 2022)
Total test results (Apr 18, 2022)
COVID Vaccine doses distributed (per 100k population) (Sep 19, 2023)
COVID Vaccine doses administered (per 100k population) (Sep 19, 2023)
COVID Vaccine doses distributed (Sep 19, 2023)
COVID Vaccine doses administered (Sep 19, 2023)
Likely homosexual households (%)
Likely homosexual households (% change since 2000)
Likely homosexual households - Lesbian couples (%)
Likely homosexual households - Lesbian couples (% change since 2000)
Likely homosexual households - Gay men (%)
Likely homosexual households - Gay men (% change since 2000)
Cost of living index
Median gross rent ($)
Median contract rent ($)
Median monthly housing costs ($)
Median house or condo value ($)
Median house or condo value ($ change since 2000)
Mean house or condo value by units in structure - 1, detached ($)
Mean house or condo value by units in structure - 1, attached ($)
Mean house or condo value by units in structure - 2 ($)
Mean house or condo value by units in structure by units in structure - 3 or 4 ($)
Mean house or condo value by units in structure - 5 or more ($)
Mean house or condo value by units in structure - Boat, RV, van, etc. ($)
Mean house or condo value by units in structure - Mobile home ($)
Median house or condo value ($) - White
Median house or condo value ($) - Black or African American
Median house or condo value ($) - Asian
Median house or condo value ($) - Hispanic or Latino
Median house or condo value ($) - American Indian and Alaska Native
Median house or condo value ($) - Multirace
Median house or condo value ($) - Other Race
Median resident age
Resident age diversity
Median resident age - Males
Median resident age - Females
Median resident age - White
Median resident age - Black or African American
Median resident age - Asian
Median resident age - Hispanic or Latino
Median resident age - American Indian and Alaska Native
Median resident age - Multirace
Median resident age - Other Race
Median resident age - Males - White
Median resident age - Males - Black or African American
Median resident age - Males - Asian
Median resident age - Males - Hispanic or Latino
Median resident age - Males - American Indian and Alaska Native
Median resident age - Males - Multirace
Median resident age - Males - Other Race
Median resident age - Females - White
Median resident age - Females - Black or African American
Median resident age - Females - Asian
Median resident age - Females - Hispanic or Latino
Median resident age - Females - American Indian and Alaska Native
Median resident age - Females - Multirace
Median resident age - Females - Other Race
Commute - mean travel time to work (minutes)
Travel time to work - Less than 5 minutes (%)
Travel time to work - Less than 5 minutes (% change since 2000)
Travel time to work - 5 to 9 minutes (%)
Travel time to work - 5 to 9 minutes (% change since 2000)
Travel time to work - 10 to 19 minutes (%)
Travel time to work - 10 to 19 minutes (% change since 2000)
Travel time to work - 20 to 29 minutes (%)
Travel time to work - 20 to 29 minutes (% change since 2000)
Travel time to work - 30 to 39 minutes (%)
Travel time to work - 30 to 39 minutes (% change since 2000)
Travel time to work - 40 to 59 minutes (%)
Travel time to work - 40 to 59 minutes (% change since 2000)
Travel time to work - 60 to 89 minutes (%)
Travel time to work - 60 to 89 minutes (% change since 2000)
Travel time to work - 90 or more minutes (%)
Travel time to work - 90 or more minutes (% change since 2000)
Marital status - Never married (%)
Marital status - Now married (%)
Marital status - Separated (%)
Marital status - Widowed (%)
Marital status - Divorced (%)
Median family income ($)
Median family income (% change since 2000)
Median non-family income ($)
Median non-family income (% change since 2000)
Median per capita income ($)
Median per capita income (% change since 2000)
Median family income ($) - White
Median family income ($) - Black or African American
Median family income ($) - Asian
Median family income ($) - Hispanic or Latino
Median family income ($) - American Indian and Alaska Native
Median family income ($) - Multirace
Median family income ($) - Other Race
Median year house/condo built
Median year apartment built
Year house built - Built 2005 or later (%)
Year house built - Built 2000 to 2004 (%)
Year house built - Built 1990 to 1999 (%)
Year house built - Built 1980 to 1989 (%)
Year house built - Built 1970 to 1979 (%)
Year house built - Built 1960 to 1969 (%)
Year house built - Built 1950 to 1959 (%)
Year house built - Built 1940 to 1949 (%)
Year house built - Built 1939 or earlier (%)
Average household size
Household density (households per square mile)
Average household size - White
Average household size - Black or African American
Average household size - Asian
Average household size - Hispanic or Latino
Average household size - American Indian and Alaska Native
Average household size - Multirace
Average household size - Other Race
Occupied housing units (%)
Vacant housing units (%)
Owner occupied housing units (%)
Renter occupied housing units (%)
Vacancy status - For rent (%)
Vacancy status - For sale only (%)
Vacancy status - Rented or sold, not occupied (%)
Vacancy status - For seasonal, recreational, or occasional use (%)
Vacancy status - For migrant workers (%)
Vacancy status - Other vacant (%)
Residents with income below the poverty level (%)
Residents with income below 50% of the poverty level (%)
Children below poverty level (%)
Poor families by family type - Married-couple family (%)
Poor families by family type - Male, no wife present (%)
Poor families by family type - Female, no husband present (%)
Poverty status for native-born residents (%)
Poverty status for foreign-born residents (%)
Poverty among high school graduates not in families (%)
Poverty among people who did not graduate high school not in families (%)
Residents with income below the poverty level (%) - White
Residents with income below the poverty level (%) - Black or African American
Residents with income below the poverty level (%) - Asian
Residents with income below the poverty level (%) - Hispanic or Latino
Residents with income below the poverty level (%) - American Indian and Alaska Native
Residents with income below the poverty level (%) - Multirace
Residents with income below the poverty level (%) - Other Race
Air pollution - Air Quality Index (AQI)
Air pollution - CO
Air pollution - NO2
Air pollution - SO2
Air pollution - Ozone
Air pollution - PM10
Air pollution - PM25
Air pollution - Pb
Crime - Murders per 100,000 population
Crime - Rapes per 100,000 population
Crime - Robberies per 100,000 population
Crime - Assaults per 100,000 population
Crime - Burglaries per 100,000 population
Crime - Thefts per 100,000 population
Crime - Auto thefts per 100,000 population
Crime - Arson per 100,000 population
Crime - City-data.com crime index
Crime - Violent crime index
Crime - Property crime index
Crime - Murders per 100,000 population (5 year average)
Crime - Rapes per 100,000 population (5 year average)
Crime - Robberies per 100,000 population (5 year average)
Crime - Assaults per 100,000 population (5 year average)
Crime - Burglaries per 100,000 population (5 year average)
Crime - Thefts per 100,000 population (5 year average)
Crime - Auto thefts per 100,000 population (5 year average)
Crime - Arson per 100,000 population (5 year average)
Crime - City-data.com crime index (5 year average)
Crime - Violent crime index (5 year average)
Crime - Property crime index (5 year average)
1996 Presidential Elections Results (%) - Democratic Party (Clinton)
1996 Presidential Elections Results (%) - Republican Party (Dole)
1996 Presidential Elections Results (%) - Other
2000 Presidential Elections Results (%) - Democratic Party (Gore)
2000 Presidential Elections Results (%) - Republican Party (Bush)
2000 Presidential Elections Results (%) - Other
2004 Presidential Elections Results (%) - Democratic Party (Kerry)
2004 Presidential Elections Results (%) - Republican Party (Bush)
2004 Presidential Elections Results (%) - Other
2008 Presidential Elections Results (%) - Democratic Party (Obama)
2008 Presidential Elections Results (%) - Republican Party (McCain)
2008 Presidential Elections Results (%) - Other
2012 Presidential Elections Results (%) - Democratic Party (Obama)
2012 Presidential Elections Results (%) - Republican Party (Romney)
2012 Presidential Elections Results (%) - Other
2016 Presidential Elections Results (%) - Democratic Party (Clinton)
2016 Presidential Elections Results (%) - Republican Party (Trump)
2016 Presidential Elections Results (%) - Other
2020 Presidential Elections Results (%) - Democratic Party (Biden)
2020 Presidential Elections Results (%) - Republican Party (Trump)
2020 Presidential Elections Results (%) - Other
Ancestries Reported - Arab (%)
Ancestries Reported - Czech (%)
Ancestries Reported - Danish (%)
Ancestries Reported - Dutch (%)
Ancestries Reported - English (%)
Ancestries Reported - French (%)
Ancestries Reported - French Canadian (%)
Ancestries Reported - German (%)
Ancestries Reported - Greek (%)
Ancestries Reported - Hungarian (%)
Ancestries Reported - Irish (%)
Ancestries Reported - Italian (%)
Ancestries Reported - Lithuanian (%)
Ancestries Reported - Norwegian (%)
Ancestries Reported - Polish (%)
Ancestries Reported - Portuguese (%)
Ancestries Reported - Russian (%)
Ancestries Reported - Scotch-Irish (%)
Ancestries Reported - Scottish (%)
Ancestries Reported - Slovak (%)
Ancestries Reported - Subsaharan African (%)
Ancestries Reported - Swedish (%)
Ancestries Reported - Swiss (%)
Ancestries Reported - Ukrainian (%)
Ancestries Reported - United States (%)
Ancestries Reported - Welsh (%)
Ancestries Reported - West Indian (%)
Ancestries Reported - Other (%)
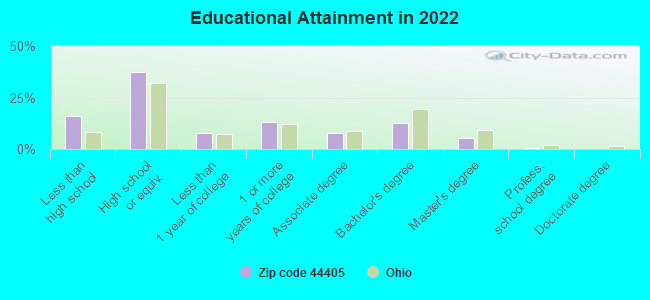
Educational Attainment - No schooling completed (%)
Educational Attainment - Less than high school (%)
Educational Attainment - High school or equivalent (%)
Educational Attainment - Less than 1 year of college (%)
Educational Attainment - 1 or more years of college (%)
Educational Attainment - Associate degree (%)
Educational Attainment - Bachelor's degree (%)
Educational Attainment - Master's degree (%)
Educational Attainment - Professional school degree (%)
Educational Attainment - Doctorate degree (%)
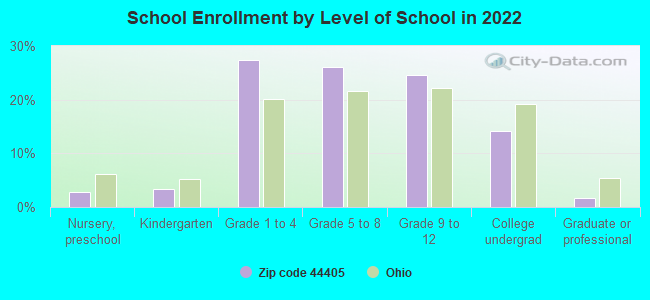
School Enrollment - Nursery, preschool (%)
School Enrollment - Kindergarten (%)
School Enrollment - Grade 1 to 4 (%)
School Enrollment - Grade 5 to 8 (%)
School Enrollment - Grade 9 to 12 (%)
School Enrollment - College undergrad (%)
School Enrollment - Graduate or professional (%)
School Enrollment - Not enrolled in school (%)
School enrollment - Public schools (%)
School enrollment - Private schools (%)
School enrollment - Not enrolled (%)
Median number of rooms in houses and condos
Median number of rooms in apartments
Housing units lacking complete plumbing facilities (%)
Housing units lacking complete kitchen facilities (%)
Density of houses
Urban houses (%)
Rural houses (%)
Households with people 60 years and over (%)
Households with people 65 years and over (%)
Households with people 75 years and over (%)
Households with one or more nonrelatives (%)
Households with no nonrelatives (%)
Population in households (%)
Family households (%)
Nonfamily households (%)
Population in families (%)
Family households with own children (%)
Median number of bedrooms in owner occupied houses
Mean number of bedrooms in owner occupied houses
Median number of bedrooms in renter occupied houses
Mean number of bedrooms in renter occupied houses
Median number of vehichles in owner occupied houses
Mean number of vehichles in owner occupied houses
Median number of vehichles in renter occupied houses
Mean number of vehichles in renter occupied houses
Mortgage status - with mortgage (%)
Mortgage status - with second mortgage (%)
Mortgage status - with home equity loan (%)
Mortgage status - with both second mortgage and home equity loan (%)
Mortgage status - without a mortgage (%)
Average family size
Average family size - White
Average family size - Black or African American
Average family size - Asian
Average family size - Hispanic or Latino
Average family size - American Indian and Alaska Native
Average family size - Multirace
Average family size - Other Race
Geographical mobility - Same house 1 year ago (%)
Geographical mobility - Moved within same county (%)
Geographical mobility - Moved from different county within same state (%)
Geographical mobility - Moved from different state (%)
Geographical mobility - Moved from abroad (%)
Place of birth - Born in state of residence (%)
Place of birth - Born in other state (%)
Place of birth - Native, outside of US (%)
Place of birth - Foreign born (%)
Housing units in structures - 1, detached (%)
Housing units in structures - 1, attached (%)
Housing units in structures - 2 (%)
Housing units in structures - 3 or 4 (%)
Housing units in structures - 5 to 9 (%)
Housing units in structures - 10 to 19 (%)
Housing units in structures - 20 to 49 (%)
Housing units in structures - 50 or more (%)
Housing units in structures - Mobile home (%)
Housing units in structures - Boat, RV, van, etc. (%)
House/condo owner moved in on average (years ago)
Renter moved in on average (years ago)
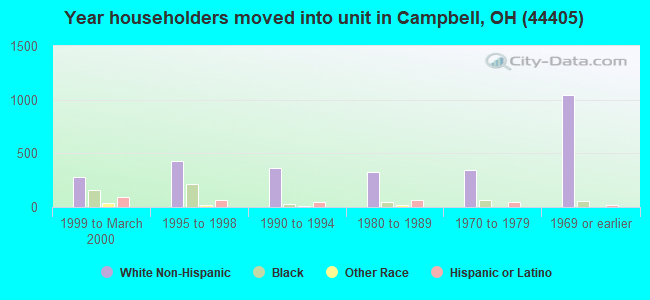
Year householder moved into unit - Moved in 1999 to March 2000 (%)
Year householder moved into unit - Moved in 1995 to 1998 (%)
Year householder moved into unit - Moved in 1990 to 1994 (%)
Year householder moved into unit - Moved in 1980 to 1989 (%)
Year householder moved into unit - Moved in 1970 to 1979 (%)
Year householder moved into unit - Moved in 1969 or earlier (%)
Means of transportation to work - Drove car alone (%)
Means of transportation to work - Carpooled (%)
Means of transportation to work - Public transportation (%)
Means of transportation to work - Bus or trolley bus (%)
Means of transportation to work - Streetcar or trolley car (%)
Means of transportation to work - Subway or elevated (%)
Means of transportation to work - Railroad (%)
Means of transportation to work - Ferryboat (%)
Means of transportation to work - Taxicab (%)
Means of transportation to work - Motorcycle (%)
Means of transportation to work - Bicycle (%)
Means of transportation to work - Walked (%)
Means of transportation to work - Other means (%)
Working at home (%)
Industry diversity
Most Common Industries - Agriculture, forestry, fishing and hunting, and mining (%)
Most Common Industries - Agriculture, forestry, fishing and hunting (%)
Most Common Industries - Mining, quarrying, and oil and gas extraction (%)
Most Common Industries - Construction (%)
Most Common Industries - Manufacturing (%)
Most Common Industries - Wholesale trade (%)
Most Common Industries - Retail trade (%)
Most Common Industries - Transportation and warehousing, and utilities (%)
Most Common Industries - Transportation and warehousing (%)
Most Common Industries - Utilities (%)
Most Common Industries - Information (%)
Most Common Industries - Finance and insurance, and real estate and rental and leasing (%)
Most Common Industries - Finance and insurance (%)
Most Common Industries - Real estate and rental and leasing (%)
Most Common Industries - Professional, scientific, and management, and administrative and waste management services (%)
Most Common Industries - Professional, scientific, and technical services (%)
Most Common Industries - Management of companies and enterprises (%)
Most Common Industries - Administrative and support and waste management services (%)
Most Common Industries - Educational services, and health care and social assistance (%)
Most Common Industries - Educational services (%)
Most Common Industries - Health care and social assistance (%)
Most Common Industries - Arts, entertainment, and recreation, and accommodation and food services (%)
Most Common Industries - Arts, entertainment, and recreation (%)
Most Common Industries - Accommodation and food services (%)
Most Common Industries - Other services, except public administration (%)
Most Common Industries - Public administration (%)
Occupation diversity
Most Common Occupations - Management, business, science, and arts occupations (%)
Most Common Occupations - Management, business, and financial occupations (%)
Most Common Occupations - Management occupations (%)
Most Common Occupations - Business and financial operations occupations (%)
Most Common Occupations - Computer, engineering, and science occupations (%)
Most Common Occupations - Computer and mathematical occupations (%)
Most Common Occupations - Architecture and engineering occupations (%)
Most Common Occupations - Life, physical, and social science occupations (%)
Most Common Occupations - Education, legal, community service, arts, and media occupations (%)
Most Common Occupations - Community and social service occupations (%)
Most Common Occupations - Legal occupations (%)
Most Common Occupations - Education, training, and library occupations (%)
Most Common Occupations - Arts, design, entertainment, sports, and media occupations (%)
Most Common Occupations - Healthcare practitioners and technical occupations (%)
Most Common Occupations - Health diagnosing and treating practitioners and other technical occupations (%)
Most Common Occupations - Health technologists and technicians (%)
Most Common Occupations - Service occupations (%)
Most Common Occupations - Healthcare support occupations (%)
Most Common Occupations - Protective service occupations (%)
Most Common Occupations - Fire fighting and prevention, and other protective service workers including supervisors (%)
Most Common Occupations - Law enforcement workers including supervisors (%)
Most Common Occupations - Food preparation and serving related occupations (%)
Most Common Occupations - Building and grounds cleaning and maintenance occupations (%)
Most Common Occupations - Personal care and service occupations (%)
Most Common Occupations - Sales and office occupations (%)
Most Common Occupations - Sales and related occupations (%)
Most Common Occupations - Office and administrative support occupations (%)
Most Common Occupations - Natural resources, construction, and maintenance occupations (%)
Most Common Occupations - Farming, fishing, and forestry occupations (%)
Most Common Occupations - Construction and extraction occupations (%)
Most Common Occupations - Installation, maintenance, and repair occupations (%)
Most Common Occupations - Production, transportation, and material moving occupations (%)
Most Common Occupations - Production occupations (%)
Most Common Occupations - Transportation occupations (%)
Most Common Occupations - Material moving occupations (%)
People in Group quarters - Institutionalized population (%)
People in Group quarters - Correctional institutions (%)
People in Group quarters - Federal prisons and detention centers (%)
People in Group quarters - Halfway houses (%)
People in Group quarters - Local jails and other confinement facilities (including police lockups) (%)
People in Group quarters - Military disciplinary barracks (%)
People in Group quarters - State prisons (%)
People in Group quarters - Other types of correctional institutions (%)
People in Group quarters - Nursing homes (%)
People in Group quarters - Hospitals/wards, hospices, and schools for the handicapped (%)
People in Group quarters - Hospitals/wards and hospices for chronically ill (%)
People in Group quarters - Hospices or homes for chronically ill (%)
People in Group quarters - Military hospitals or wards for chronically ill (%)
People in Group quarters - Other hospitals or wards for chronically ill (%)
People in Group quarters - Hospitals or wards for drug/alcohol abuse (%)
People in Group quarters - Mental (Psychiatric) hospitals or wards (%)
People in Group quarters - Schools, hospitals, or wards for the mentally retarded (%)
People in Group quarters - Schools, hospitals, or wards for the physically handicapped (%)
People in Group quarters - Institutions for the deaf (%)
People in Group quarters - Institutions for the blind (%)
People in Group quarters - Orthopedic wards and institutions for the physically handicapped (%)
People in Group quarters - Wards in general hospitals for patients who have no usual home elsewhere (%)
People in Group quarters - Wards in military hospitals for patients who have no usual home elsewhere (%)
People in Group quarters - Juvenile institutions (%)
People in Group quarters - Long-term care (%)
People in Group quarters - Homes for abused, dependent, and neglected children (%)
People in Group quarters - Residential treatment centers for emotionally disturbed children (%)
People in Group quarters - Training schools for juvenile delinquents (%)
People in Group quarters - Short-term care, detention or diagnostic centers for delinquent children (%)
People in Group quarters - Type of juvenile institution unknown (%)
People in Group quarters - Noninstitutionalized population (%)
People in Group quarters - College dormitories (includes college quarters off campus) (%)
People in Group quarters - Military quarters (%)
People in Group quarters - On base (%)
People in Group quarters - Barracks, unaccompanied personnel housing (UPH), (Enlisted/Officer), ;and similar group living quarters for military personnel (%)
People in Group quarters - Transient quarters for temporary residents (%)
People in Group quarters - Military ships (%)
People in Group quarters - Group homes (%)
People in Group quarters - Homes or halfway houses for drug/alcohol abuse (%)
People in Group quarters - Homes for the mentally ill (%)
People in Group quarters - Homes for the mentally retarded (%)
People in Group quarters - Homes for the physically handicapped (%)
People in Group quarters - Other group homes (%)
People in Group quarters - Religious group quarters (%)
People in Group quarters - Dormitories (%)
People in Group quarters - Agriculture workers' dormitories on farms (%)
People in Group quarters - Job Corps and vocational training facilities (%)
People in Group quarters - Other workers' dormitories (%)
People in Group quarters - Crews of maritime vessels (%)
People in Group quarters - Other nonhousehold living situations (%)
People in Group quarters - Other noninstitutional group quarters (%)
Residents speaking English at home (%)
Residents speaking English at home - Born in the United States (%)
Residents speaking English at home - Native, born elsewhere (%)
Residents speaking English at home - Foreign born (%)
Residents speaking Spanish at home (%)
Residents speaking Spanish at home - Born in the United States (%)
Residents speaking Spanish at home - Native, born elsewhere (%)
Residents speaking Spanish at home - Foreign born (%)
Residents speaking other language at home (%)
Residents speaking other language at home - Born in the United States (%)
Residents speaking other language at home - Native, born elsewhere (%)
Residents speaking other language at home - Foreign born (%)
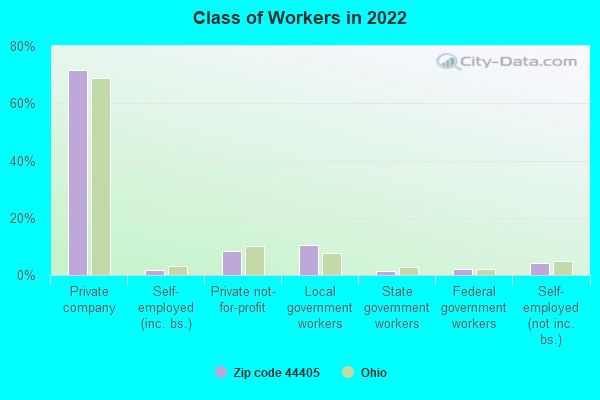
Class of Workers - Employee of private company (%)
Class of Workers - Self-employed in own incorporated business (%)
Class of Workers - Private not-for-profit wage and salary workers (%)
Class of Workers - Local government workers (%)
Class of Workers - State government workers (%)
Class of Workers - Federal government workers (%)
Class of Workers - Self-employed workers in own not incorporated business and Unpaid family workers (%)
House heating fuel used in houses and condos - Utility gas (%)
House heating fuel used in houses and condos - Bottled, tank, or LP gas (%)
House heating fuel used in houses and condos - Electricity (%)
House heating fuel used in houses and condos - Fuel oil, kerosene, etc. (%)
House heating fuel used in houses and condos - Coal or coke (%)
House heating fuel used in houses and condos - Wood (%)
House heating fuel used in houses and condos - Solar energy (%)
House heating fuel used in houses and condos - Other fuel (%)
House heating fuel used in houses and condos - No fuel used (%)
House heating fuel used in apartments - Utility gas (%)
House heating fuel used in apartments - Bottled, tank, or LP gas (%)
House heating fuel used in apartments - Electricity (%)
House heating fuel used in apartments - Fuel oil, kerosene, etc. (%)
House heating fuel used in apartments - Coal or coke (%)
House heating fuel used in apartments - Wood (%)
House heating fuel used in apartments - Solar energy (%)
House heating fuel used in apartments - Other fuel (%)
House heating fuel used in apartments - No fuel used (%)
Armed forces status - In Armed Forces (%)
Armed forces status - Civilian (%)
Armed forces status - Civilian - Veteran (%)
Armed forces status - Civilian - Nonveteran (%)
Fatal accidents locations in years 2005-2021
Fatal accidents locations in 2005
Fatal accidents locations in 2006
Fatal accidents locations in 2007
Fatal accidents locations in 2008
Fatal accidents locations in 2009
Fatal accidents locations in 2010
Fatal accidents locations in 2011
Fatal accidents locations in 2012
Fatal accidents locations in 2013
Fatal accidents locations in 2014
Fatal accidents locations in 2015
Fatal accidents locations in 2016
Fatal accidents locations in 2017
Fatal accidents locations in 2018
Fatal accidents locations in 2019
Fatal accidents locations in 2020
Fatal accidents locations in 2021
Alcohol use - People drinking some alcohol every month (%)
Alcohol use - People not drinking at all (%)
Alcohol use - Average days/month drinking alcohol
Alcohol use - Average drinks/week
Alcohol use - Average days/year people drink much
Audiometry - Average condition of hearing (%)
Audiometry - People that can hear a whisper from across a quiet room (%)
Audiometry - People that can hear normal voice from across a quiet room (%)
Audiometry - Ears ringing, roaring, buzzing (%)
Audiometry - Had a job exposure to loud noise (%)
Audiometry - Had off-work exposure to loud noise (%)
Blood Pressure & Cholesterol - Has high blood pressure (%)
Blood Pressure & Cholesterol - Checking blood pressure at home (%)
Blood Pressure & Cholesterol - Frequently checking blood cholesterol (%)
Blood Pressure & Cholesterol - Has high cholesterol level (%)
Consumer Behavior - Money monthly spent on food at supermarket/grocery store
Consumer Behavior - Money monthly spent on food at other stores
Consumer Behavior - Money monthly spent on eating out
Consumer Behavior - Money monthly spent on carryout/delivered foods
Consumer Behavior - Income spent on food at supermarket/grocery store (%)
Consumer Behavior - Income spent on food at other stores (%)
Consumer Behavior - Income spent on eating out (%)
Consumer Behavior - Income spent on carryout/delivered foods (%)
Current Health Status - General health condition (%)
Current Health Status - Blood donors (%)
Current Health Status - Has blood ever tested for HIV virus (%)
Current Health Status - Left-handed people (%)
Dermatology - People using sunscreen (%)
Diabetes - Diabetics (%)
Diabetes - Had a blood test for high blood sugar (%)
Diabetes - People taking insulin (%)
Diet Behavior & Nutrition - Diet health (%)
Diet Behavior & Nutrition - Milk product consumption (# of products/month)
Diet Behavior & Nutrition - Meals not home prepared (#/week)
Diet Behavior & Nutrition - Meals from fast food or pizza place (#/week)
Diet Behavior & Nutrition - Ready-to-eat foods (#/month)
Diet Behavior & Nutrition - Frozen meals/pizza (#/month)
Drug Use - People that ever used marijuana or hashish (%)
Drug Use - Ever used hard drugs (%)
Drug Use - Ever used any form of cocaine (%)
Drug Use - Ever used heroin (%)
Drug Use - Ever used methamphetamine (%)
Health Insurance - People covered by health insurance (%)
Kidney Conditions-Urology - Avg. # of times urinating at night
Medical Conditions - People with asthma (%)
Medical Conditions - People with anemia (%)
Medical Conditions - People with psoriasis (%)
Medical Conditions - People with overweight (%)
Medical Conditions - Elderly people having difficulties in thinking or remembering (%)
Medical Conditions - People who ever received blood transfusion (%)
Medical Conditions - People having trouble seeing even with glass/contacts (%)
Medical Conditions - People with arthritis (%)
Medical Conditions - People with gout (%)
Medical Conditions - People with congestive heart failure (%)
Medical Conditions - People with coronary heart disease (%)
Medical Conditions - People with angina pectoris (%)
Medical Conditions - People who ever had heart attack (%)
Medical Conditions - People who ever had stroke (%)
Medical Conditions - People with emphysema (%)
Medical Conditions - People with thyroid problem (%)
Medical Conditions - People with chronic bronchitis (%)
Medical Conditions - People with any liver condition (%)
Medical Conditions - People who ever had cancer or malignancy (%)
Mental Health - People who have little interest in doing things (%)
Mental Health - People feeling down, depressed, or hopeless (%)
Mental Health - People who have trouble sleeping or sleeping too much (%)
Mental Health - People feeling tired or having little energy (%)
Mental Health - People with poor appetite or overeating (%)
Mental Health - People feeling bad about themself (%)
Mental Health - People who have trouble concentrating on things (%)
Mental Health - People moving or speaking slowly or too fast (%)
Mental Health - People having thoughts they would be better off dead (%)
Oral Health - Average years since last visit a dentist
Oral Health - People embarrassed because of mouth (%)
Oral Health - People with gum disease (%)
Oral Health - General health of teeth and gums (%)
Oral Health - Average days a week using dental floss/device
Oral Health - Average days a week using mouthwash for dental problem
Oral Health - Average number of teeth
Pesticide Use - Households using pesticides to control insects (%)
Pesticide Use - Households using pesticides to kill weeds (%)
Physical Activity - People doing vigorous-intensity work activities (%)
Physical Activity - People doing moderate-intensity work activities (%)
Physical Activity - People walking or bicycling (%)
Physical Activity - People doing vigorous-intensity recreational activities (%)
Physical Activity - People doing moderate-intensity recreational activities (%)
Physical Activity - Average hours a day doing sedentary activities
Physical Activity - Average hours a day watching TV or videos
Physical Activity - Average hours a day using computer
Physical Functioning - People having limitations keeping them from working (%)
Physical Functioning - People limited in amount of work they can do (%)
Physical Functioning - People that need special equipment to walk (%)
Physical Functioning - People experiencing confusion/memory problems (%)
Physical Functioning - People requiring special healthcare equipment (%)
Prescription Medications - Average number of prescription medicines taking
Preventive Aspirin Use - Adults 40+ taking low-dose aspirin (%)
Reproductive Health - Vaginal deliveries (%)
Reproductive Health - Cesarean deliveries (%)
Reproductive Health - Deliveries resulted in a live birth (%)
Reproductive Health - Pregnancies resulted in a delivery (%)
Reproductive Health - Women breastfeeding newborns (%)
Reproductive Health - Women that had a hysterectomy (%)
Reproductive Health - Women that had both ovaries removed (%)
Reproductive Health - Women that have ever taken birth control pills (%)
Reproductive Health - Women taking birth control pills (%)
Reproductive Health - Women that have ever used Depo-Provera or injectables (%)
Reproductive Health - Women that have ever used female hormones (%)
Sexual Behavior - People 18+ that ever had sex (vaginal, anal, or oral) (%)
Sexual Behavior - Males 18+ that ever had vaginal sex with a woman (%)
Sexual Behavior - Males 18+ that ever performed oral sex on a woman (%)
Sexual Behavior - Males 18+ that ever had anal sex with a woman (%)
Sexual Behavior - Males 18+ that ever had any sex with a man (%)
Sexual Behavior - Females 18+ that ever had vaginal sex with a man (%)
Sexual Behavior - Females 18+ that ever performed oral sex on a man (%)
Sexual Behavior - Females 18+ that ever had anal sex with a man (%)
Sexual Behavior - Females 18+ that ever had any kind of sex with a woman (%)
Sexual Behavior - Average age people first had sex
Sexual Behavior - Average number of female sex partners in lifetime (males 18+)
Sexual Behavior - Average number of female vaginal sex partners in lifetime (males 18+)
Sexual Behavior - Average age people first performed oral sex on a woman (18+)
Sexual Behavior - Average number of woman performed oral sex on in lifetime (18+)
Sexual Behavior - Average number of male sex partners in lifetime (males 18+)
Sexual Behavior - Average number of male anal sex partners in lifetime (males 18+)
Sexual Behavior - Average age people first performed oral sex on a man (18+)
Sexual Behavior - Average number of male oral sex partners in lifetime (18+)
Sexual Behavior - People using protection when performing oral sex (%)
Sexual Behavior - Average number of times people have vaginal or anal sex a year
Sexual Behavior - People having sex without condom (%)
Sexual Behavior - Average number of male sex partners in lifetime (females 18+)
Sexual Behavior - Average number of male vaginal sex partners in lifetime (females 18+)
Sexual Behavior - Average number of female sex partners in lifetime (females 18+)
Sexual Behavior - Circumcised males 18+ (%)
Sleep Disorders - Average hours sleeping at night
Sleep Disorders - People that has trouble sleeping (%)
Smoking-Cigarette Use - People smoking cigarettes (%)
Taste & Smell - People 40+ having problems with smell (%)
Taste & Smell - People 40+ having problems with taste (%)
Taste & Smell - People 40+ that ever had wisdom teeth removed (%)
Taste & Smell - People 40+ that ever had tonsils teeth removed (%)
Taste & Smell - People 40+ that ever had a loss of consciousness because of a head injury (%)
Taste & Smell - People 40+ that ever had a broken nose or other serious injury to face or skull (%)
Taste & Smell - People 40+ that ever had two or more sinus infections (%)
Weight - Average height (inches)
Weight - Average weight (pounds)
Weight - Average BMI
Weight - People that are obese (%)
Weight - People that ever were obese (%)
Weight - People trying to lose weight (%)
100%
urban population.
Estimated median house/condo value in 2022: $84,513
44405:
$84,513Ohio:
$204,100
According to our research of Ohio and other state lists, there were 17 registered sex offenders living in 44405 zip code as of May 31, 2024 . The ratio of all residents to sex offenders in zip code 44405 is 480 to 1.The ratio of registered sex offenders to all residents in this zip code is near the state average.
Median resident age: This zip code:
40.2 yearsOhio median age:
39.9 years
Average household size: This zip code:
2.4 peopleOhio:
2.4 people
Averages for the 2020 tax year for zip code 44405, filed in 2021:
Average Adjusted Gross Income (AGI) in 2020: $37,639 (Individual Income Tax Returns) Here:
$37,639State:
$67,288
Salary/wage: $33,478 (reported on 80.7% of returns )Here:
$33,478State:
$55,628
(% of AGI for various income ranges: 991.7% for AGIs below $25k , 3180.0% for AGIs $25k-50k , 5668.8% for AGIs $50k-75k , 9754.5% for AGIs $75k-100k , 13491.8% for AGIs $100k-200k ) Taxable interest for individuals: $1,092 (reported on 17.4% of returns )This zip code:
$1,092Ohio:
$1,518
(% of AGI for various income ranges: 6.3% for AGIs below $25k , 12.7% for AGIs $25k-50k , 66.8% for AGIs $50k-75k , 60.9% for AGIs $75k-100k , 38.2% for AGIs $100k-200k ) Ordinary dividends: $2,811 (reported on 9.7% of returns )(% of AGI for various income ranges: 7.5% for AGIs below $25k , 18.4% for AGIs $25k-50k , 64.1% for AGIs $50k-75k , 121.8% for AGIs $75k-100k , 325.5% for AGIs $100k-200k ) Net capital gain/loss in AGI: +$5,483 (reported on 8.0% of returns )Here:
+$5,483State:
+$18,919
(% of AGI for various income ranges: 1.7% for AGIs below $25k , 27.4% for AGIs $25k-50k , 30.6% for AGIs $50k-75k , 107.3% for AGIs $75k-100k , 990.9% for AGIs $100k-200k ) Profit/loss from business: +$5,110 (reported on 11.0% of returns )Here:
+$5,110State:
+$13,744
(% of AGI for various income ranges: 91.0% for AGIs below $25k , 21.3% for AGIs $25k-50k , 52.9% for AGIs $50k-75k , 380.9% for AGIs $100k-200k ) Taxable individual retirement arrangement distribution: $10,376 (reported on 6.9% of returns )44405:
$10,376Ohio:
$18,876
(% of AGI for various income ranges: 32.0% for AGIs below $25k , 60.2% for AGIs $25k-50k , 252.6% for AGIs $50k-75k , 670.0% for AGIs $100k-200k ) Total itemized deductions: $24,350 (reported on 1.7% of returns )Here:
$24,350State:
$33,869
(% of AGI for various income ranges: 257.6% for AGIs $50k-75k , 531.8% for AGIs $100k-200k ) Charity contributions: $7,100 (reported on 1.1% of returns )(% of AGI for various income ranges: 7.7% for AGIs below $25k , 161.8% for AGIs $75k-100k ) Taxes paid: $5,200 (reported on 1.7% of returns )(% of AGI for various income ranges: 42.1% for AGIs $50k-75k , 153.6% for AGIs $100k-200k ) Earned income credit: $2,541 (reported on 29.8% of returns )(% of AGI for various income ranges: 140.4% for AGIs below $25k , 88.2% for AGIs $25k-50k ) Percentage of individuals using paid preparers for their 2020 taxes: 94.5%(% for various income ranges: 94.1% for AGIs below $25k , 95.5% for AGIs $25k-50k , 95.5% for AGIs $50k-75k , 88.9% for AGIs $75k-100k , 93.8% for AGIs $100k-200k , 100.0% for AGIs over 200k )
Averages for the 2012 tax year for zip code 44405, filed in 2013:
Average Adjusted Gross Income (AGI) in 2012: $36,725 (Individual Income Tax Returns) Here:
$36,725State:
$54,926
Salary/wage: $30,851 (reported on 81.5% of returns )Here:
$30,851State:
$45,869
(% of AGI for various income ranges: 70.8% for AGIs below $25k , 75.7% for AGIs $25k-50k , 71.1% for AGIs $50k-75k , 69.7% for AGIs $75k-100k , 75.2% for AGIs $100k-200k , 44.0% for AGIs over 200k ) Taxable interest for individuals: $1,139 (reported on 25.4% of returns )This zip code:
$1,139Ohio:
$1,297
(% of AGI for various income ranges: 1.1% for AGIs below $25k , 0.9% for AGIs $25k-50k , 0.9% for AGIs $50k-75k , 0.8% for AGIs $75k-100k , 0.3% for AGIs $100k-200k , 0.5% for AGIs over 200k ) Ordinary dividends: $2,102 (reported on 12.5% of returns )(% of AGI for various income ranges: 0.8% for AGIs below $25k , 0.6% for AGIs $25k-50k , 0.8% for AGIs $50k-75k , 1.6% for AGIs $75k-100k , 0.8% for AGIs $100k-200k ) Net capital gain/loss in AGI: +$435 (reported on 6.6% of returns )(% of AGI for various income ranges: 0.1% for AGIs $75k-100k , 1.1% for AGIs $100k-200k ) Profit/loss from business: +$7,094 (reported on 10.0% of returns )Here:
+$7,094State:
+$12,773
(% of AGI for various income ranges: 7.2% for AGIs below $25k , 0.8% for AGIs $25k-50k , 0.7% for AGIs $50k-75k , 2.3% for AGIs $75k-100k ) Taxable individual retirement arrangement distribution: $8,153 (reported on 8.5% of returns )(% of AGI for various income ranges: 2.3% for AGIs below $25k , 1.8% for AGIs $25k-50k , 1.7% for AGIs $50k-75k , 5.8% for AGIs $75k-100k ) Total itemized deductions: $18,407 (17% of AGI, reported on 12.8% of returns )Here:
$18,407State:
$21,278
Here:
17.2% of AGIState:
18.8% of AGI
(% of AGI for various income ranges: 2.6% for AGIs below $25k , 4.5% for AGIs $25k-50k , 7.0% for AGIs $50k-75k , 8.7% for AGIs $75k-100k , 11.3% for AGIs $100k-200k , 7.8% for AGIs over 200k ) Charity contributions: $2,917 (reported on 10.3% of returns )(% of AGI for various income ranges: 0.2% for AGIs below $25k , 0.6% for AGIs $25k-50k , 0.8% for AGIs $50k-75k , 1.9% for AGIs $75k-100k , 1.4% for AGIs $100k-200k , 0.5% for AGIs over 200k ) Taxes paid: $7,253 (reported on 12.8% of returns )(% of AGI for various income ranges: 0.3% for AGIs below $25k , 1.1% for AGIs $25k-50k , 1.8% for AGIs $50k-75k , 3.0% for AGIs $75k-100k , 5.0% for AGIs $100k-200k , 6.1% for AGIs over 200k ) Earned income credit: $2,502 (reported on 28.8% of returns )(% of AGI for various income ranges: 9.2% for AGIs below $25k , 1.2% for AGIs $25k-50k ) Percentage of individuals using paid preparers for their 2012 taxes: 51.9%(% for various income ranges: 45.3% for AGIs below $25k , 56.2% for AGIs $25k-50k , 63.2% for AGIs $50k-75k , 63.2% for AGIs $75k-100k , 66.7% for AGIs $100k-200k , 66.7% for AGIs over 200k )
Averages for the 2004 tax year for zip code 44405, filed in 2005:
Average Adjusted Gross Income (AGI) in 2004: $30,892 (Individual Income Tax Returns) Here:
$30,892State:
$44,480
Salary/wage: $27,395 (reported on 82.7% of returns )Here:
$27,395State:
$39,198
(% of AGI for various income ranges: 84.4% for AGIs below $10k , 71.9% for AGIs $10k-25k , 78.1% for AGIs $25k-50k , 79.7% for AGIs $50k-75k , 78.3% for AGIs $75k-100k , 52.5% for AGIs over 100k ) Taxable interest for individuals: $1,659 (reported on 41.4% of returns )This zip code:
$1,659Ohio:
$1,532
(% of AGI for various income ranges: 6.1% for AGIs below $10k , 3.1% for AGIs $10k-25k , 1.8% for AGIs $25k-50k , 2.1% for AGIs $50k-75k , 1.9% for AGIs $75k-100k , 1.5% for AGIs over 100k ) Taxable dividends: $1,537 (reported on 19.1% of returns )(% of AGI for various income ranges: 3.1% for AGIs below $10k , 1.3% for AGIs $10k-25k , 0.6% for AGIs $25k-50k , 1.3% for AGIs $50k-75k , 0.9% for AGIs $75k-100k , 0.5% for AGIs over 100k ) Net capital gain/loss: +$1,502 (reported on 11.1% of returns )Here:
+$1,502State:
+$8,582
(% of AGI for various income ranges: -1.9% for AGIs below $10k , -0.2% for AGIs $10k-25k , 0.3% for AGIs $25k-50k , -0.1% for AGIs $50k-75k , 0.1% for AGIs $75k-100k , 3.4% for AGIs over 100k ) Profit/loss from business: +$5,888 (reported on 8.0% of returns )Here:
+$5,888State:
+$10,813
(% of AGI for various income ranges: 4.0% for AGIs below $10k , 2.6% for AGIs $10k-25k , 0.8% for AGIs $25k-50k , 1.6% for AGIs $50k-75k , 3.7% for AGIs $75k-100k , -0.2% for AGIs over 100k ) IRA payment deduction: $1,957 (reported on 1.9% of returns )Total itemized deductions: $14,272 (21% of AGI, reported on 18.1% of returns )Here:
$14,272State:
$17,503
Here:
20.8% of AGIState:
20.8% of AGI
(% of AGI for various income ranges: 7.3% for AGIs below $10k , 3.1% for AGIs $10k-25k , 6.6% for AGIs $25k-50k , 10.0% for AGIs $50k-75k , 13.4% for AGIs $75k-100k , 11.9% for AGIs over 100k ) Charity contributions deductions: $2,219 (3% of AGI, reported on 16.2% of returns )Here:
3.1% of AGIState:
3.4% of AGI
(% of AGI for various income ranges: 0.4% for AGIs below $10k , 0.5% for AGIs $10k-25k , 0.8% for AGIs $25k-50k , 1.7% for AGIs $50k-75k , 2.4% for AGIs $75k-100k , 1.4% for AGIs over 100k ) Total tax: $4,266 (reported on 66.0% of returns )(% of AGI for various income ranges: 1.8% for AGIs below $10k , 3.2% for AGIs $10k-25k , 6.6% for AGIs $25k-50k , 9.3% for AGIs $50k-75k , 11.3% for AGIs $75k-100k , 19.8% for AGIs over 100k ) Earned income credit: $1,811 (reported on 24.1% of returns )Percentage of individuals using paid preparers for their 2004 taxes: 57.0%(% for various income ranges: 48.6% for AGIs below $10k , 56.7% for AGIs $10k-25k , 59.0% for AGIs $25k-50k , 65.7% for AGIs $50k-75k , 63.6% for AGIs $75k-100k , 71.0% for AGIs over 100k )
Estimated median household income in 2022: This zip code:
$42,145Ohio:
$65,720
Nearest zip codes: 44471 ,
44506 ,
44502 ,
44505 ,
44503 ,
44436 .
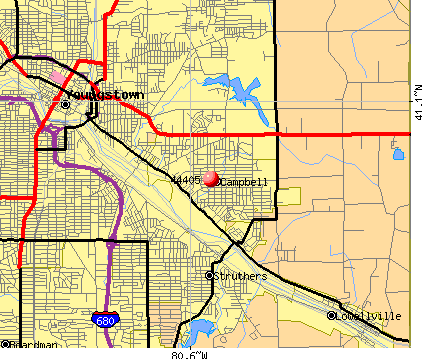
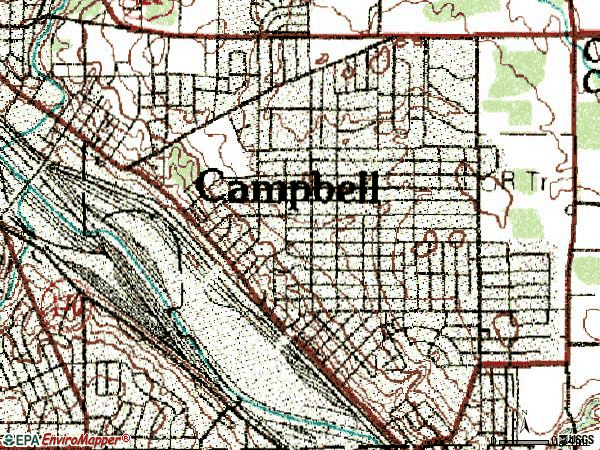
Campbell Zip Code Map
Percentage of family households: This zip code:
42.4%Ohio:
43.3%
Percentage of households with unmarried partners: This zip code:
11.3%Ohio:
44.6%
Likely homosexual households (counted as self-reported same-sex unmarried-partner households)
Lesbian couples: 1.1% of all households Gay men: 0.0% of all households
Household received Food Stamps/SNAP in the past 12 months: 956Household did not receive Food Stamps/SNAP in the past 12 months: 2,344
Women who had a birth in the past 12 months: 74 (9 now married , 62 unmarried) Women who did not have a birth in the past 12 months: 1,724 (530 now married , 1,193 unmarried)
Housing units in zip code 44405 with a mortgage: 881 (33
second mortgage , 27
both second mortgage and home equity loan )
Houses without a mortgage: 23
Median monthly owner costs for units with a mortgage: $1,045
Median monthly owner costs for units without a mortgage: $403
Residents with income below the poverty level in 2022:
This zip code:
28.7%Whole state:
13.4%
Residents with income below 50% of the poverty level in 2022:
This zip code:
16.7%Whole state:
7.0%
Median number of rooms in houses and condos: Median number of rooms in apartments: Notable locations in this zip code not listed on our city pages
Click to draw/clear zip code borders Notable locations in zip code 44405: (A) , Campbell Fire Department (B) , Campbell Branch Library (C) . Display/hide their locations on the map
Churches in zip code 44405 include: (A) , Faith Temple Baptist Church (B) , Bible Baptist Temple (C) , Assembly of Truth Church (D) , Archangel Michael Greek Orthodox Church (E) , Gospel Temple Baptist Church (F) , True Vine Outreach Ministry (G) , Mission Cristianos Unidos (H) , Greater Liberty Baptist Church (I) . Display/hide their locations on the map
Cemeteries: (1) , Saint Johns Cemetery (2) . Display/hide their locations on the map
Parks in zip code 44405 include: (1) , Gordon Park (2) . Display/hide their locations on the map
Year house built (houses)
0 2020 or later6 2010 to 2019221 2000 to 200971 1990 to 199998 1980 to 1989572 1970 to 1979557 1960 to 1969852 1950 to 1959188 1940 to 19491,048 1939 or earlier
Zip code 44405 household income distribution in 2022 388 Less than $10,000334 $10,000 to $14,999151 $15,000 to $19,999147 $20,000 to $24,999249 $25,000 to $29,999213 $30,000 to $34,999117 $35,000 to $39,999151 $40,000 to $44,999132 $45,000 to $49,999299 $50,000 to $59,999324 $60,000 to $74,999316 $75,000 to $99,999151 $100,000 to $124,99977 $125,000 to $149,999166 $150,000 to $199,99986 $200,000 or moreEstimate of home value of owner-occupied houses/condos in 2022 in zip code 44405 36 Less than $10,00073 $10,000 to $14,99963 $15,000 to $19,99939 $20,000 to $24,99966 $25,000 to $29,99999 $30,000 to $34,99938 $35,000 to $39,999141 $40,000 to $49,999145 $50,000 to $59,999143 $60,000 to $69,999288 $70,000 to $79,99993 $80,000 to $89,99969 $90,000 to $99,999181 $100,000 to $124,999184 $125,000 to $149,99990 $150,000 to $174,99914 $175,000 to $199,99966 $200,000 to $249,99926 $250,000 to $299,9996 $300,000 to $399,999148 $400,000 to $499,99913 $500,000 to $749,999Rent paid by renters in 2022 in zip code 44405 47 Less than $1007 $100 to $14912 $150 to $19964 $200 to $24919 $250 to $2999 $300 to $34934 $350 to $39969 $400 to $44989 $450 to $49948 $500 to $54957 $550 to $599244 $600 to $64996 $650 to $699106 $700 to $74956 $750 to $7995 $800 to $899100 No cash rent
Median gross rent in 2022: $712.
Median price asked for vacant for-sale houses and condos in 2022: $125,350.
Estimated median house (or condo) value in 2022 for: White Non-Hispanic householders: $83,259Black or African American householders: $84,373American Indian or Alaska Native householders: $313,268Asian householders: $118,345Some other race householders: $92,309Two or more races householders: $38,288Hispanic or Latino householders: $91,056Estimated median house or condo value in 2022: $84,513
44405:
$84,513Ohio:
$204,100
Lower value quartile - upper value quartile: $52,268 - $142,924
Mean price in 2022: Detached houses: $172,894Here:
$172,894State:
$254,366
Townhouses or other attached units: $173,222Here:
$173,222State:
$225,733
In 2-unit structures: $157,188Here:
$157,188State:
$144,384
In 3-to-4-unit structures: $133,041Here:
$133,041State:
$203,002
In 5-or-more-unit structures: $270,541Here:
$270,541State:
$211,593
Mobile homes: $39,259Here:
$39,259State:
$62,719
Housing units in structures:
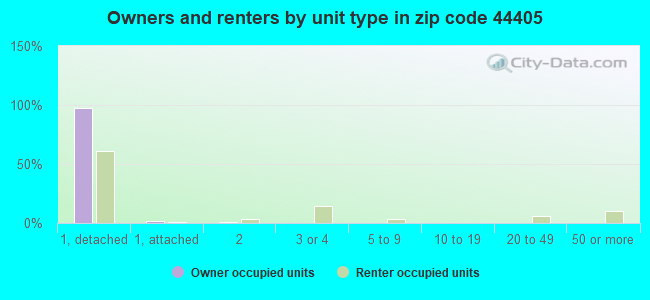
One, detached: 2,976One, attached: 54Two: 503 or 4: 2235 to 9: 11110 to 19: 1220 to 49: 6550 or more: 161Mobile homes: 7Unemployment : 10.1%
Means of transportation to work in zip code 44405 67.4% 2,053 Drove a car alone15.3% 465 Carpooled0.8% 23 Bus or trolley bus2.0% 60 Taxi0.5% 14 Walked3.7% 112 Other means11.4% 346 Worked at homeTravel time to work (commute) in zip code 44405 70 Less than 5 minutes480 5 to 9 minutes407 10 to 14 minutes519 15 to 19 minutes387 20 to 24 minutes239 25 to 29 minutes277 30 to 34 minutes30 35 to 39 minutes37 40 to 44 minutes120 45 to 59 minutes85 60 to 89 minutes30 90 or more minutes
Percentage of zip code residents living and working in this county: 80.0%
Household type by relationship:
Households: 7,828
Male householders: 1,593 (594 living alone ), Female householders: 1,691 (527 living alone )1,003 spouses (1,003 opposite-sex spouses ), 349 unmarried partners , (344 opposite-sex unmarried partners ), 2,430 children (2,305 natural , 41 adopted , 84 stepchildren ), 303 grandchildren , 144 brothers or sisters , 147 parents , 0 foster children , 71 other relatives , 85 non-relatives
Size of family households: 892 2-persons , 417 3-persons , 403 4-persons , 241 5-persons , 36 6-persons , 40 7-or-more-persons
Size of nonfamily households: 1,119 1-person , 120 2-persons
855 married couples with children. single-parent households (144 men , 815 women ).
76.6% of residents of 44405 zip code speak English at home. of residents speak Spanish at home (60% very well, 18% well, 12% not well, 10% not at all ).of residents speak other Indo-European language at home (88% very well, 12% well ).of residents speak other language at home (89% very well, 11% not well ).
Foreign born population: 268 (3.4%)
(67.2%
of them are naturalized citizens )
This zip code:
3.4%Whole state:
5.0%
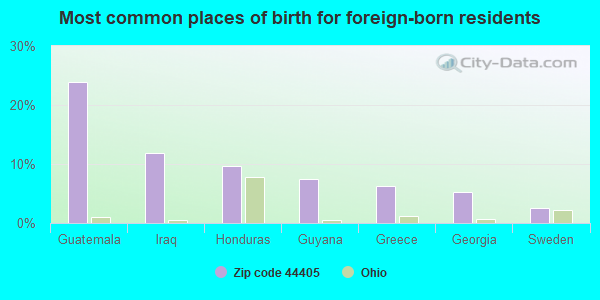
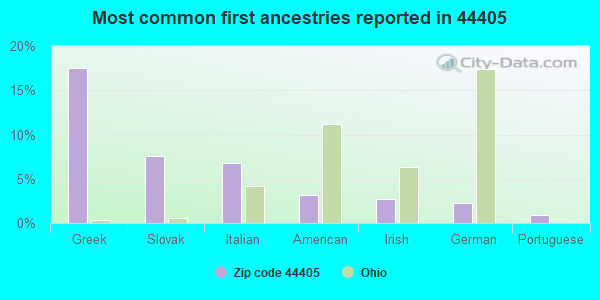
24% Guatemala 12% Iraq 10% Honduras 7% Guyana 6% Greece 5% Georgia 3% Sweden 18% Greek 8% Slovak 7% Italian 3% American 3% Irish 2% German 1% Portuguese
Year of entry for the foreign-born population
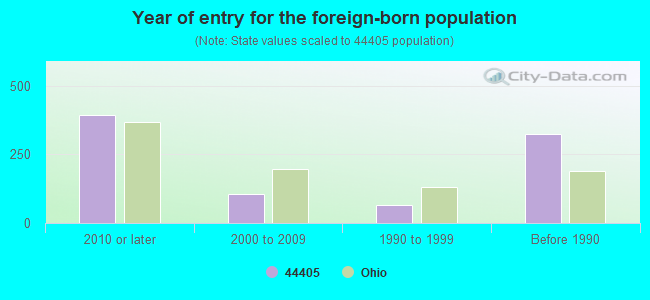
393 2010 or later 104 2000 to 2009 66 1990 to 1999 324 Before 1990
Facilities with environmental interests located in this zip code:
BECKS AMOCO (2209 WILSON AVE in CAMPBELL, OH)
STATE MASTER (Ohio general info) - AIR MAJOR, RCRA-OHR000030742, HAZARDOUS WASTE PROGRAM Conditionally Exempt Small Quantity Generators, less than 100 kg/month of hazardous waste (Resource Conservation and Recovery Act (tracking hazardous waste)) - notification Organizations: THE LYDEN CO (CONTACT/OWNER)
, LYDEN COMPANY (CONTACT/OWNER)
Alternative names: LYDEN AMOCO BECK NO 103
AT&T LONG LINES CAMPBELL (1MI E & 2MI N OF STRUTHERS in CAMPBELL, OH)
(Resource Conservation and Recovery Act (tracking hazardous waste))
Housing units lacking complete plumbing facilities: 5.4%
Housing units lacking complete kitchen facilities: 3.7%
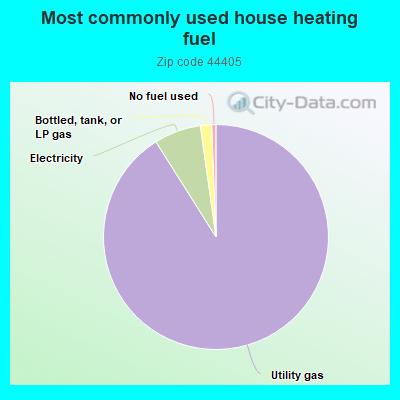
90.6% Utility gas 6.7% Electricity 1.6% Bottled, tank, or LP gas 0.6% No fuel used
Population in 1990: 10,027.
Place of birth for U.S.-born residents:
This state: 5,443Northeast: 760Midwest: 157South: 486West: 110
67% of the 44405 zip code residents lived in the same house 5 years ago.
Out of people who lived in different houses, 80% lived in this county.
Out of people who lived in different counties, 50% lived in Ohio.
90% of the 44405 zip code residents lived in the same house 1 year ago.
Out of people who lived in different houses, 54% moved from this county.
Out of people who lived in different houses, 18% moved from different county within same state.
Out of people who lived in different houses, 16% moved from different state.
Out of people who lived in different houses, 14% moved from abroad.
Private vs. public school enrollment:
Students in private schools in grades 1 to 8 (elementary and middle school): 61
Students in private schools in grades 9 to 12 (high school): 30
Students in private undergraduate colleges: 49
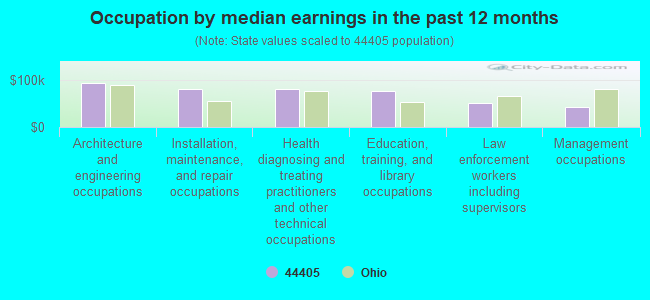
Occupation by median earnings in the past 12 months ($)
93,136 Architecture and engineering occupations 79,519 Installation, maintenance, and repair occupations 79,470 Health diagnosing and treating practitioners and other technical occupations 75,327 Education, training, and library occupations 50,210 Law enforcement workers including supervisors 43,310 Management occupations
Companies with federal contracts located in this zip code:
HAMBRICK, INC (126 JEFFERSON STREET in CAMPBELL, OH; small business) in 133 contracts from 1999 to 2004
Contracts for Construction of Structures and Facilities -- Office Buildings, Maintenance, Repair or Alteration of Real Property -- Miscellaneous Buildings, Maintenance, Repair or Alteration of Real Property -- Office Buildings, Hazardous Substance Removal, Cleanup, and Disposal Services and Operational Support, and more by Department of Veterans Affairs, Army, NASA, Air Force, and others Signed by year: 2000: $3,998,840; 2001: $7,698,032; 2002: $4,257,293; 2003: $2,605,272; 2004: $16,697; 2005: $0; 2006: $0.
Biggest contracts: with Department of Veterans Affairs for Construction of Structures and Facilities -- Office Buildings. Signed on 2001-09-15. Completion date: 2003-05-15.
with Army for Maintenance, Repair or Alteration of Real Property -- Miscellaneous Buildings. Signed on 2002-07-30. Completion date: 2003-03-26.
with NASA for Maintenance, Repair or Alteration of Real Property -- Miscellaneous Buildings. Signed on 2000-02-15. Completion date: 2000-03-15.
with Air Force for Maintenance, Repair or Alteration of Real Property -- Office Buildings. Signed on 2001-09-30. Completion date: 2002-03-03.
Top industries in this zip code by the number of employees in 2005:
Construction: Painting and Wall Covering Contractors (50-99 employees: 1 establishment, 20-49 employees: 1 establishment, 10-19 employees: 2 establishments, 5-9 employees: 1 establishment, 1-4 employees: 10 establishments)Other Services (except Public Administration): Religious Organizations (10-19: 1, 5-9: 3, 1-4: 3)Health Care and Social Assistance: Offices of Physicians (except Mental Health Specialists) (20-49: 1)Accommodation and Food Services: Full-Service Restaurants (20-49: 1)Educational Services: Elementary and Secondary Schools (20-49: 1)Finance and Insurance: Commercial Banking (5-9: 3)Accommodation and Food Services: Limited-Service Restaurants (10-19: 1, 1-4: 1)
Fatal accident statistics in 2011:
Fatal accident count: 1Vehicles involved in fatal accidents: 2Fatal accidents caused by drunken drivers: 0Fatalities: 1Persons involved in fatal accidents: 5Pedestrians involved in fatal accidents: 0
Fatal accident statistics in 2010:
Fatal accident count: 1Vehicles involved in fatal accidents: 1Fatal accidents caused by drunken drivers: 1Fatalities: 3Persons involved in fatal accidents: 4Pedestrians involved in fatal accidents: 0
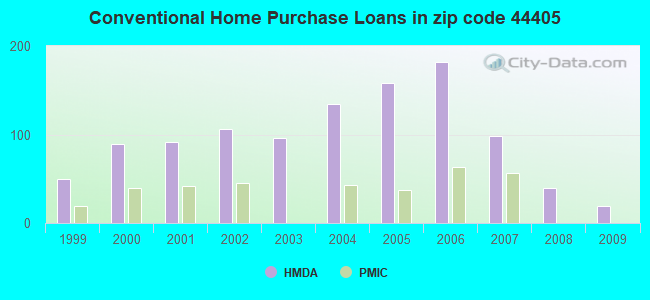
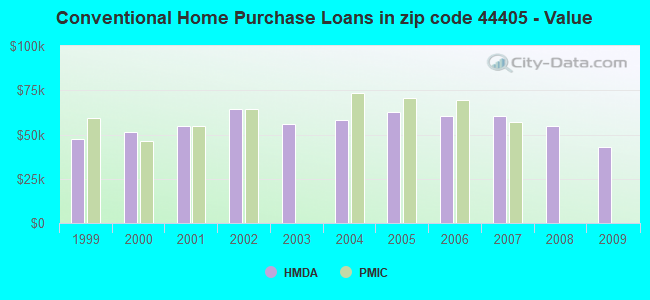
Home Mortgage Disclosure Act Aggregated Statistics For Year 2009(Based on 4 full and 4 partial tracts) A) FHA, FSA/RHS & VA B) Conventional C) Refinancings D) Home Improvement Loans F) Non-occupant Loans on Number Average Value Number Average Value Number Average Value Number Average Value Number Average Value
LOANS ORIGINATED 17 $54,825 19 $42,958 80 $71,731 3 $11,557 15 $29,973 APPLICATIONS APPROVED, NOT ACCEPTED 0 $0 0 $0 15 $64,769 4 $8,578 0 $0 APPLICATIONS DENIED 9 $67,067 4 $25,170 102 $85,724 18 $22,976 12 $29,911 APPLICATIONS WITHDRAWN 0 $0 2 $15,825 30 $72,099 3 $10,980 2 $15,825 FILES CLOSED FOR INCOMPLETENESS 0 $0 0 $0 3 $92,440 5 $10,240 0 $0
Aggregated Statistics For Year 2008(Based on 4 full and 4 partial tracts) A) FHA, FSA/RHS & VA B) Conventional C) Refinancings D) Home Improvement Loans F) Non-occupant Loans on Number Average Value Number Average Value Number Average Value Number Average Value Number Average Value
LOANS ORIGINATED 29 $70,194 40 $54,752 98 $59,740 28 $19,056 28 $37,185 APPLICATIONS APPROVED, NOT ACCEPTED 2 $48,610 0 $0 21 $38,176 5 $40,392 7 $23,739 APPLICATIONS DENIED 3 $63,420 12 $71,016 178 $76,929 57 $19,848 14 $32,305 APPLICATIONS WITHDRAWN 3 $103,997 4 $20,310 37 $72,526 0 $0 2 $11,985 FILES CLOSED FOR INCOMPLETENESS 2 $78,155 2 $50,930 4 $78,630 5 $27,716 2 $50,930
Aggregated Statistics For Year 2007(Based on 4 full and 4 partial tracts) A) FHA, FSA/RHS & VA B) Conventional C) Refinancings D) Home Improvement Loans E) Loans on Dwellings For 5+ Families F) Non-occupant Loans on Number Average Value Number Average Value Number Average Value Number Average Value Number Average Value Number Average Value
LOANS ORIGINATED 14 $73,038 98 $60,601 136 $59,815 45 $24,528 3 $219,550 30 $52,877 APPLICATIONS APPROVED, NOT ACCEPTED 0 $0 4 $57,925 31 $91,742 11 $25,215 0 $0 2 $66,820 APPLICATIONS DENIED 3 $56,770 31 $57,062 217 $68,463 72 $22,149 0 $0 12 $41,382 APPLICATIONS WITHDRAWN 2 $61,040 5 $83,012 70 $67,825 12 $63,968 0 $0 3 $114,297 FILES CLOSED FOR INCOMPLETENESS 0 $0 3 $81,390 8 $55,942 0 $0 0 $0 0 $0
Aggregated Statistics For Year 2006(Based on 4 full and 4 partial tracts) A) FHA, FSA/RHS & VA B) Conventional C) Refinancings D) Home Improvement Loans F) Non-occupant Loans on Number Average Value Number Average Value Number Average Value Number Average Value Number Average Value
LOANS ORIGINATED 19 $63,197 182 $60,420 216 $61,797 43 $27,738 40 $53,386 APPLICATIONS APPROVED, NOT ACCEPTED 0 $0 33 $54,608 53 $66,405 14 $23,641 16 $41,377 APPLICATIONS DENIED 3 $100,997 103 $55,803 273 $72,645 80 $24,084 29 $51,673 APPLICATIONS WITHDRAWN 2 $78,155 34 $68,706 127 $73,207 5 $37,078 14 $43,180 FILES CLOSED FOR INCOMPLETENESS 0 $0 8 $67,651 35 $88,615 0 $0 4 $73,508
Aggregated Statistics For Year 2005(Based on 4 full and 4 partial tracts) A) FHA, FSA/RHS & VA B) Conventional C) Refinancings D) Home Improvement Loans F) Non-occupant Loans on Number Average Value Number Average Value Number Average Value Number Average Value Number Average Value
LOANS ORIGINATED 9 $73,080 158 $62,983 210 $65,055 69 $26,329 71 $52,028 APPLICATIONS APPROVED, NOT ACCEPTED 0 $0 35 $58,478 66 $65,624 13 $36,740 5 $54,278 APPLICATIONS DENIED 2 $32,405 89 $56,200 293 $70,467 69 $32,860 31 $71,284 APPLICATIONS WITHDRAWN 0 $0 55 $57,693 142 $79,167 32 $110,689 13 $61,086 FILES CLOSED FOR INCOMPLETENESS 0 $0 14 $42,376 19 $84,658 2 $48,985 0 $0
Aggregated Statistics For Year 2004(Based on 4 full and 4 partial tracts) A) FHA, FSA/RHS & VA B) Conventional C) Refinancings D) Home Improvement Loans F) Non-occupant Loans on Number Average Value Number Average Value Number Average Value Number Average Value Number Average Value
LOANS ORIGINATED 30 $75,299 134 $58,147 262 $65,499 40 $25,831 45 $36,562 APPLICATIONS APPROVED, NOT ACCEPTED 2 $26,960 31 $46,492 73 $55,203 9 $12,179 10 $42,262 APPLICATIONS DENIED 0 $0 63 $60,852 319 $63,701 80 $16,963 26 $34,184 APPLICATIONS WITHDRAWN 2 $78,375 19 $76,263 142 $74,884 10 $33,290 6 $46,723 FILES CLOSED FOR INCOMPLETENESS 0 $0 5 $35,872 25 $81,858 5 $42,504 0 $0
Aggregated Statistics For Year 2003(Based on 4 full and 4 partial tracts) A) FHA, FSA/RHS & VA B) Conventional C) Refinancings D) Home Improvement Loans F) Non-occupant Loans on Number Average Value Number Average Value Number Average Value Number Average Value Number Average Value
LOANS ORIGINATED 33 $59,921 96 $55,939 351 $60,824 38 $13,566 40 $35,385 APPLICATIONS APPROVED, NOT ACCEPTED 2 $39,940 11 $45,933 98 $64,132 9 $19,201 7 $42,766 APPLICATIONS DENIED 2 $36,950 16 $76,426 330 $61,607 72 $12,535 13 $62,307 APPLICATIONS WITHDRAWN 3 $91,437 16 $83,642 105 $68,525 9 $23,032 3 $35,670 FILES CLOSED FOR INCOMPLETENESS 2 $51,925 2 $99,860 29 $62,616 4 $14,008 2 $9,045
Aggregated Statistics For Year 2002(Based on 4 full and 4 partial tracts) A) FHA, FSA/RHS & VA B) Conventional C) Refinancings D) Home Improvement Loans E) Loans on Dwellings For 5+ Families F) Non-occupant Loans on Number Average Value Number Average Value Number Average Value Number Average Value Number Average Value Number Average Value
LOANS ORIGINATED 19 $68,909 106 $64,132 280 $63,476 38 $15,388 5 $90,432 28 $62,585 APPLICATIONS APPROVED, NOT ACCEPTED 2 $72,435 7 $56,419 108 $62,321 11 $8,409 0 $0 10 $44,536 APPLICATIONS DENIED 2 $53,505 15 $61,639 271 $64,947 64 $9,438 0 $0 7 $23,309 APPLICATIONS WITHDRAWN 2 $69,330 11 $56,021 109 $61,697 2 $47,655 0 $0 5 $47,026 FILES CLOSED FOR INCOMPLETENESS 0 $0 3 $41,197 23 $68,464 0 $0 0 $0 2 $31,450
Aggregated Statistics For Year 2001(Based on 4 full and 4 partial tracts) A) FHA, FSA/RHS & VA B) Conventional C) Refinancings D) Home Improvement Loans F) Non-occupant Loans on Number Average Value Number Average Value Number Average Value Number Average Value Number Average Value
LOANS ORIGINATED 21 $60,113 91 $54,627 265 $54,511 49 $15,617 28 $57,148 APPLICATIONS APPROVED, NOT ACCEPTED 2 $44,460 13 $46,075 75 $48,554 16 $33,019 3 $63,303 APPLICATIONS DENIED 0 $0 29 $57,472 291 $58,456 87 $12,421 19 $46,147 APPLICATIONS WITHDRAWN 3 $79,247 13 $54,071 117 $55,790 16 $15,771 3 $43,547 FILES CLOSED FOR INCOMPLETENESS 0 $0 2 $38,430 33 $67,917 0 $0 0 $0
Aggregated Statistics For Year 2000(Based on 4 full and 4 partial tracts) A) FHA, FSA/RHS & VA B) Conventional C) Refinancings D) Home Improvement Loans E) Loans on Dwellings For 5+ Families F) Non-occupant Loans on Number Average Value Number Average Value Number Average Value Number Average Value Number Average Value Number Average Value
LOANS ORIGINATED 17 $50,881 89 $51,588 144 $49,211 66 $10,368 2 $72,345 25 $45,267 APPLICATIONS APPROVED, NOT ACCEPTED 0 $0 4 $37,248 52 $44,963 27 $14,113 0 $0 0 $0 APPLICATIONS DENIED 2 $81,965 24 $41,456 208 $47,402 72 $13,922 0 $0 13 $36,130 APPLICATIONS WITHDRAWN 6 $63,302 25 $56,771 79 $45,600 10 $16,735 0 $0 2 $33,160 FILES CLOSED FOR INCOMPLETENESS 0 $0 2 $36,175 23 $55,172 0 $0 0 $0 2 $22,875
Aggregated Statistics For Year 1999(Based on 1 full and 4 partial tracts) A) FHA, FSA/RHS & VA B) Conventional C) Refinancings D) Home Improvement Loans F) Non-occupant Loans on Number Average Value Number Average Value Number Average Value Number Average Value Number Average Value
LOANS ORIGINATED 20 $53,805 50 $47,297 154 $46,833 36 $11,296 12 $36,758 APPLICATIONS APPROVED, NOT ACCEPTED 1 $24,320 8 $50,970 48 $45,586 8 $13,041 1 $27,360 APPLICATIONS DENIED 5 $36,588 18 $36,666 111 $44,867 57 $12,888 5 $29,966 APPLICATIONS WITHDRAWN 2 $25,835 5 $49,244 69 $47,803 4 $19,152 2 $45,975 FILES CLOSED FOR INCOMPLETENESS 0 $0 4 $25,078 20 $46,078 1 $27,790 0 $0
Detailed HMDA statistics for the following Tracts:
8009.00
,
8101.00 ,
8102.00 ,
8103.00
Private Mortgage Insurance Companies Aggregated Statistics For Year 2009(Based on 2 full and 2 partial tracts) A) Conventional B) Refinancings Number Average Value Number Average Value
LOANS ORIGINATED 0 $0 3 $67,130 APPLICATIONS APPROVED, NOT ACCEPTED 2 $103,995 2 $92,695 APPLICATIONS DENIED 0 $0 0 $0 APPLICATIONS WITHDRAWN 0 $0 0 $0 FILES CLOSED FOR INCOMPLETENESS 0 $0 0 $0
Aggregated Statistics For Year 2007(Based on 4 full and 4 partial tracts) A) Conventional B) Refinancings C) Non-occupant Loans on Number Average Value Number Average Value Number Average Value
LOANS ORIGINATED 57 $56,955 15 $76,606 3 $31,860 APPLICATIONS APPROVED, NOT ACCEPTED 14 $43,254 6 $91,940 2 $35,920 APPLICATIONS DENIED 2 $67,070 2 $58,140 0 $0 APPLICATIONS WITHDRAWN 2 $12,810 0 $0 0 $0 FILES CLOSED FOR INCOMPLETENESS 0 $0 0 $0 0 $0
Aggregated Statistics For Year 2006(Based on 4 full and 2 partial tracts) A) Conventional B) Refinancings C) Non-occupant Loans on Number Average Value Number Average Value Number Average Value
LOANS ORIGINATED 63 $69,521 9 $73,754 5 $74,882 APPLICATIONS APPROVED, NOT ACCEPTED 3 $71,887 10 $66,887 2 $53,505 APPLICATIONS DENIED 4 $47,998 0 $0 2 $56,920 APPLICATIONS WITHDRAWN 2 $103,995 3 $62,297 0 $0 FILES CLOSED FOR INCOMPLETENESS 0 $0 0 $0 0 $0
Aggregated Statistics For Year 2005(Based on 4 full and 2 partial tracts) A) Conventional B) Refinancings C) Non-occupant Loans on Number Average Value Number Average Value Number Average Value
LOANS ORIGINATED 37 $70,386 6 $85,888 12 $60,605 APPLICATIONS APPROVED, NOT ACCEPTED 10 $58,219 0 $0 0 $0 APPLICATIONS DENIED 0 $0 0 $0 0 $0 APPLICATIONS WITHDRAWN 4 $44,320 0 $0 0 $0 FILES CLOSED FOR INCOMPLETENESS 0 $0 0 $0 0 $0
Aggregated Statistics For Year 2004(Based on 4 full and 4 partial tracts) A) Conventional B) Refinancings C) Non-occupant Loans on Number Average Value Number Average Value Number Average Value
LOANS ORIGINATED 43 $73,192 20 $67,142 3 $53,490 APPLICATIONS APPROVED, NOT ACCEPTED 6 $36,028 6 $67,035 4 $33,972 APPLICATIONS DENIED 2 $41,450 2 $61,915 2 $61,915 APPLICATIONS WITHDRAWN 0 $0 0 $0 0 $0 FILES CLOSED FOR INCOMPLETENESS 0 $0 0 $0 0 $0
Aggregated Statistics For Year 2002(Based on 4 full and 4 partial tracts) A) Conventional B) Refinancings C) Non-occupant Loans on Number Average Value Number Average Value Number Average Value
LOANS ORIGINATED 45 $64,218 39 $70,982 11 $44,330 APPLICATIONS APPROVED, NOT ACCEPTED 5 $27,316 17 $71,608 2 $23,830 APPLICATIONS DENIED 0 $0 3 $61,293 3 $61,293 APPLICATIONS WITHDRAWN 6 $74,858 6 $70,135 2 $52,000 FILES CLOSED FOR INCOMPLETENESS 0 $0 2 $51,245 0 $0
Aggregated Statistics For Year 2001(Based on 4 full and 4 partial tracts) A) Conventional B) Refinancings C) Non-occupant Loans on Number Average Value Number Average Value Number Average Value
LOANS ORIGINATED 42 $54,699 26 $70,157 2 $40,695 APPLICATIONS APPROVED, NOT ACCEPTED 7 $44,146 8 $70,291 2 $36,175 APPLICATIONS DENIED 7 $54,566 5 $67,630 0 $0 APPLICATIONS WITHDRAWN 2 $44,460 2 $45,750 2 $45,750 FILES CLOSED FOR INCOMPLETENESS 0 $0 0 $0 0 $0
Aggregated Statistics For Year 2000(Based on 2 full and 4 partial tracts) A) Conventional B) Refinancings Number Average Value Number Average Value
LOANS ORIGINATED 40 $46,230 12 $88,937 APPLICATIONS APPROVED, NOT ACCEPTED 3 $140,673 0 $0 APPLICATIONS DENIED 5 $35,872 0 $0 APPLICATIONS WITHDRAWN 0 $0 0 $0 FILES CLOSED FOR INCOMPLETENESS 2 $32,405 0 $0
Aggregated Statistics For Year 1999(Based on 3 partial tracts) A) Conventional B) Refinancings Number Average Value Number Average Value
LOANS ORIGINATED 19 $59,278 6 $63,907 APPLICATIONS APPROVED, NOT ACCEPTED 1 $29,640 1 $21,280 APPLICATIONS DENIED 2 $60,790 0 $0 APPLICATIONS WITHDRAWN 1 $44,830 0 $0 FILES CLOSED FOR INCOMPLETENESS 0 $0 0 $0
Detailed PMIC statistics for the following Tracts:
8009.00
,
8101.00 ,
8102.00 ,
8103.00
2003 - 2018 National Fire Incident Reporting System (NFIRS) incidents See full 2006 National Fire Incident Reporting System statistics for zip code 44405, Ohio
Most common first names in zip code 44405 among deceased individuals Name Count Lived (average)
John 296 75.1 years Mary 265 79.2 years Anna 127 80.7 years Joseph 122 73.1 years George 106 73.5 years Michael 100 73.0 years Mike 88 79.1 years Helen 72 76.2 years Steve 68 75.4 years Frank 60 72.5 years
Most common last names in zip code 44405 among deceased individuals Last name Count Lived (average)
Carano 16 78.8 years Thomas 15 71.3 years Zetts 15 78.5 years Miller 14 75.6 years Novak 13 77.8 years Pacak 13 77.1 years Kovach 12 73.4 years Kish 12 72.7 years Vansuch 12 77.4 years Vrabel 11 79.9 years
Businesses in zip code 44405

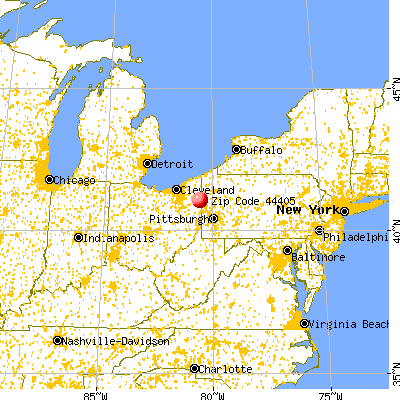


 Nearest zip codes: 44471, 44506, 44502, 44505, 44503, 44436.
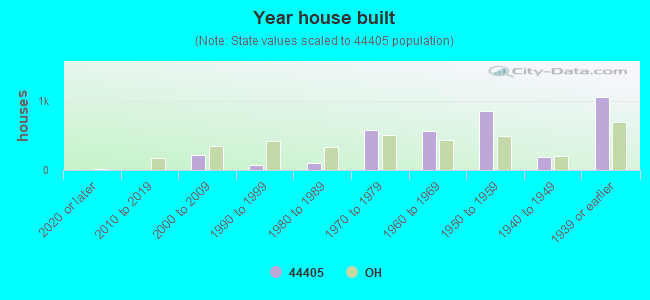


 According to the data from the years 2003 - 2018 the average number of fires per year is 92. The highest number of reported fire incidents - 159 took place in 2008, and the least - 59 in 2015. The data has a decreasing trend.
 When looking into fire subcategories, the most reports belonged to: Outside Fires (44.2%), and Structure Fires (36.4%).