Races in North Port, Florida (FL) Detailed Stats
Data:
Races - White alone (%)
Races - White alone (% change since 2000)
Races - Black alone (%)
Races - Black alone (% change since 2000)
Races - American Indian alone (%)
Races - American Indian alone (% change since 2000)
Races - Asian alone (%)
Races - Asian alone (% change since 2000)
Races - Hispanic (%)
Races - Hispanic (% change since 2000)
Races - Native Hawaiian and Other Pacific Islander alone (%)
Races - Native Hawaiian and Other Pacific Islander alone (% change since 2000)
Races - Two or more races(%)
Races - Two or more races(% change since 2000)
Races - Other race alone (%)
Races - Other race alone (% change since 2000)
Racial diversity
Place of birth - Born in state of residence (%)
Place of birth - Born in state of residence (%) - White
Place of birth - Born in state of residence (%) - Black or African American
Place of birth - Born in state of residence (%) - Asian
Place of birth - Born in state of residence (%) - Hispanic or Latino
Place of birth - Born in state of residence (%) - American Indian and Alaska Native
Place of birth - Born in state of residence (%) - Multirace
Place of birth - Born in state of residence (%) - Other Race
Place of birth - Born in other state (%)
Place of birth - Born in other state (%) - White
Place of birth - Born in other state (%) - Black or African American
Place of birth - Born in other state (%) - Asian
Place of birth - Born in other state (%) - Hispanic or Latino
Place of birth - Born in other state (%) - American Indian and Alaska Native
Place of birth - Born in other state (%) - Multirace
Place of birth - Born in other state (%) - Other Race
Place of birth - Native, outside of US (%)
Place of birth - Native, outside of US (%) - White
Place of birth - Native, outside of US (%) - Black or African American
Place of birth - Native, outside of US (%) - Asian
Place of birth - Native, outside of US (%) - Hispanic or Latino
Place of birth - Native, outside of US (%) - American Indian and Alaska Native
Place of birth - Native, outside of US (%) - Multirace
Place of birth - Native, outside of US (%) - Other Race
Place of birth - Foreign born (%)
Place of birth - Foreign born (%) - White
Place of birth - Foreign born (%) - Black or African American
Place of birth - Foreign born (%) - Asian
Place of birth - Foreign born (%) - Hispanic or Latino
Place of birth - Foreign born (%) - American Indian and Alaska Native
Place of birth - Foreign born (%) - Multirace
Place of birth - Foreign born (%) - Other Race
Residents speaking English at home (%)
Residents speaking English at home - Born in the United States (%)
Residents speaking English at home - Native, born elsewhere (%)
Residents speaking English at home - Foreign born (%)
Residents speaking Spanish at home (%)
Residents speaking Spanish at home - Born in the United States (%)
Residents speaking Spanish at home - Native, born elsewhere (%)
Residents speaking Spanish at home - Foreign born (%)
Residents speaking other language at home (%)
Residents speaking other language at home - Born in the United States (%)
Residents speaking other language at home - Native, born elsewhere (%)
Residents speaking other language at home - Foreign born (%)
Marital status - Never married (%)
Marital status - Now married (%)
Marital status - Separated (%)
Marital status - Widowed (%)
Marital status - Divorced (%)
Ancestries Reported - Arab (%)
Ancestries Reported - Czech (%)
Ancestries Reported - Danish (%)
Ancestries Reported - Dutch (%)
Ancestries Reported - English (%)
Ancestries Reported - French (%)
Ancestries Reported - French Canadian (%)
Ancestries Reported - German (%)
Ancestries Reported - Greek (%)
Ancestries Reported - Hungarian (%)
Ancestries Reported - Irish (%)
Ancestries Reported - Italian (%)
Ancestries Reported - Lithuanian (%)
Ancestries Reported - Norwegian (%)
Ancestries Reported - Polish (%)
Ancestries Reported - Portuguese (%)
Ancestries Reported - Russian (%)
Ancestries Reported - Scotch-Irish (%)
Ancestries Reported - Scottish (%)
Ancestries Reported - Slovak (%)
Ancestries Reported - Subsaharan African (%)
Ancestries Reported - Swedish (%)
Ancestries Reported - Swiss (%)
Ancestries Reported - Ukrainian (%)
Ancestries Reported - United States (%)
Ancestries Reported - Welsh (%)
Ancestries Reported - West Indian (%)
Ancestries Reported - Other (%)
Geographical mobility - Same house 1 year ago (%)
Geographical mobility - Same house 1 year ago (%) - White
Geographical mobility - Same house 1 year ago (%) - Black or African American
Geographical mobility - Same house 1 year ago (%) - Asian
Geographical mobility - Same house 1 year ago (%) - Hispanic or Latino
Geographical mobility - Same house 1 year ago (%) - American Indian and Alaska Native
Geographical mobility - Same house 1 year ago (%) - Multirace
Geographical mobility - Same house 1 year ago (%) - Other Race
Geographical mobility - Moved within same county (%)
Geographical mobility - Moved within same county (%) - White
Geographical mobility - Moved within same county (%) - Black or African American
Geographical mobility - Moved within same county (%) - Asian
Geographical mobility - Moved within same county (%) - Hispanic or Latino
Geographical mobility - Moved within same county (%) - American Indian and Alaska Native
Geographical mobility - Moved within same county (%) - Multirace
Geographical mobility - Moved within same county (%) - Other Race
Geographical mobility - Moved from different county within same state (%)
Geographical mobility - Moved from different county within same state (%) - White
Geographical mobility - Moved from different county within same state (%) - Black or African American
Geographical mobility - Moved from different county within same state (%) - Asian
Geographical mobility - Moved from different county within same state (%) - Hispanic or Latino
Geographical mobility - Moved from different county within same state (%) - American Indian and Alaska Native
Geographical mobility - Moved from different county within same state (%) - Multirace
Geographical mobility - Moved from different county within same state (%) - Other Race
Geographical mobility - Moved from different state (%)
Geographical mobility - Moved from different state (%) - White
Geographical mobility - Moved from different state (%) - Black or African American
Geographical mobility - Moved from different state (%) - Asian
Geographical mobility - Moved from different state (%) - Hispanic or Latino
Geographical mobility - Moved from different state (%) - American Indian and Alaska Native
Geographical mobility - Moved from different state (%) - Multirace
Geographical mobility - Moved from different state (%) - Other Race
Geographical mobility - Moved from abroad (%)
Geographical mobility - Moved from abroad (%) - White
Geographical mobility - Moved from abroad (%) - Black or African American
Geographical mobility - Moved from abroad (%) - Asian
Geographical mobility - Moved from abroad (%) - Hispanic or Latino
Geographical mobility - Moved from abroad (%) - American Indian and Alaska Native
Geographical mobility - Moved from abroad (%) - Multirace
Geographical mobility - Moved from abroad (%) - Other Race
Place of birth for the foreign-born population - Ireland (%)
Place of birth for the foreign-born population - Denmark (%)
Place of birth for the foreign-born population - Norway (%)
Place of birth for the foreign-born population - Sweden (%)
Place of birth for the foreign-born population - United Kingdom (%)
Place of birth for the foreign-born population - England (%)
Place of birth for the foreign-born population - Scotland (%)
Place of birth for the foreign-born population - Other Northern Europe (%)
Place of birth for the foreign-born population - Austria (%)
Place of birth for the foreign-born population - Belgium (%)
Place of birth for the foreign-born population - France (%)
Place of birth for the foreign-born population - Germany (%)
Place of birth for the foreign-born population - Netherlands (%)
Place of birth for the foreign-born population - Switzerland (%)
Place of birth for the foreign-born population - Other Western Europe (%)
Place of birth for the foreign-born population - Greece (%)
Place of birth for the foreign-born population - Italy (%)
Place of birth for the foreign-born population - Portugal (%)
Place of birth for the foreign-born population - Spain (%)
Place of birth for the foreign-born population - Other Southern Europe (%)
Place of birth for the foreign-born population - Albania (%)
Place of birth for the foreign-born population - Belarus (%)
Place of birth for the foreign-born population - Bosnia and Herzegovina (%)
Place of birth for the foreign-born population - Bulgaria (%)
Place of birth for the foreign-born population - Croatia (%)
Place of birth for the foreign-born population - Czechoslovakia (%)
Place of birth for the foreign-born population - Hungary (%)
Place of birth for the foreign-born population - Latvia (%)
Place of birth for the foreign-born population - Lithuania (%)
Place of birth for the foreign-born population - North Macedonia (Macedonia) (%)
Place of birth for the foreign-born population - Moldova (%)
Place of birth for the foreign-born population - Poland (%)
Place of birth for the foreign-born population - Romania (%)
Place of birth for the foreign-born population - Russia (%)
Place of birth for the foreign-born population - Serbia (%)
Place of birth for the foreign-born population - Ukraine (%)
Place of birth for the foreign-born population - Other Eastern Europe (%)
Place of birth for the foreign-born population - China (%)
Place of birth for the foreign-born population - Hong Kong (%)
Place of birth for the foreign-born population - Taiwan (%)
Place of birth for the foreign-born population - Japan (%)
Place of birth for the foreign-born population - Korea (%)
Place of birth for the foreign-born population - Other Eastern Asia (%)
Place of birth for the foreign-born population - Afghanistan (%)
Place of birth for the foreign-born population - Bangladesh (%)
Place of birth for the foreign-born population - India (%)
Place of birth for the foreign-born population - Iran (%)
Place of birth for the foreign-born population - Kazakhstan (%)
Place of birth for the foreign-born population - Nepal (%)
Place of birth for the foreign-born population - Pakistan (%)
Place of birth for the foreign-born population - Sri Lanka (%)
Place of birth for the foreign-born population - Uzbekistan (%)
Place of birth for the foreign-born population - Other South Central Asia (%)
Place of birth for the foreign-born population - Burma (%)
Place of birth for the foreign-born population - Cambodia (%)
Place of birth for the foreign-born population - Indonesia (%)
Place of birth for the foreign-born population - Laos (%)
Place of birth for the foreign-born population - Malaysia (%)
Place of birth for the foreign-born population - Philippines (%)
Place of birth for the foreign-born population - Singapore (%)
Place of birth for the foreign-born population - Thailand (%)
Place of birth for the foreign-born population - Vietnam (%)
Place of birth for the foreign-born population - Other South Eastern Asia (%)
Place of birth for the foreign-born population - Armenia (%)
Place of birth for the foreign-born population - Iraq (%)
Place of birth for the foreign-born population - Israel (%)
Place of birth for the foreign-born population - Jordan (%)
Place of birth for the foreign-born population - Kuwait (%)
Place of birth for the foreign-born population - Lebanon (%)
Place of birth for the foreign-born population - Saudi Arabia (%)
Place of birth for the foreign-born population - Syria (%)
Place of birth for the foreign-born population - Turkey (%)
Place of birth for the foreign-born population - Yemen (%)
Place of birth for the foreign-born population - Other Western Asia (%)
Place of birth for the foreign-born population - Eritrea (%)
Place of birth for the foreign-born population - Ethiopia (%)
Place of birth for the foreign-born population - Kenya (%)
Place of birth for the foreign-born population - Somalia (%)
Place of birth for the foreign-born population - Uganda (%)
Place of birth for the foreign-born population - Zimbabwe (%)
Place of birth for the foreign-born population - Other Eastern Africa (%)
Place of birth for the foreign-born population - Cameroon (%)
Place of birth for the foreign-born population - Congo (%)
Place of birth for the foreign-born population - Democratic Republic of Congo (Zaire) (%)
Place of birth for the foreign-born population - Other Middle Africa (%)
Place of birth for the foreign-born population - Egypt (%)
Place of birth for the foreign-born population - Morocco (%)
Place of birth for the foreign-born population - Sudan (%)
Place of birth for the foreign-born population - Other Northern Africa (%)
Place of birth for the foreign-born population - South Africa (%)
Place of birth for the foreign-born population - Other Southern Africa (%)
Place of birth for the foreign-born population - Cabo Verde (%)
Place of birth for the foreign-born population - Ghana (%)
Place of birth for the foreign-born population - Liberia (%)
Place of birth for the foreign-born population - Nigeria (%)
Place of birth for the foreign-born population - Senegal (%)
Place of birth for the foreign-born population - Sierra Leone (%)
Place of birth for the foreign-born population - Other Western Africa (%)
Place of birth for the foreign-born population - Australia (%)
Place of birth for the foreign-born population - New Zealand (%)
Place of birth for the foreign-born population - Fiji (%)
Place of birth for the foreign-born population - Micronesia (%)
Place of birth for the foreign-born population - Bahamas (%)
Place of birth for the foreign-born population - Barbados (%)
Place of birth for the foreign-born population - Cuba (%)
Place of birth for the foreign-born population - Dominica (%)
Place of birth for the foreign-born population - Dominican Republic (%)
Place of birth for the foreign-born population - Grenada (%)
Place of birth for the foreign-born population - Haiti (%)
Place of birth for the foreign-born population - Jamaica (%)
Place of birth for the foreign-born population - St. Vincent and the Grenadines (%)
Place of birth for the foreign-born population - Trinidad and Tobago (%)
Place of birth for the foreign-born population - West Indies (%)
Place of birth for the foreign-born population - Other Caribbean (%)
Place of birth for the foreign-born population - Belize (%)
Place of birth for the foreign-born population - Costa Rica (%)
Place of birth for the foreign-born population - El Salvador (%)
Place of birth for the foreign-born population - Guatemala (%)
Place of birth for the foreign-born population - Honduras (%)
Place of birth for the foreign-born population - Mexico (%)
Place of birth for the foreign-born population - Nicaragua (%)
Place of birth for the foreign-born population - Panama (%)
Place of birth for the foreign-born population - Other Central America (%)
Place of birth for the foreign-born population - Argentina (%)
Place of birth for the foreign-born population - Bolivia (%)
Place of birth for the foreign-born population - Brazil (%)
Place of birth for the foreign-born population - Chile (%)
Place of birth for the foreign-born population - Colombia (%)
Place of birth for the foreign-born population - Ecuador (%)
Place of birth for the foreign-born population - Guyana (%)
Place of birth for the foreign-born population - Peru (%)
Place of birth for the foreign-born population - Uruguay (%)
Place of birth for the foreign-born population - Venezuela (%)
Place of birth for the foreign-born population - Other South America (%)
Place of birth for the foreign-born population - Canada (%)
Place of birth for the foreign-born population - Other Northern America (%)
Place of birth for the foreign-born population - Other (%)
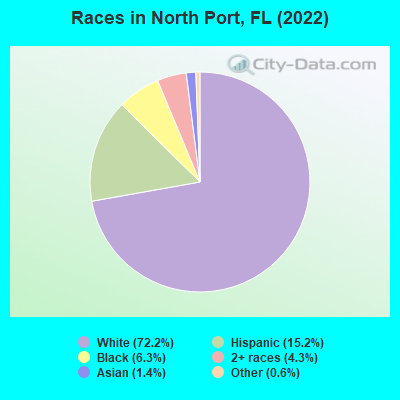
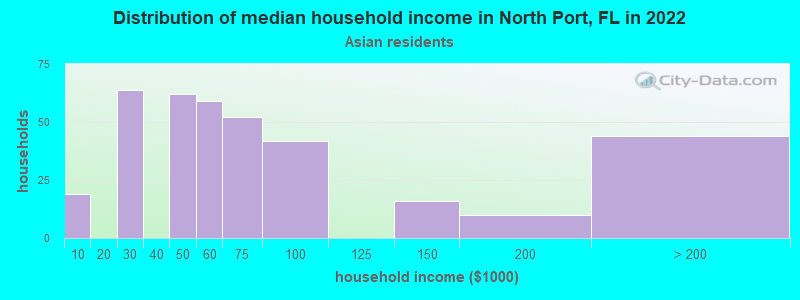
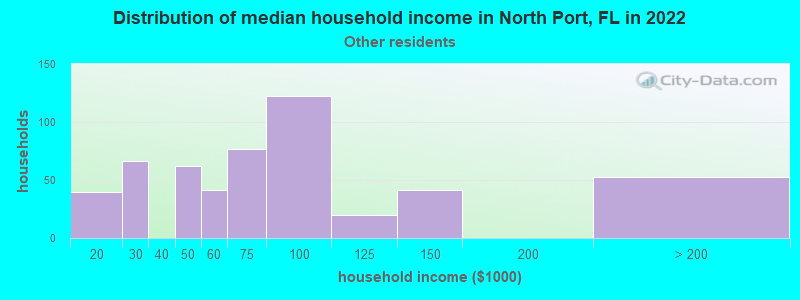
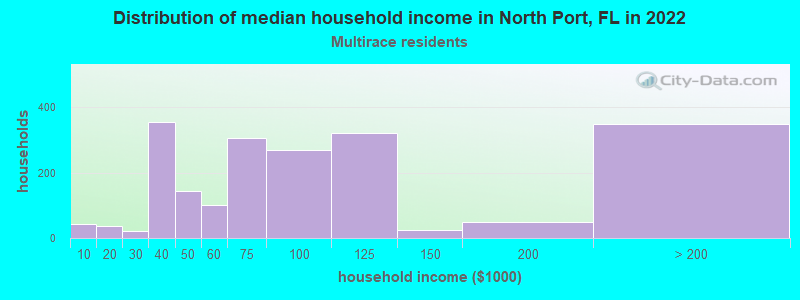
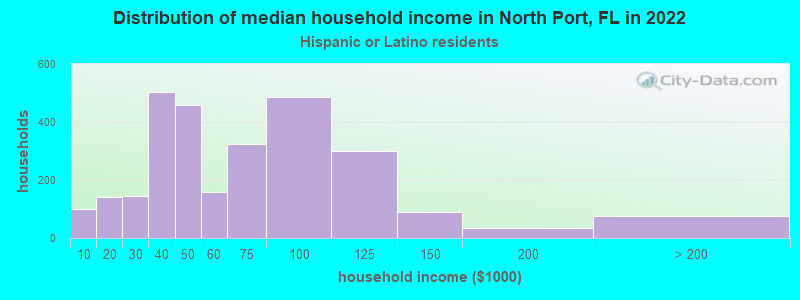
According to 2022 data, the most numerous races in North Port, FL are White alone (61,415 residents), Hispanic (12,906 residents), and Black alone (5,353 residents). 77.8% of North Port residents speak English at home. 10.3% of North Port, FL residents are foreign-born (5.3% born in Latin America, 2.8% born in Europe, 1.5% born in Asia), which is 102.9% less than the foreign-born rate of 21.0% across the entire state of Florida.
Race distribution in North Port
2000 2022
10,458,509 65.4% White alone 2,682,715 16.8% Hispanic 2,264,268 14.2% Black alone 261,693 1.6% Asian alone 236,954 1.5% Two or more races 42,358 0.3% American Indian alone 28,994 0.2% Other race alone 6,887 0.04% Native Hawaiian and Other
11,309,403 50.8% White alone 6,025,039 27.1% Hispanic 3,241,015 14.6% Black alone 861,630 3.9% Two or more races 623,692 2.8% Asian alone 152,054 0.7% Other race alone 22,504 0.1% American Indian alone 9,486 0.04% Native Hawaiian and Other
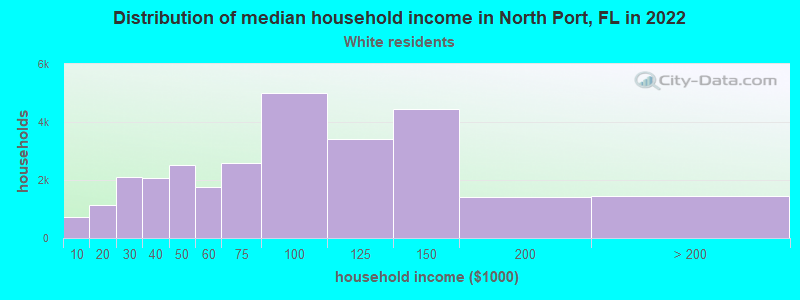
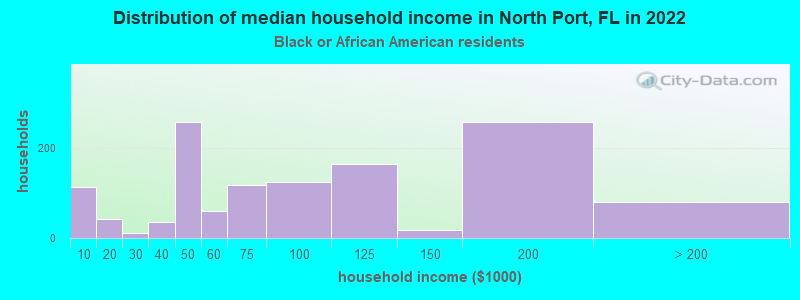
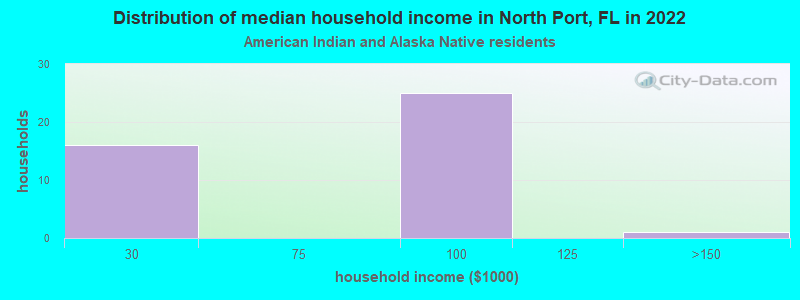
Income and house value in North Port Median household income in 2022 $81,757 White non-Hispanic householders$75,857 Black householders$68,794 Asian householders$61,786 Some other race householders$66,423 Two or more races householders$66,434 Hispanic or Latino race householdersMedian 2022 house value $377,334 White Non-Hispanic householders$309,985 Black or African American householders$379,118 American Indian or Alaska Native householders $501,774 Asian householders$446,022 Some other race householders$347,897 Two or more races householders$417,030 Hispanic or Latino householders
Median age by race in North Port
49.8 Median age for White residents49.1 50.4 25.0 Median age for Black or African American residents25.6 24.3 -666,666,666.0 Median age for American Indian / Alaska Native residents-666,666,666.0 -666,666,666.0 39.7 Median age for Asian residents-666,666,666.0 39.8 -666,666,666.0 Median age for Native Hawaiian / Pacific Islander residents-666,666,666.0 -666,666,666.0 54.8 Median age for Other race residents54.1 57.8 32.4 Median age for Two or more races residents24.7 33.7 50.2 Median age for White alone residents49.5 50.7 34.4 Median age for Hispanic or Latino residents32.6 35.0
Owner/renter occupied households by race in North Port
House owners and renters - White residents 23,699 82.8% Owner occupied4,916 17.2% Renter occupiedHouse owners and renters - Black or African American residents 740 76.3% Owner occupied230 23.7% Renter occupiedHouse owners and renters - American Indian / Alaska Native residents 30 100.0% Owner occupiedHouse owners and renters - Asian residents 468 98.6% Owner occupied7 1.4% Renter occupiedHouse owners and renters - Other race residents 496 77.5% Owner occupied144 22.5% Renter occupiedHouse owners and renters - Two or more races residents 1,897 55.0% Owner occupied1,551 45.0% Renter occupiedHouse owners and renters - White alone residents 23,024 82.8% Owner occupied4,776 17.2% Renter occupiedHouse owners and renters - Hispanic or Latino residents 2,502 62.4% Owner occupied1,507 37.6% Renter occupied
Language usage in North Port
English speakers - Total 77.8% of residents of North Port speak English at home.
11.2% of residents speak Spanish at home 4,433 49.5% Speak English very well4,517 50.5% Speak English less than very well11.0% of residents speak other language at home 6,276 71.1% Speak English very well2,549 28.9% Speak English less than very well
English speakers - Born in the United States 95.3% of residents of North Port speak English at home.
1.5% of residents speak Spanish at home 669 100.0% Speak English very well3.2% of residents speak other language at home 1,040 75.2% Speak English very well343 24.8% Speak English less than very well
English speakers - Native, born elsewhere 50.3% of residents of North Port speak English at home.
49.7% of residents speak Spanish at home 620 90.6% Speak English very well64 9.4% Speak English less than very well
English speakers - Foreign-born 21.4% of residents of North Port speak English at home.
43.8% of residents speak Spanish at home 2,477 35.7% Speak English very well4,453 64.3% Speak English less than very well34.8% of residents speak other language at home 3,303 60.0% Speak English very well2,206 40.0% Speak English less than very well
White (Caucasian) - Speak only English Native:
95.9% (51,018)Foreign-born:
28.0% (2,005)
White (Caucasian) - Speak another language Native:
4.1% (2,182)Foreign-born:
72.0% (5,151)
Black or African American - Speak only English Native:
67.7% (1,798)Foreign-born:
66.7% (1,021)
Black or African American - Speak another language Native:
51.2% (1,361)Foreign-born:
34.1% (522)
Asian - Speak only English Native:
62.7% (218)Foreign-born:
14.2% (129)
Asian - Speak another language Native:
39.0% (135)Foreign-born:
87.9% (799)
Other race - Speak only English Native:
51.6% (762)Foreign-born:
24.1% (92)
Other race - Speak another language Native:
47.6% (702)Foreign-born:
76.3% (291)
Two or more races - Speak only English Native:
86.3% (5,233)Foreign-born:
5.8% (339)
Two or more races - Speak another language Native:
13.7% (834)Foreign-born:
94.2% (5,470)
White alone - Speak only English Native:
96.7% (50,394)Foreign-born:
35.5% (2,005)
White alone - Speak another language Native:
3.3% (1,742)Foreign-born:
64.5% (3,645)
Hispanic or Latino - Speak only English Native:
66.0% (3,368)Foreign-born:
0.4% (25)
Hispanic or Latino - Speak another language Native:
34.0% (1,735)Foreign-born:
99.6% (6,930)
Foreign-born residents in North Port 8,382 residents are foreign born (5.3% Latin America , 2.8% Europe , 1.5% Asia ).
This city:
10.3%Florida:
21.1%
Marital status for residents in North Port Marital status - White (Caucasian) population 15 years and over
Males 26.4% Never married57.3% Now married2.2% Separated3.6% Widowed10.5% DivorcedFemales 15.0% Never married56.7% Now married3.1% Separated9.1% Widowed16.1% DivorcedWomen who gave birth in the past 12 months Now married:
94.2% (720)Unmarried:
5.8% (44)
Women who did not give birth in the past 12 months Now married:
51.5% (5,916)Unmarried:
48.5% (5,567)
Marital status - Black or African American population 15 years and over
Males 46.8% Never married44.8% Now married0.0% Separated1.9% Widowed6.5% DivorcedFemales 45.8% Never married28.5% Now married0.0% Separated4.1% Widowed21.6% DivorcedWomen who gave birth in the past 12 months Now married:
76.7% (33)Unmarried:
23.3% (10)
Women who did not give birth in the past 12 months Now married:
4.6% (53)Unmarried:
95.4% (1,106)
Marital status - American Indian / Alaska Native population 15 years and over
Males 0.0% Never married70.0% Now married0.0% Separated0.0% Widowed30.0% DivorcedFemales 0.0% Never married100.0% Now married0.0% Separated0.0% Widowed0.0% DivorcedMarital status - Asian population 15 years and over
Males 12.8% Never married87.2% Now married0.0% Separated0.0% Widowed0.0% DivorcedFemales 24.2% Never married69.6% Now married0.0% Separated1.5% Widowed4.7% DivorcedWomen who did not give birth in the past 12 months Now married:
54.4% (178)Unmarried:
45.6% (149)
Marital status - Other race population 15 years and over
Males 35.7% Never married56.7% Now married0.0% Separated0.0% Widowed7.6% DivorcedFemales 22.1% Never married33.4% Now married0.0% Separated6.7% Widowed37.8% DivorcedWomen who did not give birth in the past 12 months Now married:
39.9% (155)Unmarried:
60.1% (234)
Marital status - Two or more races population 15 years and over
Males 27.5% Never married59.6% Now married0.0% Separated3.0% Widowed10.0% DivorcedFemales 35.4% Never married51.6% Now married1.2% Separated5.6% Widowed6.2% DivorcedWomen who gave birth in the past 12 months Now married:
0.0% (0)Unmarried:
100.0% (170)
Women who did not give birth in the past 12 months Now married:
26.4% (445)Unmarried:
73.6% (1,243)
Marital status - White alone, not Hispanic / Latino population 15 years and over
Males 25.8% Never married58.0% Now married1.3% Separated3.8% Widowed11.0% DivorcedFemales 14.6% Never married56.9% Now married3.2% Separated8.6% Widowed16.7% DivorcedWomen who gave birth in the past 12 months Now married:
94.2% (720)Unmarried:
5.8% (44)
Women who did not give birth in the past 12 months Now married:
50.7% (5,591)Unmarried:
49.3% (5,426)
Marital status - Hispanic or Latino population 15 years and over
Males 24.0% Never married56.8% Now married5.3% Separated2.7% Widowed11.3% DivorcedFemales 31.1% Never married45.9% Now married1.1% Separated8.5% Widowed13.4% DivorcedWomen who did not give birth in the past 12 months Now married:
46.3% (914)Unmarried:
53.7% (1,059)
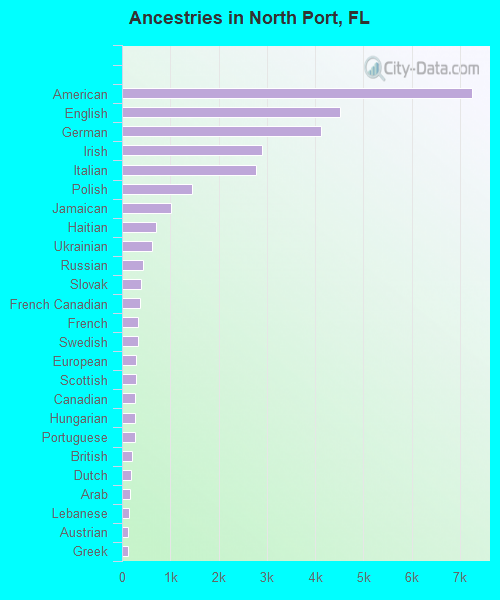
Ancestries in North Port
7,242 18.6% American4,516 11.6% English4,115 10.6% German2,903 7.5% Irish2,776 7.1% Italian1,441 3.7% Polish1,023 2.6% Jamaican695 1.8% Haitian615 1.6% Ukrainian436 1.1% Russian397 1.0% Slovak364 0.9% French Canadian340 0.9% French336 0.9% Swedish286 0.7% European284 0.7% Scottish273 0.7% Canadian262 0.7% Hungarian259 0.7% Portuguese197 0.5% British183 0.5% Dutch157 0.4% Arab151 0.4% Lebanese130 0.3% Austrian129 0.3% Greek126 0.3% Danish106 0.3% African100 0.3% Slavic96 0.2% Bahamian95 0.2% Guyanese75 0.2% Armenian73 0.2% Scotch-Irish73 0.2% Scandinavian71 0.2% Romanian70 0.2% Norwegian68 0.2% Czech67 0.2% Welsh62 0.2% Syrian58 0.1% Finnish57 0.1% Lithuanian45 0.1% Pennsylvania German44 0.1% Bulgarian44 0.1% Serbian36 0.09% Trinidadian and Tobagonian20 0.05% Northern European12 0.03% Czechoslovakian11 0.03% Swiss10 0.03% Brazilian10 0.03% Belgian7 0.02% Maltese7 0.02% Eastern European5 0.01% Croatian
Geographical mobility in North Port Same house 1 year ago 53,845 84.7% White (Caucasian)3,290 82.8% Black or African American108 81.7% American Indian / Alaska Native1,304 99.9% Asian10 100.0% Native Hawaiian / Pacific Islander1,928 97.0% Other race7,236 93.5% Two or more races51,395 84.4% White alone, not Hispanic / Latino8,167 95.4% Hispanic or LatinoMoved within same county 1,963 3.1% White / Caucasian275 6.9% Black or African American21 16.2% American Indian / Alaska Native65 3.3% Other race194 2.5% Two or more races1,963 3.2% White alone, not Hispanic / Latino254 3.0% Hispanic or LatinoMoved within same state 3,313 5.2% White / Caucasian168 4.2% Black or African American6 0.3% Other race202 2.6% Two or more races3,086 5.1% White alone, not Hispanic / Latino132 1.5% Hispanic or LatinoMoved from different state 4,209 6.6% White / Caucasian162 4.1% Black or African American17 1.3% Asian216 2.8% Two or more races4,209 6.9% White alone, not Hispanic / Latino178 2.1% Hispanic or LatinoMoved from abroad 248 0.4% White248 0.4% White alone, not Hispanic / Latino
Children Nativity (place of birth) in North Port
Children under 6 years - Living with two parents Both parents native 1,968 100.0% NativeBoth parents foreign-born 973 100.0% NativeOne native, one foreign-born parent 234 100.0% NativeChildren under 6 years - Living with one parent Native parent 1,733 100.0% NativeForeign-born parent 240 100.0% NativeChildren 6 to 17 years - Living with two parents Both parents native 4,069 100.0% NativeBoth parents foreign-born 1,182 77.3% Native348 22.7% Foreign-bornOne native, one foreign-born parent 866 100.0% NativeChildren 6 to 17 years - Living with one parent Native parent 1,691 83.5% Native334 16.5% Foreign-bornForeign-born parent 990 75.1% Native328 24.9% Foreign-born
Grandparents responsible for own grandchildren in North Port
Grandparents (30 to 59 years) White / Caucasian 84 9.9% Responsible for grandchildren766 90.1% Not responsible for grandchildrenOther race 8 100.0% Responsible for grandchildrenWhite alone, not Hispanic / Latino 88 8.9% Responsible for grandchildren901 91.1% Not responsible for grandchildrenGrandparents (60 years and over) White / Caucasian 135 34.8% Responsible for grandchildren253 65.2% Not responsible for grandchildrenWhite alone, not Hispanic / Latino 138 34.2% Responsible for grandchildren267 65.8% Not responsible for grandchildren