Estimated zip code population in 2022: 21,151
Zip code population in 2010: 17,970
Zip code population in 2000: 8,610
Houses and condos: 8,737
Renter-occupied apartments: 1,619
% of renters here:
20%State:
33%
March 2022 cost of living index in zip code 34286: 95.4
(near average, U.S. average is 100)
Land area: 15.0
sq. mi.
Water area: 0.4
sq. mi.
Population density: 1,414 people per square mile (low).
OSM Map
General Map
Google Map
MSN Map
OSM Map
General Map
Google Map
MSN Map
OSM Map
General Map
Google Map
MSN Map
OSM Map
General Map
Google Map
MSN Map
Please wait while loading the map...
Real estate property taxes paid for housing units in 2022:
This zip code:
0.7% ($2,250)Florida:
0.7% ($2,529)
Median real estate property taxes paid for housing units with mortgages in 2022: $2,210 (0.7%)
Median real estate property taxes paid for housing units with no mortgage in 2022: $2,311 (0.7%)
Profiles of local businesses
Business Search - 14 Million verified businesses
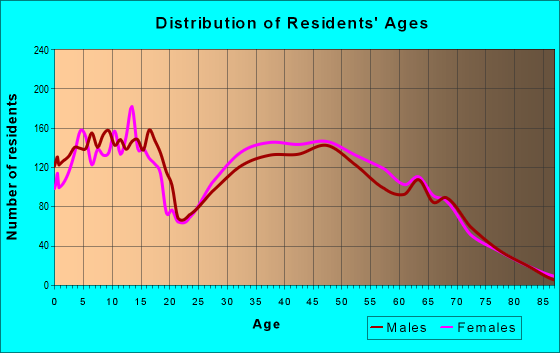
Males: 11,234 Females: 9,917
For population 25 years and over in 34286:
High school or higher: 90.6%Bachelor's degree or higher: 26.8%Graduate or professional degree: 10.7%Unemployed: 3.1%Mean travel time to work (commute): 25.4 minutes
For population 15 years and over in 34286:
Never married: 23.0%Now married: 58.6%Separated: 1.2%Widowed: 4.2%Divorced: 12.9%
Zip code 34286 compared to state average:
Black race population percentage significantly below state average. Hispanic race population percentage below state average. Median age above state average. Foreign-born population percentage significantly below state average. Renting percentage below state average. Length of stay since moving in significantly above state average. House age significantly below state average. Number of college students below state average. 16,485 78.0% White 2,247 10.6% Hispanic or Latino 1,393 6.6% Two or more races 830 3.9% Black 168 0.8% Asian 15 0.07% American Indian 10 0.05% Native Hawaiian and Other
Data:
Median household income ($)
Median household income (% change since 2000)
Household income diversity
Ratio of average income to average house value (%)
Ratio of average income to average rent
Median household income ($) - White
Median household income ($) - Black or African American
Median household income ($) - Asian
Median household income ($) - Hispanic or Latino
Median household income ($) - American Indian and Alaska Native
Median household income ($) - Multirace
Median household income ($) - Other Race
Median household income for houses/condos with a mortgage ($)
Median household income for apartments without a mortgage ($)
Races - White alone (%)
Races - White alone (% change since 2000)
Races - Black alone (%)
Races - Black alone (% change since 2000)
Races - American Indian alone (%)
Races - American Indian alone (% change since 2000)
Races - Asian alone (%)
Races - Asian alone (% change since 2000)
Races - Hispanic (%)
Races - Hispanic (% change since 2000)
Races - Native Hawaiian and Other Pacific Islander alone (%)
Races - Native Hawaiian and Other Pacific Islander alone (% change since 2000)
Races - Two or more races (%)
Races - Two or more races (% change since 2000)
Races - Other race alone (%)
Races - Other race alone (% change since 2000)
Racial diversity
Unemployment (%)
Unemployment (% change since 2000)
Unemployment (%) - White
Unemployment (%) - Black or African American
Unemployment (%) - Asian
Unemployment (%) - Hispanic or Latino
Unemployment (%) - American Indian and Alaska Native
Unemployment (%) - Multirace
Unemployment (%) - Other Race
Population density (people per square mile)
Population - Males (%)
Population - Females (%)
Population - Males (%) - White
Population - Males (%) - Black or African American
Population - Males (%) - Asian
Population - Males (%) - Hispanic or Latino
Population - Males (%) - American Indian and Alaska Native
Population - Males (%) - Multirace
Population - Males (%) - Other Race
Population - Females (%) - White
Population - Females (%) - Black or African American
Population - Females (%) - Asian
Population - Females (%) - Hispanic or Latino
Population - Females (%) - American Indian and Alaska Native
Population - Females (%) - Multirace
Population - Females (%) - Other Race
Coronavirus confirmed cases (Jun 05, 2024)
Deaths caused by coronavirus (Jun 05, 2024)
Coronavirus confirmed cases (per 100k population) (Jun 05, 2024)
Deaths caused by coronavirus (per 100k population) (Jun 05, 2024)
Daily increase in number of cases (Jun 05, 2024)
Weekly increase in number of cases (Jun 05, 2024)
Cases doubled (in days) (Jun 05, 2024)
Hospitalized patients (Apr 18, 2022)
Negative test results (Apr 18, 2022)
Total test results (Apr 18, 2022)
COVID Vaccine doses distributed (per 100k population) (Sep 19, 2023)
COVID Vaccine doses administered (per 100k population) (Sep 19, 2023)
COVID Vaccine doses distributed (Sep 19, 2023)
COVID Vaccine doses administered (Sep 19, 2023)
Likely homosexual households (%)
Likely homosexual households (% change since 2000)
Likely homosexual households - Lesbian couples (%)
Likely homosexual households - Lesbian couples (% change since 2000)
Likely homosexual households - Gay men (%)
Likely homosexual households - Gay men (% change since 2000)
Cost of living index
Median gross rent ($)
Median contract rent ($)
Median monthly housing costs ($)
Median house or condo value ($)
Median house or condo value ($ change since 2000)
Mean house or condo value by units in structure - 1, detached ($)
Mean house or condo value by units in structure - 1, attached ($)
Mean house or condo value by units in structure - 2 ($)
Mean house or condo value by units in structure by units in structure - 3 or 4 ($)
Mean house or condo value by units in structure - 5 or more ($)
Mean house or condo value by units in structure - Boat, RV, van, etc. ($)
Mean house or condo value by units in structure - Mobile home ($)
Median house or condo value ($) - White
Median house or condo value ($) - Black or African American
Median house or condo value ($) - Asian
Median house or condo value ($) - Hispanic or Latino
Median house or condo value ($) - American Indian and Alaska Native
Median house or condo value ($) - Multirace
Median house or condo value ($) - Other Race
Median resident age
Resident age diversity
Median resident age - Males
Median resident age - Females
Median resident age - White
Median resident age - Black or African American
Median resident age - Asian
Median resident age - Hispanic or Latino
Median resident age - American Indian and Alaska Native
Median resident age - Multirace
Median resident age - Other Race
Median resident age - Males - White
Median resident age - Males - Black or African American
Median resident age - Males - Asian
Median resident age - Males - Hispanic or Latino
Median resident age - Males - American Indian and Alaska Native
Median resident age - Males - Multirace
Median resident age - Males - Other Race
Median resident age - Females - White
Median resident age - Females - Black or African American
Median resident age - Females - Asian
Median resident age - Females - Hispanic or Latino
Median resident age - Females - American Indian and Alaska Native
Median resident age - Females - Multirace
Median resident age - Females - Other Race
Commute - mean travel time to work (minutes)
Travel time to work - Less than 5 minutes (%)
Travel time to work - Less than 5 minutes (% change since 2000)
Travel time to work - 5 to 9 minutes (%)
Travel time to work - 5 to 9 minutes (% change since 2000)
Travel time to work - 10 to 19 minutes (%)
Travel time to work - 10 to 19 minutes (% change since 2000)
Travel time to work - 20 to 29 minutes (%)
Travel time to work - 20 to 29 minutes (% change since 2000)
Travel time to work - 30 to 39 minutes (%)
Travel time to work - 30 to 39 minutes (% change since 2000)
Travel time to work - 40 to 59 minutes (%)
Travel time to work - 40 to 59 minutes (% change since 2000)
Travel time to work - 60 to 89 minutes (%)
Travel time to work - 60 to 89 minutes (% change since 2000)
Travel time to work - 90 or more minutes (%)
Travel time to work - 90 or more minutes (% change since 2000)
Marital status - Never married (%)
Marital status - Now married (%)
Marital status - Separated (%)
Marital status - Widowed (%)
Marital status - Divorced (%)
Median family income ($)
Median family income (% change since 2000)
Median non-family income ($)
Median non-family income (% change since 2000)
Median per capita income ($)
Median per capita income (% change since 2000)
Median family income ($) - White
Median family income ($) - Black or African American
Median family income ($) - Asian
Median family income ($) - Hispanic or Latino
Median family income ($) - American Indian and Alaska Native
Median family income ($) - Multirace
Median family income ($) - Other Race
Median year house/condo built
Median year apartment built
Year house built - Built 2005 or later (%)
Year house built - Built 2000 to 2004 (%)
Year house built - Built 1990 to 1999 (%)
Year house built - Built 1980 to 1989 (%)
Year house built - Built 1970 to 1979 (%)
Year house built - Built 1960 to 1969 (%)
Year house built - Built 1950 to 1959 (%)
Year house built - Built 1940 to 1949 (%)
Year house built - Built 1939 or earlier (%)
Average household size
Household density (households per square mile)
Average household size - White
Average household size - Black or African American
Average household size - Asian
Average household size - Hispanic or Latino
Average household size - American Indian and Alaska Native
Average household size - Multirace
Average household size - Other Race
Occupied housing units (%)
Vacant housing units (%)
Owner occupied housing units (%)
Renter occupied housing units (%)
Vacancy status - For rent (%)
Vacancy status - For sale only (%)
Vacancy status - Rented or sold, not occupied (%)
Vacancy status - For seasonal, recreational, or occasional use (%)
Vacancy status - For migrant workers (%)
Vacancy status - Other vacant (%)
Residents with income below the poverty level (%)
Residents with income below 50% of the poverty level (%)
Children below poverty level (%)
Poor families by family type - Married-couple family (%)
Poor families by family type - Male, no wife present (%)
Poor families by family type - Female, no husband present (%)
Poverty status for native-born residents (%)
Poverty status for foreign-born residents (%)
Poverty among high school graduates not in families (%)
Poverty among people who did not graduate high school not in families (%)
Residents with income below the poverty level (%) - White
Residents with income below the poverty level (%) - Black or African American
Residents with income below the poverty level (%) - Asian
Residents with income below the poverty level (%) - Hispanic or Latino
Residents with income below the poverty level (%) - American Indian and Alaska Native
Residents with income below the poverty level (%) - Multirace
Residents with income below the poverty level (%) - Other Race
Air pollution - Air Quality Index (AQI)
Air pollution - CO
Air pollution - NO2
Air pollution - SO2
Air pollution - Ozone
Air pollution - PM10
Air pollution - PM25
Air pollution - Pb
Crime - Murders per 100,000 population
Crime - Rapes per 100,000 population
Crime - Robberies per 100,000 population
Crime - Assaults per 100,000 population
Crime - Burglaries per 100,000 population
Crime - Thefts per 100,000 population
Crime - Auto thefts per 100,000 population
Crime - Arson per 100,000 population
Crime - City-data.com crime index
Crime - Violent crime index
Crime - Property crime index
Crime - Murders per 100,000 population (5 year average)
Crime - Rapes per 100,000 population (5 year average)
Crime - Robberies per 100,000 population (5 year average)
Crime - Assaults per 100,000 population (5 year average)
Crime - Burglaries per 100,000 population (5 year average)
Crime - Thefts per 100,000 population (5 year average)
Crime - Auto thefts per 100,000 population (5 year average)
Crime - Arson per 100,000 population (5 year average)
Crime - City-data.com crime index (5 year average)
Crime - Violent crime index (5 year average)
Crime - Property crime index (5 year average)
1996 Presidential Elections Results (%) - Democratic Party (Clinton)
1996 Presidential Elections Results (%) - Republican Party (Dole)
1996 Presidential Elections Results (%) - Other
2000 Presidential Elections Results (%) - Democratic Party (Gore)
2000 Presidential Elections Results (%) - Republican Party (Bush)
2000 Presidential Elections Results (%) - Other
2004 Presidential Elections Results (%) - Democratic Party (Kerry)
2004 Presidential Elections Results (%) - Republican Party (Bush)
2004 Presidential Elections Results (%) - Other
2008 Presidential Elections Results (%) - Democratic Party (Obama)
2008 Presidential Elections Results (%) - Republican Party (McCain)
2008 Presidential Elections Results (%) - Other
2012 Presidential Elections Results (%) - Democratic Party (Obama)
2012 Presidential Elections Results (%) - Republican Party (Romney)
2012 Presidential Elections Results (%) - Other
2016 Presidential Elections Results (%) - Democratic Party (Clinton)
2016 Presidential Elections Results (%) - Republican Party (Trump)
2016 Presidential Elections Results (%) - Other
2020 Presidential Elections Results (%) - Democratic Party (Biden)
2020 Presidential Elections Results (%) - Republican Party (Trump)
2020 Presidential Elections Results (%) - Other
Ancestries Reported - Arab (%)
Ancestries Reported - Czech (%)
Ancestries Reported - Danish (%)
Ancestries Reported - Dutch (%)
Ancestries Reported - English (%)
Ancestries Reported - French (%)
Ancestries Reported - French Canadian (%)
Ancestries Reported - German (%)
Ancestries Reported - Greek (%)
Ancestries Reported - Hungarian (%)
Ancestries Reported - Irish (%)
Ancestries Reported - Italian (%)
Ancestries Reported - Lithuanian (%)
Ancestries Reported - Norwegian (%)
Ancestries Reported - Polish (%)
Ancestries Reported - Portuguese (%)
Ancestries Reported - Russian (%)
Ancestries Reported - Scotch-Irish (%)
Ancestries Reported - Scottish (%)
Ancestries Reported - Slovak (%)
Ancestries Reported - Subsaharan African (%)
Ancestries Reported - Swedish (%)
Ancestries Reported - Swiss (%)
Ancestries Reported - Ukrainian (%)
Ancestries Reported - United States (%)
Ancestries Reported - Welsh (%)
Ancestries Reported - West Indian (%)
Ancestries Reported - Other (%)
Educational Attainment - No schooling completed (%)
Educational Attainment - Less than high school (%)
Educational Attainment - High school or equivalent (%)
Educational Attainment - Less than 1 year of college (%)
Educational Attainment - 1 or more years of college (%)
Educational Attainment - Associate degree (%)
Educational Attainment - Bachelor's degree (%)
Educational Attainment - Master's degree (%)
Educational Attainment - Professional school degree (%)
Educational Attainment - Doctorate degree (%)
School Enrollment - Nursery, preschool (%)
School Enrollment - Kindergarten (%)
School Enrollment - Grade 1 to 4 (%)
School Enrollment - Grade 5 to 8 (%)
School Enrollment - Grade 9 to 12 (%)
School Enrollment - College undergrad (%)
School Enrollment - Graduate or professional (%)
School Enrollment - Not enrolled in school (%)
School enrollment - Public schools (%)
School enrollment - Private schools (%)
School enrollment - Not enrolled (%)
Median number of rooms in houses and condos
Median number of rooms in apartments
Housing units lacking complete plumbing facilities (%)
Housing units lacking complete kitchen facilities (%)
Density of houses
Urban houses (%)
Rural houses (%)
Households with people 60 years and over (%)
Households with people 65 years and over (%)
Households with people 75 years and over (%)
Households with one or more nonrelatives (%)
Households with no nonrelatives (%)
Population in households (%)
Family households (%)
Nonfamily households (%)
Population in families (%)
Family households with own children (%)
Median number of bedrooms in owner occupied houses
Mean number of bedrooms in owner occupied houses
Median number of bedrooms in renter occupied houses
Mean number of bedrooms in renter occupied houses
Median number of vehichles in owner occupied houses
Mean number of vehichles in owner occupied houses
Median number of vehichles in renter occupied houses
Mean number of vehichles in renter occupied houses
Mortgage status - with mortgage (%)
Mortgage status - with second mortgage (%)
Mortgage status - with home equity loan (%)
Mortgage status - with both second mortgage and home equity loan (%)
Mortgage status - without a mortgage (%)
Average family size
Average family size - White
Average family size - Black or African American
Average family size - Asian
Average family size - Hispanic or Latino
Average family size - American Indian and Alaska Native
Average family size - Multirace
Average family size - Other Race
Geographical mobility - Same house 1 year ago (%)
Geographical mobility - Moved within same county (%)
Geographical mobility - Moved from different county within same state (%)
Geographical mobility - Moved from different state (%)
Geographical mobility - Moved from abroad (%)
Place of birth - Born in state of residence (%)
Place of birth - Born in other state (%)
Place of birth - Native, outside of US (%)
Place of birth - Foreign born (%)
Housing units in structures - 1, detached (%)
Housing units in structures - 1, attached (%)
Housing units in structures - 2 (%)
Housing units in structures - 3 or 4 (%)
Housing units in structures - 5 to 9 (%)
Housing units in structures - 10 to 19 (%)
Housing units in structures - 20 to 49 (%)
Housing units in structures - 50 or more (%)
Housing units in structures - Mobile home (%)
Housing units in structures - Boat, RV, van, etc. (%)
House/condo owner moved in on average (years ago)
Renter moved in on average (years ago)
Year householder moved into unit - Moved in 1999 to March 2000 (%)
Year householder moved into unit - Moved in 1995 to 1998 (%)
Year householder moved into unit - Moved in 1990 to 1994 (%)
Year householder moved into unit - Moved in 1980 to 1989 (%)
Year householder moved into unit - Moved in 1970 to 1979 (%)
Year householder moved into unit - Moved in 1969 or earlier (%)
Means of transportation to work - Drove car alone (%)
Means of transportation to work - Carpooled (%)
Means of transportation to work - Public transportation (%)
Means of transportation to work - Bus or trolley bus (%)
Means of transportation to work - Streetcar or trolley car (%)
Means of transportation to work - Subway or elevated (%)
Means of transportation to work - Railroad (%)
Means of transportation to work - Ferryboat (%)
Means of transportation to work - Taxicab (%)
Means of transportation to work - Motorcycle (%)
Means of transportation to work - Bicycle (%)
Means of transportation to work - Walked (%)
Means of transportation to work - Other means (%)
Working at home (%)
Industry diversity
Most Common Industries - Agriculture, forestry, fishing and hunting, and mining (%)
Most Common Industries - Agriculture, forestry, fishing and hunting (%)
Most Common Industries - Mining, quarrying, and oil and gas extraction (%)
Most Common Industries - Construction (%)
Most Common Industries - Manufacturing (%)
Most Common Industries - Wholesale trade (%)
Most Common Industries - Retail trade (%)
Most Common Industries - Transportation and warehousing, and utilities (%)
Most Common Industries - Transportation and warehousing (%)
Most Common Industries - Utilities (%)
Most Common Industries - Information (%)
Most Common Industries - Finance and insurance, and real estate and rental and leasing (%)
Most Common Industries - Finance and insurance (%)
Most Common Industries - Real estate and rental and leasing (%)
Most Common Industries - Professional, scientific, and management, and administrative and waste management services (%)
Most Common Industries - Professional, scientific, and technical services (%)
Most Common Industries - Management of companies and enterprises (%)
Most Common Industries - Administrative and support and waste management services (%)
Most Common Industries - Educational services, and health care and social assistance (%)
Most Common Industries - Educational services (%)
Most Common Industries - Health care and social assistance (%)
Most Common Industries - Arts, entertainment, and recreation, and accommodation and food services (%)
Most Common Industries - Arts, entertainment, and recreation (%)
Most Common Industries - Accommodation and food services (%)
Most Common Industries - Other services, except public administration (%)
Most Common Industries - Public administration (%)
Occupation diversity
Most Common Occupations - Management, business, science, and arts occupations (%)
Most Common Occupations - Management, business, and financial occupations (%)
Most Common Occupations - Management occupations (%)
Most Common Occupations - Business and financial operations occupations (%)
Most Common Occupations - Computer, engineering, and science occupations (%)
Most Common Occupations - Computer and mathematical occupations (%)
Most Common Occupations - Architecture and engineering occupations (%)
Most Common Occupations - Life, physical, and social science occupations (%)
Most Common Occupations - Education, legal, community service, arts, and media occupations (%)
Most Common Occupations - Community and social service occupations (%)
Most Common Occupations - Legal occupations (%)
Most Common Occupations - Education, training, and library occupations (%)
Most Common Occupations - Arts, design, entertainment, sports, and media occupations (%)
Most Common Occupations - Healthcare practitioners and technical occupations (%)
Most Common Occupations - Health diagnosing and treating practitioners and other technical occupations (%)
Most Common Occupations - Health technologists and technicians (%)
Most Common Occupations - Service occupations (%)
Most Common Occupations - Healthcare support occupations (%)
Most Common Occupations - Protective service occupations (%)
Most Common Occupations - Fire fighting and prevention, and other protective service workers including supervisors (%)
Most Common Occupations - Law enforcement workers including supervisors (%)
Most Common Occupations - Food preparation and serving related occupations (%)
Most Common Occupations - Building and grounds cleaning and maintenance occupations (%)
Most Common Occupations - Personal care and service occupations (%)
Most Common Occupations - Sales and office occupations (%)
Most Common Occupations - Sales and related occupations (%)
Most Common Occupations - Office and administrative support occupations (%)
Most Common Occupations - Natural resources, construction, and maintenance occupations (%)
Most Common Occupations - Farming, fishing, and forestry occupations (%)
Most Common Occupations - Construction and extraction occupations (%)
Most Common Occupations - Installation, maintenance, and repair occupations (%)
Most Common Occupations - Production, transportation, and material moving occupations (%)
Most Common Occupations - Production occupations (%)
Most Common Occupations - Transportation occupations (%)
Most Common Occupations - Material moving occupations (%)
People in Group quarters - Institutionalized population (%)
People in Group quarters - Correctional institutions (%)
People in Group quarters - Federal prisons and detention centers (%)
People in Group quarters - Halfway houses (%)
People in Group quarters - Local jails and other confinement facilities (including police lockups) (%)
People in Group quarters - Military disciplinary barracks (%)
People in Group quarters - State prisons (%)
People in Group quarters - Other types of correctional institutions (%)
People in Group quarters - Nursing homes (%)
People in Group quarters - Hospitals/wards, hospices, and schools for the handicapped (%)
People in Group quarters - Hospitals/wards and hospices for chronically ill (%)
People in Group quarters - Hospices or homes for chronically ill (%)
People in Group quarters - Military hospitals or wards for chronically ill (%)
People in Group quarters - Other hospitals or wards for chronically ill (%)
People in Group quarters - Hospitals or wards for drug/alcohol abuse (%)
People in Group quarters - Mental (Psychiatric) hospitals or wards (%)
People in Group quarters - Schools, hospitals, or wards for the mentally retarded (%)
People in Group quarters - Schools, hospitals, or wards for the physically handicapped (%)
People in Group quarters - Institutions for the deaf (%)
People in Group quarters - Institutions for the blind (%)
People in Group quarters - Orthopedic wards and institutions for the physically handicapped (%)
People in Group quarters - Wards in general hospitals for patients who have no usual home elsewhere (%)
People in Group quarters - Wards in military hospitals for patients who have no usual home elsewhere (%)
People in Group quarters - Juvenile institutions (%)
People in Group quarters - Long-term care (%)
People in Group quarters - Homes for abused, dependent, and neglected children (%)
People in Group quarters - Residential treatment centers for emotionally disturbed children (%)
People in Group quarters - Training schools for juvenile delinquents (%)
People in Group quarters - Short-term care, detention or diagnostic centers for delinquent children (%)
People in Group quarters - Type of juvenile institution unknown (%)
People in Group quarters - Noninstitutionalized population (%)
People in Group quarters - College dormitories (includes college quarters off campus) (%)
People in Group quarters - Military quarters (%)
People in Group quarters - On base (%)
People in Group quarters - Barracks, unaccompanied personnel housing (UPH), (Enlisted/Officer), ;and similar group living quarters for military personnel (%)
People in Group quarters - Transient quarters for temporary residents (%)
People in Group quarters - Military ships (%)
People in Group quarters - Group homes (%)
People in Group quarters - Homes or halfway houses for drug/alcohol abuse (%)
People in Group quarters - Homes for the mentally ill (%)
People in Group quarters - Homes for the mentally retarded (%)
People in Group quarters - Homes for the physically handicapped (%)
People in Group quarters - Other group homes (%)
People in Group quarters - Religious group quarters (%)
People in Group quarters - Dormitories (%)
People in Group quarters - Agriculture workers' dormitories on farms (%)
People in Group quarters - Job Corps and vocational training facilities (%)
People in Group quarters - Other workers' dormitories (%)
People in Group quarters - Crews of maritime vessels (%)
People in Group quarters - Other nonhousehold living situations (%)
People in Group quarters - Other noninstitutional group quarters (%)
Residents speaking English at home (%)
Residents speaking English at home - Born in the United States (%)
Residents speaking English at home - Native, born elsewhere (%)
Residents speaking English at home - Foreign born (%)
Residents speaking Spanish at home (%)
Residents speaking Spanish at home - Born in the United States (%)
Residents speaking Spanish at home - Native, born elsewhere (%)
Residents speaking Spanish at home - Foreign born (%)
Residents speaking other language at home (%)
Residents speaking other language at home - Born in the United States (%)
Residents speaking other language at home - Native, born elsewhere (%)
Residents speaking other language at home - Foreign born (%)
Class of Workers - Employee of private company (%)
Class of Workers - Self-employed in own incorporated business (%)
Class of Workers - Private not-for-profit wage and salary workers (%)
Class of Workers - Local government workers (%)
Class of Workers - State government workers (%)
Class of Workers - Federal government workers (%)
Class of Workers - Self-employed workers in own not incorporated business and Unpaid family workers (%)
House heating fuel used in houses and condos - Utility gas (%)
House heating fuel used in houses and condos - Bottled, tank, or LP gas (%)
House heating fuel used in houses and condos - Electricity (%)
House heating fuel used in houses and condos - Fuel oil, kerosene, etc. (%)
House heating fuel used in houses and condos - Coal or coke (%)
House heating fuel used in houses and condos - Wood (%)
House heating fuel used in houses and condos - Solar energy (%)
House heating fuel used in houses and condos - Other fuel (%)
House heating fuel used in houses and condos - No fuel used (%)
House heating fuel used in apartments - Utility gas (%)
House heating fuel used in apartments - Bottled, tank, or LP gas (%)
House heating fuel used in apartments - Electricity (%)
House heating fuel used in apartments - Fuel oil, kerosene, etc. (%)
House heating fuel used in apartments - Coal or coke (%)
House heating fuel used in apartments - Wood (%)
House heating fuel used in apartments - Solar energy (%)
House heating fuel used in apartments - Other fuel (%)
House heating fuel used in apartments - No fuel used (%)
Armed forces status - In Armed Forces (%)
Armed forces status - Civilian (%)
Armed forces status - Civilian - Veteran (%)
Armed forces status - Civilian - Nonveteran (%)
Fatal accidents locations in years 2005-2021
Fatal accidents locations in 2005
Fatal accidents locations in 2006
Fatal accidents locations in 2007
Fatal accidents locations in 2008
Fatal accidents locations in 2009
Fatal accidents locations in 2010
Fatal accidents locations in 2011
Fatal accidents locations in 2012
Fatal accidents locations in 2013
Fatal accidents locations in 2014
Fatal accidents locations in 2015
Fatal accidents locations in 2016
Fatal accidents locations in 2017
Fatal accidents locations in 2018
Fatal accidents locations in 2019
Fatal accidents locations in 2020
Fatal accidents locations in 2021
Alcohol use - People drinking some alcohol every month (%)
Alcohol use - People not drinking at all (%)
Alcohol use - Average days/month drinking alcohol
Alcohol use - Average drinks/week
Alcohol use - Average days/year people drink much
Audiometry - Average condition of hearing (%)
Audiometry - People that can hear a whisper from across a quiet room (%)
Audiometry - People that can hear normal voice from across a quiet room (%)
Audiometry - Ears ringing, roaring, buzzing (%)
Audiometry - Had a job exposure to loud noise (%)
Audiometry - Had off-work exposure to loud noise (%)
Blood Pressure & Cholesterol - Has high blood pressure (%)
Blood Pressure & Cholesterol - Checking blood pressure at home (%)
Blood Pressure & Cholesterol - Frequently checking blood cholesterol (%)
Blood Pressure & Cholesterol - Has high cholesterol level (%)
Consumer Behavior - Money monthly spent on food at supermarket/grocery store
Consumer Behavior - Money monthly spent on food at other stores
Consumer Behavior - Money monthly spent on eating out
Consumer Behavior - Money monthly spent on carryout/delivered foods
Consumer Behavior - Income spent on food at supermarket/grocery store (%)
Consumer Behavior - Income spent on food at other stores (%)
Consumer Behavior - Income spent on eating out (%)
Consumer Behavior - Income spent on carryout/delivered foods (%)
Current Health Status - General health condition (%)
Current Health Status - Blood donors (%)
Current Health Status - Has blood ever tested for HIV virus (%)
Current Health Status - Left-handed people (%)
Dermatology - People using sunscreen (%)
Diabetes - Diabetics (%)
Diabetes - Had a blood test for high blood sugar (%)
Diabetes - People taking insulin (%)
Diet Behavior & Nutrition - Diet health (%)
Diet Behavior & Nutrition - Milk product consumption (# of products/month)
Diet Behavior & Nutrition - Meals not home prepared (#/week)
Diet Behavior & Nutrition - Meals from fast food or pizza place (#/week)
Diet Behavior & Nutrition - Ready-to-eat foods (#/month)
Diet Behavior & Nutrition - Frozen meals/pizza (#/month)
Drug Use - People that ever used marijuana or hashish (%)
Drug Use - Ever used hard drugs (%)
Drug Use - Ever used any form of cocaine (%)
Drug Use - Ever used heroin (%)
Drug Use - Ever used methamphetamine (%)
Health Insurance - People covered by health insurance (%)
Kidney Conditions-Urology - Avg. # of times urinating at night
Medical Conditions - People with asthma (%)
Medical Conditions - People with anemia (%)
Medical Conditions - People with psoriasis (%)
Medical Conditions - People with overweight (%)
Medical Conditions - Elderly people having difficulties in thinking or remembering (%)
Medical Conditions - People who ever received blood transfusion (%)
Medical Conditions - People having trouble seeing even with glass/contacts (%)
Medical Conditions - People with arthritis (%)
Medical Conditions - People with gout (%)
Medical Conditions - People with congestive heart failure (%)
Medical Conditions - People with coronary heart disease (%)
Medical Conditions - People with angina pectoris (%)
Medical Conditions - People who ever had heart attack (%)
Medical Conditions - People who ever had stroke (%)
Medical Conditions - People with emphysema (%)
Medical Conditions - People with thyroid problem (%)
Medical Conditions - People with chronic bronchitis (%)
Medical Conditions - People with any liver condition (%)
Medical Conditions - People who ever had cancer or malignancy (%)
Mental Health - People who have little interest in doing things (%)
Mental Health - People feeling down, depressed, or hopeless (%)
Mental Health - People who have trouble sleeping or sleeping too much (%)
Mental Health - People feeling tired or having little energy (%)
Mental Health - People with poor appetite or overeating (%)
Mental Health - People feeling bad about themself (%)
Mental Health - People who have trouble concentrating on things (%)
Mental Health - People moving or speaking slowly or too fast (%)
Mental Health - People having thoughts they would be better off dead (%)
Oral Health - Average years since last visit a dentist
Oral Health - People embarrassed because of mouth (%)
Oral Health - People with gum disease (%)
Oral Health - General health of teeth and gums (%)
Oral Health - Average days a week using dental floss/device
Oral Health - Average days a week using mouthwash for dental problem
Oral Health - Average number of teeth
Pesticide Use - Households using pesticides to control insects (%)
Pesticide Use - Households using pesticides to kill weeds (%)
Physical Activity - People doing vigorous-intensity work activities (%)
Physical Activity - People doing moderate-intensity work activities (%)
Physical Activity - People walking or bicycling (%)
Physical Activity - People doing vigorous-intensity recreational activities (%)
Physical Activity - People doing moderate-intensity recreational activities (%)
Physical Activity - Average hours a day doing sedentary activities
Physical Activity - Average hours a day watching TV or videos
Physical Activity - Average hours a day using computer
Physical Functioning - People having limitations keeping them from working (%)
Physical Functioning - People limited in amount of work they can do (%)
Physical Functioning - People that need special equipment to walk (%)
Physical Functioning - People experiencing confusion/memory problems (%)
Physical Functioning - People requiring special healthcare equipment (%)
Prescription Medications - Average number of prescription medicines taking
Preventive Aspirin Use - Adults 40+ taking low-dose aspirin (%)
Reproductive Health - Vaginal deliveries (%)
Reproductive Health - Cesarean deliveries (%)
Reproductive Health - Deliveries resulted in a live birth (%)
Reproductive Health - Pregnancies resulted in a delivery (%)
Reproductive Health - Women breastfeeding newborns (%)
Reproductive Health - Women that had a hysterectomy (%)
Reproductive Health - Women that had both ovaries removed (%)
Reproductive Health - Women that have ever taken birth control pills (%)
Reproductive Health - Women taking birth control pills (%)
Reproductive Health - Women that have ever used Depo-Provera or injectables (%)
Reproductive Health - Women that have ever used female hormones (%)
Sexual Behavior - People 18+ that ever had sex (vaginal, anal, or oral) (%)
Sexual Behavior - Males 18+ that ever had vaginal sex with a woman (%)
Sexual Behavior - Males 18+ that ever performed oral sex on a woman (%)
Sexual Behavior - Males 18+ that ever had anal sex with a woman (%)
Sexual Behavior - Males 18+ that ever had any sex with a man (%)
Sexual Behavior - Females 18+ that ever had vaginal sex with a man (%)
Sexual Behavior - Females 18+ that ever performed oral sex on a man (%)
Sexual Behavior - Females 18+ that ever had anal sex with a man (%)
Sexual Behavior - Females 18+ that ever had any kind of sex with a woman (%)
Sexual Behavior - Average age people first had sex
Sexual Behavior - Average number of female sex partners in lifetime (males 18+)
Sexual Behavior - Average number of female vaginal sex partners in lifetime (males 18+)
Sexual Behavior - Average age people first performed oral sex on a woman (18+)
Sexual Behavior - Average number of woman performed oral sex on in lifetime (18+)
Sexual Behavior - Average number of male sex partners in lifetime (males 18+)
Sexual Behavior - Average number of male anal sex partners in lifetime (males 18+)
Sexual Behavior - Average age people first performed oral sex on a man (18+)
Sexual Behavior - Average number of male oral sex partners in lifetime (18+)
Sexual Behavior - People using protection when performing oral sex (%)
Sexual Behavior - Average number of times people have vaginal or anal sex a year
Sexual Behavior - People having sex without condom (%)
Sexual Behavior - Average number of male sex partners in lifetime (females 18+)
Sexual Behavior - Average number of male vaginal sex partners in lifetime (females 18+)
Sexual Behavior - Average number of female sex partners in lifetime (females 18+)
Sexual Behavior - Circumcised males 18+ (%)
Sleep Disorders - Average hours sleeping at night
Sleep Disorders - People that has trouble sleeping (%)
Smoking-Cigarette Use - People smoking cigarettes (%)
Taste & Smell - People 40+ having problems with smell (%)
Taste & Smell - People 40+ having problems with taste (%)
Taste & Smell - People 40+ that ever had wisdom teeth removed (%)
Taste & Smell - People 40+ that ever had tonsils teeth removed (%)
Taste & Smell - People 40+ that ever had a loss of consciousness because of a head injury (%)
Taste & Smell - People 40+ that ever had a broken nose or other serious injury to face or skull (%)
Taste & Smell - People 40+ that ever had two or more sinus infections (%)
Weight - Average height (inches)
Weight - Average weight (pounds)
Weight - Average BMI
Weight - People that are obese (%)
Weight - People that ever were obese (%)
Weight - People trying to lose weight (%)
Urban population: 13,172
Rural population: 7,978
Estimated median house/condo value in 2022: $331,560
34286:
$331,560Florida:
$354,100
According to our research of Florida and other state lists, there were 34 registered sex offenders living in 34286 zip code as of June 05, 2024 . The ratio of all residents to sex offenders in zip code 34286 is 618 to 1.The ratio of registered sex offenders to all residents in this zip code is near the state average.
Median resident age: This zip code:
47.9 yearsFlorida median age:
42.7 years
Average household size: This zip code:
2.6 peopleFlorida:
2.5 people
Averages for the 2020 tax year for zip code 34286, filed in 2021:
Average Adjusted Gross Income (AGI) in 2020: $53,770 (Individual Income Tax Returns) Here:
$53,770State:
$82,200
Salary/wage: $47,898 (reported on 80.5% of returns )Here:
$47,898State:
$58,347
(% of AGI for various income ranges: 1175.3% for AGIs below $25k , 3493.1% for AGIs $25k-50k , 6509.6% for AGIs $50k-75k , 9261.1% for AGIs $75k-100k , 15809.6% for AGIs $100k-200k , 53408.0% for AGIs over 200k ) Taxable interest for individuals: $1,042 (reported on 21.4% of returns )This zip code:
$1,042Florida:
$4,272
(% of AGI for various income ranges: 15.1% for AGIs below $25k , 15.2% for AGIs $25k-50k , 32.6% for AGIs $50k-75k , 39.0% for AGIs $75k-100k , 112.2% for AGIs $100k-200k , 188.0% for AGIs over 200k ) Ordinary dividends: $2,858 (reported on 14.3% of returns )(% of AGI for various income ranges: 20.7% for AGIs below $25k , 26.1% for AGIs $25k-50k , 41.5% for AGIs $50k-75k , 94.6% for AGIs $75k-100k , 177.0% for AGIs $100k-200k , 1366.0% for AGIs over 200k ) Net capital gain/loss in AGI: +$8,824 (reported on 13.2% of returns )Here:
+$8,824State:
+$62,983
(% of AGI for various income ranges: 8.0% for AGIs below $25k , 23.0% for AGIs $25k-50k , 76.6% for AGIs $50k-75k , 90.6% for AGIs $75k-100k , 617.9% for AGIs $100k-200k , 11318.0% for AGIs over 200k ) Profit/loss from business: +$10,139 (reported on 18.6% of returns )Here:
+$10,139State:
+$9,719
(% of AGI for various income ranges: 172.5% for AGIs below $25k , 228.6% for AGIs $25k-50k , 266.1% for AGIs $50k-75k , 283.8% for AGIs $75k-100k , 452.5% for AGIs $100k-200k , 2724.0% for AGIs over 200k ) Taxable individual retirement arrangement distribution: $18,917 (reported on 8.3% of returns )34286:
$18,917Florida:
$24,823
(% of AGI for various income ranges: 57.4% for AGIs below $25k , 92.1% for AGIs $25k-50k , 186.5% for AGIs $50k-75k , 319.1% for AGIs $75k-100k , 690.8% for AGIs $100k-200k , 6704.0% for AGIs over 200k ) Total itemized deductions: $27,310 (reported on 4.7% of returns )Here:
$27,310State:
$45,393
(% of AGI for various income ranges: 32.9% for AGIs below $25k , 136.1% for AGIs $25k-50k , 219.3% for AGIs $50k-75k , 305.2% for AGIs $75k-100k , 351.8% for AGIs $100k-200k , 3528.0% for AGIs over 200k ) Charity contributions: $6,005 (reported on 3.5% of returns )(% of AGI for various income ranges: 3.5% for AGIs below $25k , 19.3% for AGIs $25k-50k , 28.9% for AGIs $50k-75k , 41.2% for AGIs $75k-100k , 73.0% for AGIs $100k-200k , 958.0% for AGIs over 200k ) Taxes paid: $5,547 (reported on 4.6% of returns )(% of AGI for various income ranges: 6.2% for AGIs below $25k , 22.8% for AGIs $25k-50k , 46.1% for AGIs $50k-75k , 61.8% for AGIs $75k-100k , 77.8% for AGIs $100k-200k , 742.0% for AGIs over 200k ) Earned income credit: $2,301 (reported on 17.4% of returns )(% of AGI for various income ranges: 98.6% for AGIs below $25k , 74.3% for AGIs $25k-50k , 1.7% for AGIs $50k-75k ) Percentage of individuals using paid preparers for their 2020 taxes: 93.7%(% for various income ranges: 92.4% for AGIs below $25k , 94.6% for AGIs $25k-50k , 94.6% for AGIs $50k-75k , 94.0% for AGIs $75k-100k , 93.8% for AGIs $100k-200k , 94.1% for AGIs over 200k )
Averages for the 2012 tax year for zip code 34286, filed in 2013:
Average Adjusted Gross Income (AGI) in 2012: $41,444 (Individual Income Tax Returns) Here:
$41,444State:
$60,316
Salary/wage: $38,054 (reported on 82.8% of returns )Here:
$38,054State:
$45,277
(% of AGI for various income ranges: 70.7% for AGIs below $25k , 79.2% for AGIs $25k-50k , 78.1% for AGIs $50k-75k , 77.5% for AGIs $75k-100k , 76.3% for AGIs $100k-200k , 52.2% for AGIs over 200k ) Taxable interest for individuals: $819 (reported on 23.5% of returns )This zip code:
$819Florida:
$3,587
(% of AGI for various income ranges: 0.8% for AGIs below $25k , 0.4% for AGIs $25k-50k , 0.4% for AGIs $50k-75k , 0.4% for AGIs $75k-100k , 0.5% for AGIs $100k-200k , 0.3% for AGIs over 200k ) Ordinary dividends: $2,345 (reported on 13.5% of returns )(% of AGI for various income ranges: 1.1% for AGIs below $25k , 0.7% for AGIs $25k-50k , 0.7% for AGIs $50k-75k , 0.6% for AGIs $75k-100k , 1.0% for AGIs $100k-200k , 0.7% for AGIs over 200k ) Net capital gain/loss in AGI: +$1,316 (reported on 9.5% of returns )Here:
+$1,316State:
+$33,493
(% of AGI for various income ranges: 0.4% for AGIs $75k-100k , 1.7% for AGIs $100k-200k ) Profit/loss from business: +$8,843 (reported on 15.7% of returns )Here:
+$8,843State:
+$10,012
(% of AGI for various income ranges: 10.0% for AGIs below $25k , 3.4% for AGIs $25k-50k , 2.4% for AGIs $50k-75k , 1.6% for AGIs $75k-100k , 2.5% for AGIs $100k-200k ) Taxable individual retirement arrangement distribution: $11,749 (reported on 9.0% of returns )34286:
$11,749Florida:
$21,544
(% of AGI for various income ranges: 3.2% for AGIs below $25k , 2.4% for AGIs $25k-50k , 2.4% for AGIs $50k-75k , 2.7% for AGIs $75k-100k , 3.0% for AGIs $100k-200k ) Total itemized deductions: $17,272 (26% of AGI, reported on 24.8% of returns )Here:
$17,272State:
$25,533
Here:
26.2% of AGIState:
18.0% of AGI
(% of AGI for various income ranges: 9.7% for AGIs below $25k , 10.0% for AGIs $25k-50k , 10.3% for AGIs $50k-75k , 10.9% for AGIs $75k-100k , 10.7% for AGIs $100k-200k , 10.0% for AGIs over 200k ) Charity contributions: $2,489 (reported on 18.4% of returns )(% of AGI for various income ranges: 0.6% for AGIs below $25k , 0.9% for AGIs $25k-50k , 1.1% for AGIs $50k-75k , 1.2% for AGIs $75k-100k , 1.6% for AGIs $100k-200k , 1.6% for AGIs over 200k ) Taxes paid: $3,360 (reported on 24.3% of returns )(% of AGI for various income ranges: 1.6% for AGIs below $25k , 1.7% for AGIs $25k-50k , 1.9% for AGIs $50k-75k , 2.0% for AGIs $75k-100k , 2.3% for AGIs $100k-200k , 3.4% for AGIs over 200k ) Earned income credit: $2,367 (reported on 23.8% of returns )(% of AGI for various income ranges: 8.0% for AGIs below $25k , 1.5% for AGIs $25k-50k ) Percentage of individuals using paid preparers for their 2012 taxes: 44.1%(% for various income ranges: 41.4% for AGIs below $25k , 44.7% for AGIs $25k-50k , 44.9% for AGIs $50k-75k , 46.4% for AGIs $75k-100k , 50.0% for AGIs $100k-200k , 80.0% for AGIs over 200k )
Averages for the 2004 tax year for zip code 34286, filed in 2005:
Average Adjusted Gross Income (AGI) in 2004: $40,891 (Individual Income Tax Returns) Here:
$40,891State:
$50,523
Salary/wage: $36,928 (reported on 88.1% of returns )Here:
$36,928State:
$39,563
(% of AGI for various income ranges: 125.8% for AGIs below $10k , 77.8% for AGIs $10k-25k , 84.8% for AGIs $25k-50k , 84.3% for AGIs $50k-75k , 82.3% for AGIs $75k-100k , 58.9% for AGIs over 100k ) Taxable interest for individuals: $951 (reported on 35.0% of returns )This zip code:
$951Florida:
$3,211
(% of AGI for various income ranges: 5.0% for AGIs below $10k , 1.5% for AGIs $10k-25k , 0.6% for AGIs $25k-50k , 0.6% for AGIs $50k-75k , 0.6% for AGIs $75k-100k , 1.1% for AGIs over 100k ) Taxable dividends: $1,229 (reported on 16.3% of returns )(% of AGI for various income ranges: 3.8% for AGIs below $10k , 0.8% for AGIs $10k-25k , 0.4% for AGIs $25k-50k , 0.5% for AGIs $50k-75k , 0.2% for AGIs $75k-100k , 0.5% for AGIs over 100k ) Net capital gain/loss: +$11,459 (reported on 13.7% of returns )Here:
+$11,459State:
+$27,205
(% of AGI for various income ranges: 3.6% for AGIs below $10k , 1.0% for AGIs $10k-25k , 0.7% for AGIs $25k-50k , 1.7% for AGIs $50k-75k , 3.2% for AGIs $75k-100k , 14.5% for AGIs over 100k ) Profit/loss from business: +$9,248 (reported on 16.0% of returns )Here:
+$9,248State:
+$10,634
(% of AGI for various income ranges: 5.2% for AGIs below $10k , 6.6% for AGIs $10k-25k , 3.0% for AGIs $25k-50k , 2.7% for AGIs $50k-75k , 2.5% for AGIs $75k-100k , 5.2% for AGIs over 100k ) IRA payment deduction: $2,853 (reported on 2.3% of returns )34286:
$2,853Florida:
$3,082
(% of AGI for various income ranges: 0.2% for AGIs $10k-25k , 0.2% for AGIs $25k-50k , 0.2% for AGIs $50k-75k , 0.1% for AGIs $75k-100k , 0.2% for AGIs over 100k ) Self-employed pension: $6,636 (reported on 0.1% of returns )Here:
$6,636Florida:
$15,857
Total itemized deductions: $15,058 (27% of AGI, reported on 40.2% of returns )Here:
$15,058State:
$20,370
Here:
26.6% of AGIState:
20.7% of AGI
(% of AGI for various income ranges: 25.3% for AGIs below $10k , 15.1% for AGIs $10k-25k , 16.6% for AGIs $25k-50k , 14.4% for AGIs $50k-75k , 15.4% for AGIs $75k-100k , 11.2% for AGIs over 100k ) Charity contributions deductions: $1,904 (3% of AGI, reported on 31.4% of returns )Here:
3.2% of AGIState:
3.8% of AGI
(% of AGI for various income ranges: 1.0% for AGIs below $10k , 1.1% for AGIs $10k-25k , 1.3% for AGIs $25k-50k , 1.5% for AGIs $50k-75k , 1.6% for AGIs $75k-100k , 1.9% for AGIs over 100k ) Total tax: $4,746 (reported on 76.5% of returns )(% of AGI for various income ranges: 3.8% for AGIs below $10k , 4.2% for AGIs $10k-25k , 6.1% for AGIs $25k-50k , 8.0% for AGIs $50k-75k , 10.2% for AGIs $75k-100k , 16.9% for AGIs over 100k ) Earned income credit: $1,674 (reported on 14.8% of returns )Percentage of individuals using paid preparers for their 2004 taxes: 56.2%(% for various income ranges: 48.4% for AGIs below $10k , 57.0% for AGIs $10k-25k , 57.3% for AGIs $25k-50k , 55.7% for AGIs $50k-75k , 57.7% for AGIs $75k-100k , 68.5% for AGIs over 100k )
Estimated median household income in 2022: This zip code:
$69,252Florida:
$69,303
Nearest zip codes: 34289 ,
34291 ,
34287 ,
34288 ,
33954 ,
33953 .
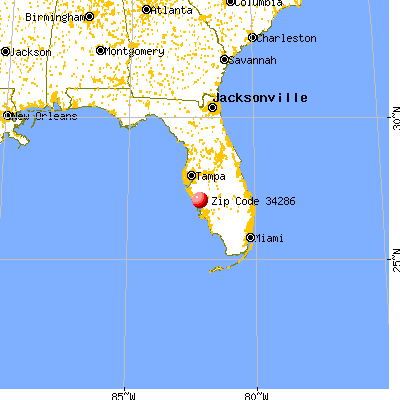
North Port Zip Code Map
Percentage of family households: This zip code:
45.4%Florida:
41.2%
Percentage of households with unmarried partners: This zip code:
2.9%Florida:
46.7%
No gay or lesbian households reported
Household received Food Stamps/SNAP in the past 12 months: 815Household did not receive Food Stamps/SNAP in the past 12 months: 7,421
Women who had a birth in the past 12 months: 198 (96 now married , 97 unmarried) Women who did not have a birth in the past 12 months: 3,535 (1,768 now married , 1,767 unmarried)
Housing units in zip code 34286 with a mortgage: 4,249 (540
second mortgage , 194
home equity loan , 260
both second mortgage and home equity loan )
Houses without a mortgage: 33
Median monthly owner costs for units with a mortgage: $1,419
Median monthly owner costs for units without a mortgage: $479
Residents with income below the poverty level in 2022:
This zip code:
7.6%Whole state:
12.7%
Residents with income below 50% of the poverty level in 2022:
This zip code:
4.3%Whole state:
6.6%
Median number of rooms in houses and condos: Median number of rooms in apartments:
Year house built (houses)
140 2020 or later687 2010 to 20195,629 2000 to 20091,484 1990 to 1999434 1980 to 1989259 1970 to 197932 1960 to 19690 1950 to 19590 1940 to 19490 1939 or earlier
Zip code 34286 household income distribution in 2022 148 Less than $10,000183 $10,000 to $14,999207 $15,000 to $19,999188 $20,000 to $24,999205 $25,000 to $29,999244 $30,000 to $34,999227 $35,000 to $39,999513 $40,000 to $44,999687 $45,000 to $49,999947 $50,000 to $59,999739 $60,000 to $74,9991,265 $75,000 to $99,9991,141 $100,000 to $124,999679 $125,000 to $149,999335 $150,000 to $199,999457 $200,000 or moreEstimate of home value of owner-occupied houses/condos in 2022 in zip code 34286 137 Less than $10,0007 $10,000 to $14,99940 $20,000 to $24,99938 $25,000 to $29,99941 $30,000 to $34,99913 $90,000 to $99,99978 $125,000 to $149,999178 $150,000 to $174,999275 $175,000 to $199,9991,101 $200,000 to $249,9991,141 $250,000 to $299,9991,824 $300,000 to $399,999727 $400,000 to $499,999369 $500,000 to $749,99937 $750,000 to $999,99985 $1,000,000 to $1,499,999Rent paid by renters in 2022 in zip code 34286 6 $800 to $899239 $900 to $999201 $1,000 to $1,249140 $1,250 to $1,499687 $1,500 to $1,999134 $2,000 to $2,49917 $2,500 to $2,99997 $3,500 or more129 No cash rent
Median gross rent in 2022: $1,831.
Median price asked for vacant for-sale houses and condos in 2022: $113,482.
Estimated median house (or condo) value in 2022 for: White Non-Hispanic householders: $329,302Black or African American householders: $365,747Asian householders: $362,845Some other race householders: $370,908Two or more races householders: $294,791Hispanic or Latino householders: $318,336Estimated median house or condo value in 2022: $331,560
34286:
$331,560Florida:
$354,100
Lower value quartile - upper value quartile: $265,489 - $420,563
Mean price in 2022: Detached houses: $280,838Here:
$280,838State:
$500,941
Housing units in structures:
One, detached: 8,330One, attached: 17450 or more: 130Mobile homes: 54Unemployment : 3.1%
Means of transportation to work in zip code 34286 72.6% 6,569 Drove a car alone12.7% 1,152 Carpooled2.0% 181 Walked11.2% 1,013 Worked at homeTravel time to work (commute) in zip code 34286 218 Less than 5 minutes925 5 to 9 minutes923 10 to 14 minutes782 15 to 19 minutes1,248 20 to 24 minutes409 25 to 29 minutes1,468 30 to 34 minutes391 35 to 39 minutes243 40 to 44 minutes1,018 45 to 59 minutes222 60 to 89 minutes42 90 or more minutes
Percentage of zip code residents living and working in this county: 63.6%
Household type by relationship:
Households: 21,151
Male householders: 4,530 (550 living alone ), Female householders: 3,683 (643 living alone )4,930 spouses (4,802 opposite-sex spouses ), 880 unmarried partners , (880 opposite-sex unmarried partners ), 5,582 children (4,895 natural , 449 adopted , 250 stepchildren ), 503 grandchildren , 205 brothers or sisters , 327 parents , 0 foster children , 318 other relatives , 272 non-relatives In group quarters: 15 (-1 institutionalized population )
Size of family households: 3,156 2-persons , 1,722 3-persons , 769 4-persons , 440 5-persons , 291 6-persons , 82 7-or-more-persons
Size of nonfamily households: 1,192 1-person , 485 2-persons , 81 3-persons
2,361 married couples with children. single-parent households (330 men , 872 women ).
89.8% of residents of 34286 zip code speak English at home. of residents speak Spanish at home (76% very well, 10% well, 5% not well, 10% not at all ).of residents speak other Indo-European language at home (57% very well, 29% well, 14% not well ).of residents speak other language at home (81% very well, 19% not well ).
Foreign born population: 1,796 (8.5%)
(73.6%
of them are naturalized citizens )
This zip code:
8.5%Whole state:
21.7%
10% Barbados 8% Croatia 8% Guyana 6% Ecuador 6% Haiti 5% Serbia 5% Italy 14% American 14% German 10% English 8% Italian 7% Irish 6% Polish 2% Swedish
Year of entry for the foreign-born population
439 2010 or later 436 2000 to 2009 513 1990 to 1999 935 Before 1990
Facilities with environmental interests located in this zip code:
NEW MIDDLE DD (6501 W. PRICE BLVD. in NORTH PORT, FL)
(National Center for Education Statistics) - STATE ID-1261 Organizations: SARASOTA COUNTY SCHOOL DISTRICT (SCHOOL DISTRICT)
ISLAND WALK @ THE WEST VILLAGE ( in NORTH PORT, FL)
National Pollutant Discharge Elimination System NON-MAJOR (Tracking pollutant discharge elimination systems) - permit Organizations: JEFF BLOCH (CONTACT/OWNER)
ISLAND WALK AT THE WEST VILLAG (ISLAND WALK CIRLCE & HAVANA ST in NORTH PORT, FL)
National Pollutant Discharge Elimination System NON-MAJOR (Tracking pollutant discharge elimination systems) - permit Organizations: DUTCH NEUWEILER (CONTACT/OWNER)
NORTH PORT FIRE RESCUE (NABATOFF ST in NORTH PORT, FL)
National Pollutant Discharge Elimination System NON-MAJOR (Tracking pollutant discharge elimination systems) - permit Organizations: FRANK TREMONTI (CONTACT/OWNER)
PROPOSED TACO BELL KFC & RETAI ( in NORTH PORT, FL)
National Pollutant Discharge Elimination System NON-MAJOR (Tracking pollutant discharge elimination systems) - permit Organizations: CARLOS SILVA (CONTACT/OWNER)
DAVIS COATINGS INC (5870 GADSHAW AVE in NORTH PORT, FL)
(Resource Conservation and Recovery Act (tracking hazardous waste)) Organizations: TROY DAVIS (CONTACT/OWNER)
SHOPPES AT HERON CREEK (HERON CREEK in NORTH PORT, FL)
National Pollutant Discharge Elimination System NON-MAJOR (Tracking pollutant discharge elimination systems) - permit Organizations: OWEN EWING (CONTACT/OWNER)
Housing units lacking complete kitchen facilities: 0.8%
96.6% Electricity 1.2% Utility gas 1.1% No fuel used 0.6% Bottled, tank, or LP gas 0.6% Solar energy
Place of birth for U.S.-born residents:
This state: 6,396Northeast: 5,814Midwest: 3,665South: 2,429West: 369
35% of the 34286 zip code residents lived in the same house 5 years ago.
Out of people who lived in different houses, 40% lived in this county.
Out of people who lived in different counties, 50% lived in Florida.
91% of the 34286 zip code residents lived in the same house 1 year ago.
Out of people who lived in different houses, 26% moved from this county.
Out of people who lived in different houses, 15% moved from different county within same state.
Out of people who lived in different houses, 66% moved from different state.
Out of people who lived in different houses, 1% moved from abroad.
Private vs. public school enrollment:
Students in private schools in grades 1 to 8 (elementary and middle school): 84
Students in private schools in grades 9 to 12 (high school): 188
Students in private undergraduate colleges: 175
Occupation by median earnings in the past 12 months ($)
118,738 Health diagnosing and treating practitioners and other technical occupations 88,162 Law enforcement workers including supervisors 82,114 Healthcare support occupations 74,575 Business and financial operations occupations 69,417 Management occupations 48,249 Health technologists and technicians
Top industries in this zip code by the number of employees in 2005:
Construction: All Other Specialty Trade Contractors (20-49 employees: 1 establishment, 5-9 employees: 2 establishments, 1-4 employees: 8 establishments)Construction: Drywall and Insulation Contractors (20-49: 1, 5-9: 1, 1-4: 5)Construction: Masonry Contractors (20-49: 1, 5-9: 1, 1-4: 3)Construction: New Single-Family Housing Construction (except Operative Builders) (5-9: 1, 1-4: 15)Construction: Finish Carpentry Contractors (1-4: 17)Administrative and Support and Waste Management and Remediation Services: Janitorial Services (10-19: 1, 5-9: 1, 1-4: 5)Construction: Framing Contractors (5-9: 2, 1-4: 5)Administrative and Support and Waste Management and Remediation Services: Landscaping Services (5-9: 2, 1-4: 4)Construction: Plumbing, Heating, and Air-Conditioning Contractors (5-9: 1, 1-4: 6)
People in group quarters in 2000:
14 people in training schools for juvenile delinquents
Fatal accident statistics in 2013:
Fatal accident count: 1Vehicles involved in fatal accidents: 1Fatal accidents caused by drunken drivers: 0Fatalities: 1Persons involved in fatal accidents: 1Pedestrians involved in fatal accidents: 0
Fatal accident statistics in 2012:
Fatal accident count: 1Vehicles involved in fatal accidents: 1Fatal accidents caused by drunken drivers: 1Fatalities: 1Persons involved in fatal accidents: 1Pedestrians involved in fatal accidents: 0
Home Mortgage Disclosure Act Aggregated Statistics For Year 2009(Based on 2 full and 6 partial tracts) A) FHA, FSA/RHS & VA B) Conventional C) Refinancings D) Home Improvement Loans F) Non-occupant Loans on G) Loans On Manufactured Number Average Value Number Average Value Number Average Value Number Average Value Number Average Value Number Average Value
LOANS ORIGINATED 535 $112,332 707 $113,454 705 $168,814 19 $87,850 409 $106,003 0 $0 APPLICATIONS APPROVED, NOT ACCEPTED 33 $108,386 42 $135,828 116 $164,479 11 $63,819 30 $114,974 1 $26,540 APPLICATIONS DENIED 160 $107,074 157 $149,676 532 $182,621 51 $57,412 120 $130,826 3 $78,070 APPLICATIONS WITHDRAWN 63 $117,259 91 $117,548 268 $159,478 10 $45,260 58 $129,017 0 $0 FILES CLOSED FOR INCOMPLETENESS 36 $125,432 13 $150,262 61 $133,927 1 $29,660 7 $127,317 0 $0
Aggregated Statistics For Year 2008(Based on 2 full and 6 partial tracts) A) FHA, FSA/RHS & VA B) Conventional C) Refinancings D) Home Improvement Loans E) Loans on Dwellings For 5+ Families F) Non-occupant Loans on G) Loans On Manufactured Number Average Value Number Average Value Number Average Value Number Average Value Number Average Value Number Average Value Number Average Value
LOANS ORIGINATED 583 $136,203 937 $138,311 657 $161,943 38 $86,455 0 $0 461 $130,661 0 $0 APPLICATIONS APPROVED, NOT ACCEPTED 30 $158,156 117 $154,311 157 $186,768 23 $20,436 0 $0 78 $147,117 4 $31,330 APPLICATIONS DENIED 167 $153,549 220 $160,182 892 $192,588 142 $81,306 0 $0 243 $168,263 9 $52,551 APPLICATIONS WITHDRAWN 60 $146,884 117 $178,448 234 $197,572 22 $157,570 1 $338,260 54 $163,079 0 $0 FILES CLOSED FOR INCOMPLETENESS 39 $138,369 42 $153,862 100 $189,281 2 $204,565 0 $0 42 $172,422 0 $0
Aggregated Statistics For Year 2007(Based on 2 full and 6 partial tracts) A) FHA, FSA/RHS & VA B) Conventional C) Refinancings D) Home Improvement Loans F) Non-occupant Loans on G) Loans On Manufactured Number Average Value Number Average Value Number Average Value Number Average Value Number Average Value Number Average Value
LOANS ORIGINATED 235 $178,081 2,180 $180,490 2,085 $183,266 211 $90,122 908 $185,635 0 $0 APPLICATIONS APPROVED, NOT ACCEPTED 7 $175,893 384 $177,782 594 $180,668 90 $50,438 199 $176,900 4 $96,372 APPLICATIONS DENIED 57 $179,915 644 $192,168 2,048 $209,592 314 $95,792 386 $210,509 12 $81,787 APPLICATIONS WITHDRAWN 27 $173,273 261 $189,363 1,003 $201,633 70 $110,687 213 $187,752 0 $0 FILES CLOSED FOR INCOMPLETENESS 8 $166,400 101 $196,046 353 $205,097 16 $151,568 40 $221,262 0 $0
Aggregated Statistics For Year 2006(Based on 2 full and 6 partial tracts) A) FHA, FSA/RHS & VA B) Conventional C) Refinancings D) Home Improvement Loans E) Loans on Dwellings For 5+ Families F) Non-occupant Loans on G) Loans On Manufactured Number Average Value Number Average Value Number Average Value Number Average Value Number Average Value Number Average Value Number Average Value
LOANS ORIGINATED 253 $197,933 5,561 $172,275 3,765 $187,280 387 $103,080 3 $11,435,117 2,622 $182,618 7 $113,180 APPLICATIONS APPROVED, NOT ACCEPTED 12 $175,052 896 $181,781 685 $184,292 102 $55,694 0 $0 516 $189,753 6 $63,605 APPLICATIONS DENIED 45 $194,044 1,538 $175,663 2,044 $198,428 404 $91,989 1 $44,230 671 $185,480 14 $87,406 APPLICATIONS WITHDRAWN 9 $186,426 733 $182,610 1,424 $184,597 116 $142,670 0 $0 453 $194,258 5 $118,238 FILES CLOSED FOR INCOMPLETENESS 9 $185,654 243 $168,904 469 $200,584 34 $96,371 0 $0 73 $190,174 0 $0
Aggregated Statistics For Year 2005(Based on 2 full and 6 partial tracts) A) FHA, FSA/RHS & VA B) Conventional C) Refinancings D) Home Improvement Loans E) Loans on Dwellings For 5+ Families F) Non-occupant Loans on G) Loans On Manufactured Number Average Value Number Average Value Number Average Value Number Average Value Number Average Value Number Average Value Number Average Value
LOANS ORIGINATED 285 $166,829 7,595 $166,178 3,663 $174,543 490 $102,839 2 $7,473,425 3,697 $167,532 6 $62,328 APPLICATIONS APPROVED, NOT ACCEPTED 20 $168,106 814 $176,238 557 $167,308 100 $69,900 0 $0 405 $178,358 8 $109,580 APPLICATIONS DENIED 29 $173,997 1,181 $166,051 1,623 $167,678 539 $79,728 0 $0 496 $162,722 23 $72,999 APPLICATIONS WITHDRAWN 17 $144,415 708 $175,245 1,261 $168,160 178 $137,238 0 $0 313 $174,997 7 $151,466 FILES CLOSED FOR INCOMPLETENESS 7 $163,227 235 $173,731 777 $171,261 42 $114,893 0 $0 103 $166,911 0 $0
Aggregated Statistics For Year 2004(Based on 2 full and 6 partial tracts) A) FHA, FSA/RHS & VA B) Conventional C) Refinancings D) Home Improvement Loans F) Non-occupant Loans on G) Loans On Manufactured Number Average Value Number Average Value Number Average Value Number Average Value Number Average Value Number Average Value
LOANS ORIGINATED 634 $140,645 4,009 $139,324 2,316 $137,553 245 $67,042 1,231 $135,180 6 $73,685 APPLICATIONS APPROVED, NOT ACCEPTED 33 $136,752 497 $138,106 482 $136,417 81 $50,403 168 $131,801 15 $35,652 APPLICATIONS DENIED 79 $139,039 593 $140,433 1,374 $137,218 436 $42,734 175 $132,535 17 $56,208 APPLICATIONS WITHDRAWN 41 $141,251 338 $143,058 920 $135,001 72 $76,848 110 $137,135 1 $15,610 FILES CLOSED FOR INCOMPLETENESS 8 $139,001 103 $133,585 489 $144,804 32 $52,114 35 $121,115 0 $0
Aggregated Statistics For Year 2003(Based on 2 full and 6 partial tracts) A) FHA, FSA/RHS & VA B) Conventional C) Refinancings D) Home Improvement Loans E) Loans on Dwellings For 5+ Families F) Non-occupant Loans on Number Average Value Number Average Value Number Average Value Number Average Value Number Average Value Number Average Value
LOANS ORIGINATED 609 $127,427 2,016 $127,747 3,179 $125,570 128 $31,856 2 $8,528,695 546 $116,891 APPLICATIONS APPROVED, NOT ACCEPTED 33 $121,156 204 $140,114 464 $126,083 37 $49,768 0 $0 47 $134,166 APPLICATIONS DENIED 86 $118,704 242 $136,233 1,468 $117,724 189 $30,421 0 $0 87 $115,654 APPLICATIONS WITHDRAWN 34 $112,868 220 $128,463 605 $116,784 26 $30,148 0 $0 53 $113,472 FILES CLOSED FOR INCOMPLETENESS 10 $121,037 57 $115,447 148 $138,399 10 $33,602 0 $0 13 $202,129
Aggregated Statistics For Year 2002(Based on 2 partial tracts) A) FHA, FSA/RHS & VA B) Conventional C) Refinancings D) Home Improvement Loans F) Non-occupant Loans on Number Average Value Number Average Value Number Average Value Number Average Value Number Average Value
LOANS ORIGINATED 39 $93,485 135 $84,220 124 $118,038 11 $23,655 49 $71,794 APPLICATIONS APPROVED, NOT ACCEPTED 3 $108,070 16 $77,409 21 $73,624 2 $12,490 6 $69,733 APPLICATIONS DENIED 7 $89,657 28 $89,658 81 $72,001 24 $17,412 17 $54,305 APPLICATIONS WITHDRAWN 1 $45,800 16 $90,614 37 $67,371 2 $39,810 2 $66,610 FILES CLOSED FOR INCOMPLETENESS 3 $97,487 2 $263,320 19 $94,740 1 $58,280 1 $18,210
Aggregated Statistics For Year 2001(Based on 2 partial tracts) A) FHA, FSA/RHS & VA B) Conventional C) Refinancings D) Home Improvement Loans F) Non-occupant Loans on Number Average Value Number Average Value Number Average Value Number Average Value Number Average Value
LOANS ORIGINATED 53 $76,754 83 $77,966 89 $66,015 13 $13,050 32 $57,163 APPLICATIONS APPROVED, NOT ACCEPTED 1 $75,460 7 $67,354 16 $65,961 4 $12,490 2 $50,740 APPLICATIONS DENIED 4 $89,248 16 $66,806 90 $57,018 21 $11,820 5 $40,278 APPLICATIONS WITHDRAWN 3 $95,233 8 $93,346 37 $72,322 3 $13,183 2 $63,230 FILES CLOSED FOR INCOMPLETENESS 2 $48,920 3 $53,947 8 $63,554 2 $10,670 1 $34,350
Aggregated Statistics For Year 2000(Based on 2 partial tracts) A) FHA, FSA/RHS & VA B) Conventional C) Refinancings D) Home Improvement Loans F) Non-occupant Loans on Number Average Value Number Average Value Number Average Value Number Average Value Number Average Value
LOANS ORIGINATED 44 $68,977 61 $63,719 32 $56,756 15 $19,845 20 $59,143 APPLICATIONS APPROVED, NOT ACCEPTED 3 $50,653 14 $60,552 12 $54,989 6 $10,408 3 $29,490 APPLICATIONS DENIED 6 $67,132 23 $62,674 56 $43,602 21 $16,430 6 $51,780 APPLICATIONS WITHDRAWN 3 $99,917 8 $75,262 41 $44,615 3 $25,153 2 $23,420 FILES CLOSED FOR INCOMPLETENESS 1 $69,210 3 $67,307 4 $50,088 1 $3,640 1 $64,010
Aggregated Statistics For Year 1999(Based on 1 full and 3 partial tracts) A) FHA, FSA/RHS & VA B) Conventional C) Refinancings D) Home Improvement Loans E) Loans on Dwellings For 5+ Families F) Non-occupant Loans on Number Average Value Number Average Value Number Average Value Number Average Value Number Average Value Number Average Value
LOANS ORIGINATED 290 $164,279 424 $115,463 282 $89,241 40 $20,558 0 $0 96 $99,880 APPLICATIONS APPROVED, NOT ACCEPTED 5 $109,428 46 $95,805 70 $74,954 32 $22,459 0 $0 7 $82,741 APPLICATIONS DENIED 11 $78,458 80 $106,093 256 $67,574 85 $20,209 0 $0 14 $100,240 APPLICATIONS WITHDRAWN 8 $87,998 43 $103,937 129 $79,899 13 $48,258 1 $10,445,400 7 $93,839 FILES CLOSED FOR INCOMPLETENESS 6 $79,095 11 $110,917 24 $98,079 2 $26,180 0 $0 3 $76,813
Detailed HMDA statistics for the following Tracts:
0027.01
,
0027.11 ,
0027.12 ,
0027.13
Private Mortgage Insurance Companies Aggregated Statistics For Year 2009(Based on 2 full and 6 partial tracts) A) Conventional B) Refinancings C) Non-occupant Loans on Number Average Value Number Average Value Number Average Value
LOANS ORIGINATED 42 $119,717 1 $380,640 8 $126,942 APPLICATIONS APPROVED, NOT ACCEPTED 35 $202,645 14 $198,428 14 $232,924 APPLICATIONS DENIED 13 $96,137 2 $171,355 7 $93,116 APPLICATIONS WITHDRAWN 3 $147,243 3 $178,810 3 $195,243 FILES CLOSED FOR INCOMPLETENESS 4 $200,998 0 $0 2 $252,630
Aggregated Statistics For Year 2008(Based on 2 full and 6 partial tracts) A) Conventional B) Refinancings C) Non-occupant Loans on Number Average Value Number Average Value Number Average Value
LOANS ORIGINATED 280 $153,980 47 $195,765 94 $153,213 APPLICATIONS APPROVED, NOT ACCEPTED 155 $215,171 109 $208,908 97 $247,164 APPLICATIONS DENIED 51 $196,489 13 $166,866 38 $202,039 APPLICATIONS WITHDRAWN 28 $148,821 12 $165,322 11 $174,990 FILES CLOSED FOR INCOMPLETENESS 10 $191,162 12 $230,998 16 $213,033
Aggregated Statistics For Year 2007(Based on 2 full and 6 partial tracts) A) Conventional B) Refinancings C) Non-occupant Loans on Number Average Value Number Average Value Number Average Value
LOANS ORIGINATED 687 $206,032 324 $232,695 273 $216,269 APPLICATIONS APPROVED, NOT ACCEPTED 128 $217,431 96 $231,484 69 $235,737 APPLICATIONS DENIED 26 $237,624 14 $315,592 19 $217,811 APPLICATIONS WITHDRAWN 33 $229,386 44 $236,350 27 $216,088 FILES CLOSED FOR INCOMPLETENESS 3 $238,943 3 $207,510 2 $232,735
Aggregated Statistics For Year 2006(Based on 2 full and 6 partial tracts) A) Conventional B) Refinancings C) Non-occupant Loans on Number Average Value Number Average Value Number Average Value
LOANS ORIGINATED 748 $214,974 166 $226,811 308 $207,587 APPLICATIONS APPROVED, NOT ACCEPTED 179 $237,419 47 $236,007 103 $216,750 APPLICATIONS DENIED 13 $219,682 1 $109,280 10 $235,092 APPLICATIONS WITHDRAWN 47 $271,504 12 $246,518 26 $248,976 FILES CLOSED FOR INCOMPLETENESS 2 $178,035 2 $196,930 0 $0
Aggregated Statistics For Year 2005(Based on 2 full and 6 partial tracts) A) Conventional B) Refinancings C) Non-occupant Loans on Number Average Value Number Average Value Number Average Value
LOANS ORIGINATED 985 $183,480 149 $197,917 436 $170,578 APPLICATIONS APPROVED, NOT ACCEPTED 237 $191,525 59 $191,363 111 $180,758 APPLICATIONS DENIED 13 $257,428 12 $187,151 15 $184,730 APPLICATIONS WITHDRAWN 59 $182,431 25 $188,395 33 $190,083 FILES CLOSED FOR INCOMPLETENESS 7 $207,690 2 $282,465 4 $248,405
Aggregated Statistics For Year 2004(Based on 2 full and 6 partial tracts) A) Conventional B) Refinancings C) Non-occupant Loans on Number Average Value Number Average Value Number Average Value
LOANS ORIGINATED 629 $149,160 131 $149,514 200 $132,209 APPLICATIONS APPROVED, NOT ACCEPTED 143 $175,311 38 $158,472 51 $166,167 APPLICATIONS DENIED 20 $177,092 2 $194,120 11 $149,855 APPLICATIONS WITHDRAWN 38 $161,862 12 $142,078 9 $153,800 FILES CLOSED FOR INCOMPLETENESS 1 $46,840 0 $0 1 $46,840
Aggregated Statistics For Year 2003(Based on 2 full and 6 partial tracts) A) Conventional B) Refinancings C) Non-occupant Loans on Number Average Value Number Average Value Number Average Value
LOANS ORIGINATED 503 $130,383 235 $132,238 125 $122,264 APPLICATIONS APPROVED, NOT ACCEPTED 112 $154,349 71 $138,969 26 $179,628 APPLICATIONS DENIED 16 $139,801 6 $134,188 7 $82,660 APPLICATIONS WITHDRAWN 26 $137,957 15 $144,886 6 $158,713 FILES CLOSED FOR INCOMPLETENESS 0 $0 1 $329,350 0 $0
Aggregated Statistics For Year 2002(Based on 2 partial tracts) A) Conventional B) Refinancings C) Non-occupant Loans on Number Average Value Number Average Value Number Average Value
LOANS ORIGINATED 37 $84,741 12 $86,690 15 $66,923 APPLICATIONS APPROVED, NOT ACCEPTED 5 $106,370 9 $84,594 2 $52,300 APPLICATIONS DENIED 1 $103,040 0 $0 1 $33,830 APPLICATIONS WITHDRAWN 2 $81,180 2 $100,435 2 $54,900 FILES CLOSED FOR INCOMPLETENESS 0 $0 0 $0 0 $0
Aggregated Statistics For Year 2001(Based on 2 partial tracts) A) Conventional B) Refinancings C) Non-occupant Loans on Number Average Value Number Average Value Number Average Value
LOANS ORIGINATED 28 $79,584 10 $87,687 6 $74,417 APPLICATIONS APPROVED, NOT ACCEPTED 2 $79,100 0 $0 1 $27,580 APPLICATIONS DENIED 1 $84,300 0 $0 0 $0 APPLICATIONS WITHDRAWN 1 $57,240 1 $115,530 0 $0 FILES CLOSED FOR INCOMPLETENESS 0 $0 0 $0 0 $0
Aggregated Statistics For Year 2000(Based on 2 partial tracts) A) Conventional B) Refinancings C) Non-occupant Loans on Number Average Value Number Average Value Number Average Value
LOANS ORIGINATED 20 $68,510 3 $58,807 6 $62,102 APPLICATIONS APPROVED, NOT ACCEPTED 3 $90,550 0 $0 0 $0 APPLICATIONS DENIED 1 $93,670 0 $0 0 $0 APPLICATIONS WITHDRAWN 0 $0 0 $0 0 $0 FILES CLOSED FOR INCOMPLETENESS 0 $0 0 $0 0 $0
Aggregated Statistics For Year 1999(Based on 1 full and 3 partial tracts) A) Conventional B) Refinancings C) Non-occupant Loans on Number Average Value Number Average Value Number Average Value
LOANS ORIGINATED 90 $130,306 17 $99,948 14 $87,181 APPLICATIONS APPROVED, NOT ACCEPTED 10 $165,194 3 $173,820 1 $48,840 APPLICATIONS DENIED 10 $153,319 3 $103,963 1 $134,330 APPLICATIONS WITHDRAWN 4 $188,542 3 $92,297 1 $146,080 FILES CLOSED FOR INCOMPLETENESS 1 $310,550 0 $0 0 $0
Detailed PMIC statistics for the following Tracts:
0027.01
,
0027.11 ,
0027.12 ,
0027.13
2005 - 2018 National Fire Incident Reporting System (NFIRS) incidents See full 2006 National Fire Incident Reporting System statistics for zip code 34286, Florida
Most common first names in zip code 34286 among deceased individuals Name Count Lived (average)
John 19 77.5 years Robert 19 75.2 years James 16 74.5 years William 15 71.0 years George 11 78.5 years Mary 10 77.0 years Charles 10 74.3 years Richard 10 73.2 years Helen 9 79.5 years David 9 66.1 years
Most common last names in zip code 34286 among deceased individuals Last name Count Lived (average)
Brown 7 72.0 years Davis 5 70.6 years Miller 5 67.8 years Murray 4 80.5 years Taylor 4 65.0 years Scott 4 75.0 years Williams 4 73.5 years Wilson 4 75.5 years Jones 3 67.6 years Ellis 3 72.7 years
Businesses in zip code 34286


 Nearest zip codes: 34289, 34291, 34287, 34288, 33954, 33953.


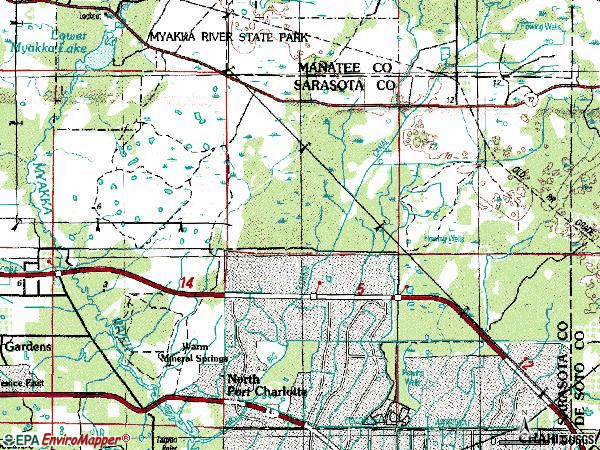

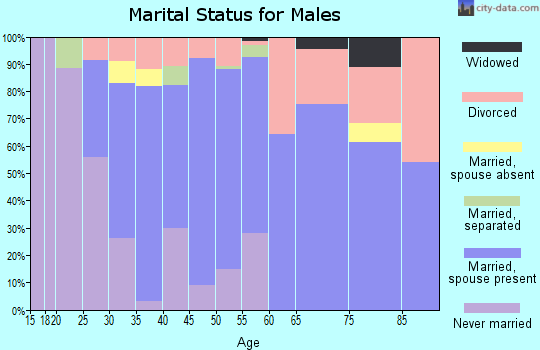


 According to the data from the years 2005 - 2018 the average number of fires per year is 135. The highest number of fires - 365 took place in 2006, and the least - 52 in 2017. The data has a dropping trend.
 When looking into fire subcategories, the most reports belonged to: Outside Fires (71.0%), and Structure Fires (12.4%).