Races in Hershey, Pennsylvania (PA) Detailed Stats
Data:
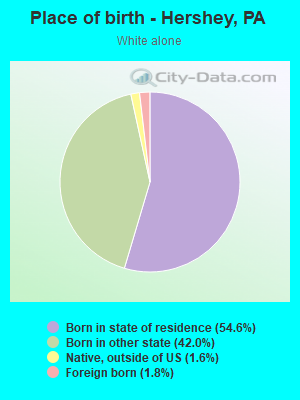
Races - White alone (%)
Races - White alone (% change since 2000)
Races - Black alone (%)
Races - Black alone (% change since 2000)
Races - American Indian alone (%)
Races - American Indian alone (% change since 2000)
Races - Asian alone (%)
Races - Asian alone (% change since 2000)
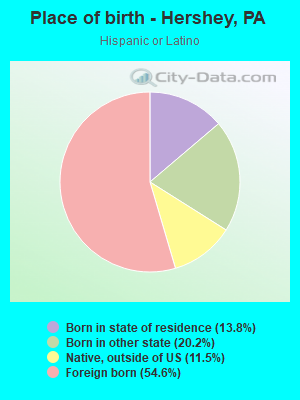
Races - Hispanic (%)
Races - Hispanic (% change since 2000)
Races - Native Hawaiian and Other Pacific Islander alone (%)
Races - Native Hawaiian and Other Pacific Islander alone (% change since 2000)
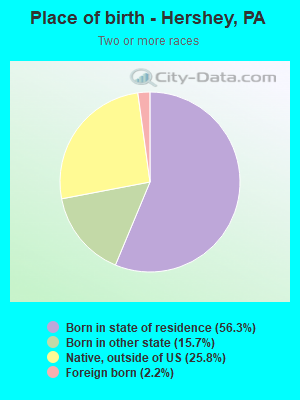
Races - Two or more races(%)
Races - Two or more races(% change since 2000)
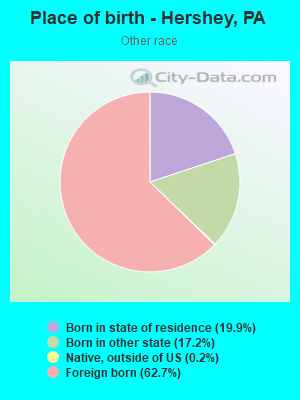
Races - Other race alone (%)
Races - Other race alone (% change since 2000)
Racial diversity
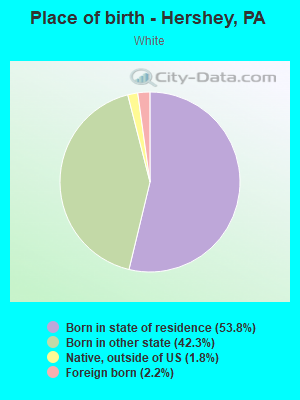
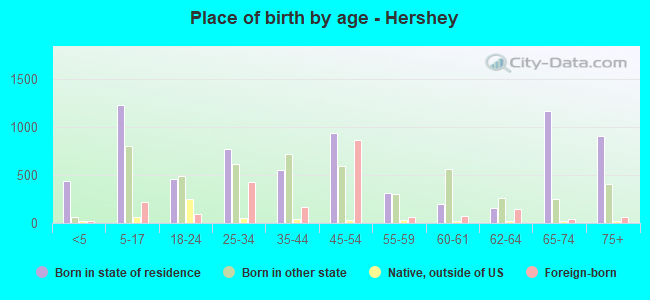
Place of birth - Born in state of residence (%)
Place of birth - Born in state of residence (%) - White
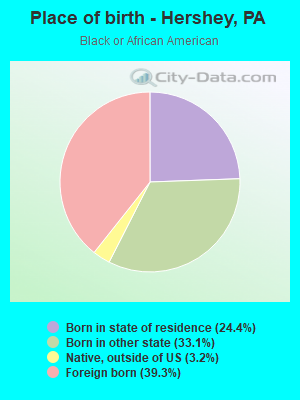
Place of birth - Born in state of residence (%) - Black or African American
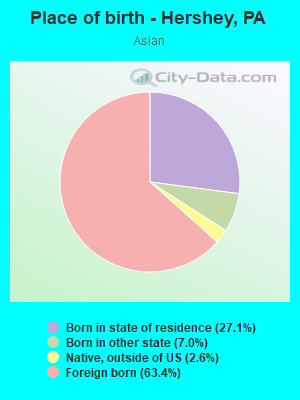
Place of birth - Born in state of residence (%) - Asian
Place of birth - Born in state of residence (%) - Hispanic or Latino
Place of birth - Born in state of residence (%) - American Indian and Alaska Native
Place of birth - Born in state of residence (%) - Multirace
Place of birth - Born in state of residence (%) - Other Race
Place of birth - Born in other state (%)
Place of birth - Born in other state (%) - White
Place of birth - Born in other state (%) - Black or African American
Place of birth - Born in other state (%) - Asian
Place of birth - Born in other state (%) - Hispanic or Latino
Place of birth - Born in other state (%) - American Indian and Alaska Native
Place of birth - Born in other state (%) - Multirace
Place of birth - Born in other state (%) - Other Race
Place of birth - Native, outside of US (%)
Place of birth - Native, outside of US (%) - White
Place of birth - Native, outside of US (%) - Black or African American
Place of birth - Native, outside of US (%) - Asian
Place of birth - Native, outside of US (%) - Hispanic or Latino
Place of birth - Native, outside of US (%) - American Indian and Alaska Native
Place of birth - Native, outside of US (%) - Multirace
Place of birth - Native, outside of US (%) - Other Race
Place of birth - Foreign born (%)
Place of birth - Foreign born (%) - White
Place of birth - Foreign born (%) - Black or African American
Place of birth - Foreign born (%) - Asian
Place of birth - Foreign born (%) - Hispanic or Latino
Place of birth - Foreign born (%) - American Indian and Alaska Native
Place of birth - Foreign born (%) - Multirace
Place of birth - Foreign born (%) - Other Race
Residents speaking English at home (%)
Residents speaking English at home - Born in the United States (%)
Residents speaking English at home - Native, born elsewhere (%)
Residents speaking English at home - Foreign born (%)
Residents speaking Spanish at home (%)
Residents speaking Spanish at home - Born in the United States (%)
Residents speaking Spanish at home - Native, born elsewhere (%)
Residents speaking Spanish at home - Foreign born (%)
Residents speaking other language at home (%)
Residents speaking other language at home - Born in the United States (%)
Residents speaking other language at home - Native, born elsewhere (%)
Residents speaking other language at home - Foreign born (%)
Marital status - Never married (%)
Marital status - Now married (%)
Marital status - Separated (%)
Marital status - Widowed (%)
Marital status - Divorced (%)
Ancestries Reported - Arab (%)
Ancestries Reported - Czech (%)
Ancestries Reported - Danish (%)
Ancestries Reported - Dutch (%)
Ancestries Reported - English (%)
Ancestries Reported - French (%)
Ancestries Reported - French Canadian (%)
Ancestries Reported - German (%)
Ancestries Reported - Greek (%)
Ancestries Reported - Hungarian (%)
Ancestries Reported - Irish (%)
Ancestries Reported - Italian (%)
Ancestries Reported - Lithuanian (%)
Ancestries Reported - Norwegian (%)
Ancestries Reported - Polish (%)
Ancestries Reported - Portuguese (%)
Ancestries Reported - Russian (%)
Ancestries Reported - Scotch-Irish (%)
Ancestries Reported - Scottish (%)
Ancestries Reported - Slovak (%)
Ancestries Reported - Subsaharan African (%)
Ancestries Reported - Swedish (%)
Ancestries Reported - Swiss (%)
Ancestries Reported - Ukrainian (%)
Ancestries Reported - United States (%)
Ancestries Reported - Welsh (%)
Ancestries Reported - West Indian (%)
Ancestries Reported - Other (%)
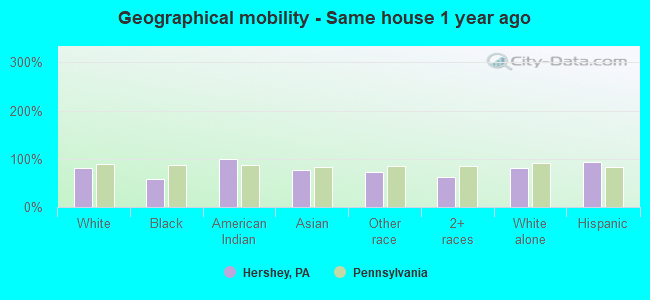
Geographical mobility - Same house 1 year ago (%)
Geographical mobility - Same house 1 year ago (%) - White
Geographical mobility - Same house 1 year ago (%) - Black or African American
Geographical mobility - Same house 1 year ago (%) - Asian
Geographical mobility - Same house 1 year ago (%) - Hispanic or Latino
Geographical mobility - Same house 1 year ago (%) - American Indian and Alaska Native
Geographical mobility - Same house 1 year ago (%) - Multirace
Geographical mobility - Same house 1 year ago (%) - Other Race
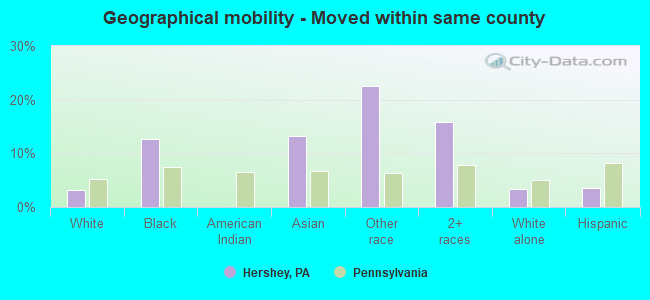
Geographical mobility - Moved within same county (%)
Geographical mobility - Moved within same county (%) - White
Geographical mobility - Moved within same county (%) - Black or African American
Geographical mobility - Moved within same county (%) - Asian
Geographical mobility - Moved within same county (%) - Hispanic or Latino
Geographical mobility - Moved within same county (%) - American Indian and Alaska Native
Geographical mobility - Moved within same county (%) - Multirace
Geographical mobility - Moved within same county (%) - Other Race
Geographical mobility - Moved from different county within same state (%)
Geographical mobility - Moved from different county within same state (%) - White
Geographical mobility - Moved from different county within same state (%) - Black or African American
Geographical mobility - Moved from different county within same state (%) - Asian
Geographical mobility - Moved from different county within same state (%) - Hispanic or Latino
Geographical mobility - Moved from different county within same state (%) - American Indian and Alaska Native
Geographical mobility - Moved from different county within same state (%) - Multirace
Geographical mobility - Moved from different county within same state (%) - Other Race
Geographical mobility - Moved from different state (%)
Geographical mobility - Moved from different state (%) - White
Geographical mobility - Moved from different state (%) - Black or African American
Geographical mobility - Moved from different state (%) - Asian
Geographical mobility - Moved from different state (%) - Hispanic or Latino
Geographical mobility - Moved from different state (%) - American Indian and Alaska Native
Geographical mobility - Moved from different state (%) - Multirace
Geographical mobility - Moved from different state (%) - Other Race
Geographical mobility - Moved from abroad (%)
Geographical mobility - Moved from abroad (%) - White
Geographical mobility - Moved from abroad (%) - Black or African American
Geographical mobility - Moved from abroad (%) - Asian
Geographical mobility - Moved from abroad (%) - Hispanic or Latino
Geographical mobility - Moved from abroad (%) - American Indian and Alaska Native
Geographical mobility - Moved from abroad (%) - Multirace
Geographical mobility - Moved from abroad (%) - Other Race
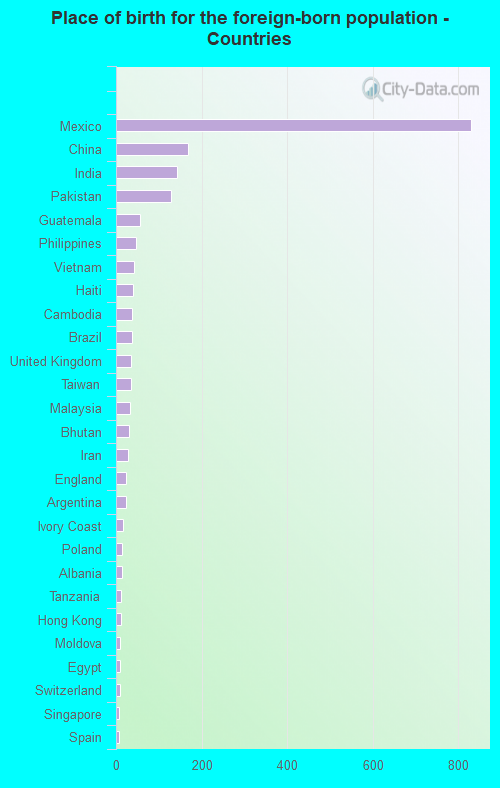
Place of birth for the foreign-born population - Ireland (%)
Place of birth for the foreign-born population - Denmark (%)
Place of birth for the foreign-born population - Norway (%)
Place of birth for the foreign-born population - Sweden (%)
Place of birth for the foreign-born population - United Kingdom (%)
Place of birth for the foreign-born population - England (%)
Place of birth for the foreign-born population - Scotland (%)
Place of birth for the foreign-born population - Other Northern Europe (%)
Place of birth for the foreign-born population - Austria (%)
Place of birth for the foreign-born population - Belgium (%)
Place of birth for the foreign-born population - France (%)
Place of birth for the foreign-born population - Germany (%)
Place of birth for the foreign-born population - Netherlands (%)
Place of birth for the foreign-born population - Switzerland (%)
Place of birth for the foreign-born population - Other Western Europe (%)
Place of birth for the foreign-born population - Greece (%)
Place of birth for the foreign-born population - Italy (%)
Place of birth for the foreign-born population - Portugal (%)
Place of birth for the foreign-born population - Spain (%)
Place of birth for the foreign-born population - Other Southern Europe (%)
Place of birth for the foreign-born population - Albania (%)
Place of birth for the foreign-born population - Belarus (%)
Place of birth for the foreign-born population - Bosnia and Herzegovina (%)
Place of birth for the foreign-born population - Bulgaria (%)
Place of birth for the foreign-born population - Croatia (%)
Place of birth for the foreign-born population - Czechoslovakia (%)
Place of birth for the foreign-born population - Hungary (%)
Place of birth for the foreign-born population - Latvia (%)
Place of birth for the foreign-born population - Lithuania (%)
Place of birth for the foreign-born population - North Macedonia (Macedonia) (%)
Place of birth for the foreign-born population - Moldova (%)
Place of birth for the foreign-born population - Poland (%)
Place of birth for the foreign-born population - Romania (%)
Place of birth for the foreign-born population - Russia (%)
Place of birth for the foreign-born population - Serbia (%)
Place of birth for the foreign-born population - Ukraine (%)
Place of birth for the foreign-born population - Other Eastern Europe (%)
Place of birth for the foreign-born population - China (%)
Place of birth for the foreign-born population - Hong Kong (%)
Place of birth for the foreign-born population - Taiwan (%)
Place of birth for the foreign-born population - Japan (%)
Place of birth for the foreign-born population - Korea (%)
Place of birth for the foreign-born population - Other Eastern Asia (%)
Place of birth for the foreign-born population - Afghanistan (%)
Place of birth for the foreign-born population - Bangladesh (%)
Place of birth for the foreign-born population - India (%)
Place of birth for the foreign-born population - Iran (%)
Place of birth for the foreign-born population - Kazakhstan (%)
Place of birth for the foreign-born population - Nepal (%)
Place of birth for the foreign-born population - Pakistan (%)
Place of birth for the foreign-born population - Sri Lanka (%)
Place of birth for the foreign-born population - Uzbekistan (%)
Place of birth for the foreign-born population - Other South Central Asia (%)
Place of birth for the foreign-born population - Burma (%)
Place of birth for the foreign-born population - Cambodia (%)
Place of birth for the foreign-born population - Indonesia (%)
Place of birth for the foreign-born population - Laos (%)
Place of birth for the foreign-born population - Malaysia (%)
Place of birth for the foreign-born population - Philippines (%)
Place of birth for the foreign-born population - Singapore (%)
Place of birth for the foreign-born population - Thailand (%)
Place of birth for the foreign-born population - Vietnam (%)
Place of birth for the foreign-born population - Other South Eastern Asia (%)
Place of birth for the foreign-born population - Armenia (%)
Place of birth for the foreign-born population - Iraq (%)
Place of birth for the foreign-born population - Israel (%)
Place of birth for the foreign-born population - Jordan (%)
Place of birth for the foreign-born population - Kuwait (%)
Place of birth for the foreign-born population - Lebanon (%)
Place of birth for the foreign-born population - Saudi Arabia (%)
Place of birth for the foreign-born population - Syria (%)
Place of birth for the foreign-born population - Turkey (%)
Place of birth for the foreign-born population - Yemen (%)
Place of birth for the foreign-born population - Other Western Asia (%)
Place of birth for the foreign-born population - Eritrea (%)
Place of birth for the foreign-born population - Ethiopia (%)
Place of birth for the foreign-born population - Kenya (%)
Place of birth for the foreign-born population - Somalia (%)
Place of birth for the foreign-born population - Uganda (%)
Place of birth for the foreign-born population - Zimbabwe (%)
Place of birth for the foreign-born population - Other Eastern Africa (%)
Place of birth for the foreign-born population - Cameroon (%)
Place of birth for the foreign-born population - Congo (%)
Place of birth for the foreign-born population - Democratic Republic of Congo (Zaire) (%)
Place of birth for the foreign-born population - Other Middle Africa (%)
Place of birth for the foreign-born population - Egypt (%)
Place of birth for the foreign-born population - Morocco (%)
Place of birth for the foreign-born population - Sudan (%)
Place of birth for the foreign-born population - Other Northern Africa (%)
Place of birth for the foreign-born population - South Africa (%)
Place of birth for the foreign-born population - Other Southern Africa (%)
Place of birth for the foreign-born population - Cabo Verde (%)
Place of birth for the foreign-born population - Ghana (%)
Place of birth for the foreign-born population - Liberia (%)
Place of birth for the foreign-born population - Nigeria (%)
Place of birth for the foreign-born population - Senegal (%)
Place of birth for the foreign-born population - Sierra Leone (%)
Place of birth for the foreign-born population - Other Western Africa (%)
Place of birth for the foreign-born population - Australia (%)
Place of birth for the foreign-born population - New Zealand (%)
Place of birth for the foreign-born population - Fiji (%)
Place of birth for the foreign-born population - Micronesia (%)
Place of birth for the foreign-born population - Bahamas (%)
Place of birth for the foreign-born population - Barbados (%)
Place of birth for the foreign-born population - Cuba (%)
Place of birth for the foreign-born population - Dominica (%)
Place of birth for the foreign-born population - Dominican Republic (%)
Place of birth for the foreign-born population - Grenada (%)
Place of birth for the foreign-born population - Haiti (%)
Place of birth for the foreign-born population - Jamaica (%)
Place of birth for the foreign-born population - St. Vincent and the Grenadines (%)
Place of birth for the foreign-born population - Trinidad and Tobago (%)
Place of birth for the foreign-born population - West Indies (%)
Place of birth for the foreign-born population - Other Caribbean (%)
Place of birth for the foreign-born population - Belize (%)
Place of birth for the foreign-born population - Costa Rica (%)
Place of birth for the foreign-born population - El Salvador (%)
Place of birth for the foreign-born population - Guatemala (%)
Place of birth for the foreign-born population - Honduras (%)
Place of birth for the foreign-born population - Mexico (%)
Place of birth for the foreign-born population - Nicaragua (%)
Place of birth for the foreign-born population - Panama (%)
Place of birth for the foreign-born population - Other Central America (%)
Place of birth for the foreign-born population - Argentina (%)
Place of birth for the foreign-born population - Bolivia (%)
Place of birth for the foreign-born population - Brazil (%)
Place of birth for the foreign-born population - Chile (%)
Place of birth for the foreign-born population - Colombia (%)
Place of birth for the foreign-born population - Ecuador (%)
Place of birth for the foreign-born population - Guyana (%)
Place of birth for the foreign-born population - Peru (%)
Place of birth for the foreign-born population - Uruguay (%)
Place of birth for the foreign-born population - Venezuela (%)
Place of birth for the foreign-born population - Other South America (%)
Place of birth for the foreign-born population - Canada (%)
Place of birth for the foreign-born population - Other Northern America (%)
Place of birth for the foreign-born population - Other (%)
Latest news about races in Hershey, PA collected exclusively by city-data.com from local newspapers, TV, and radio stations
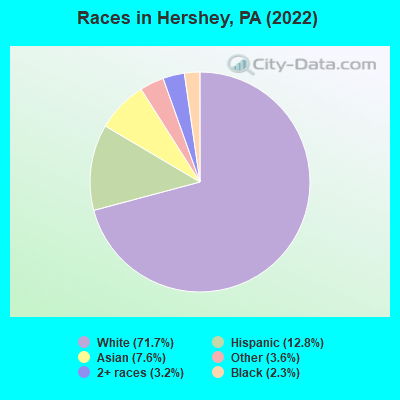
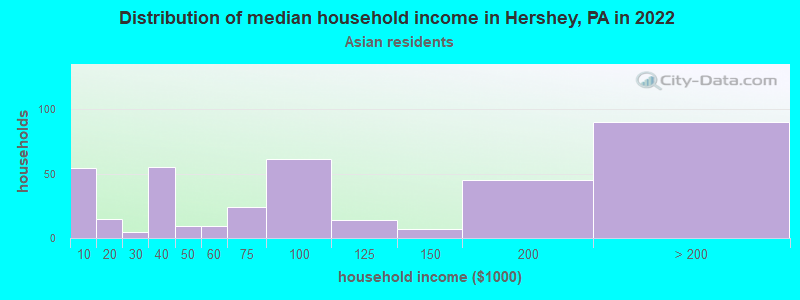
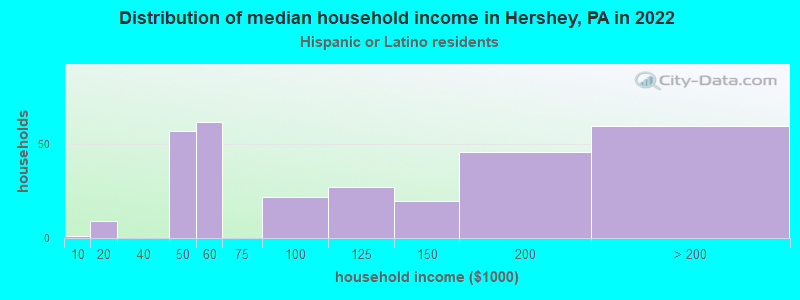
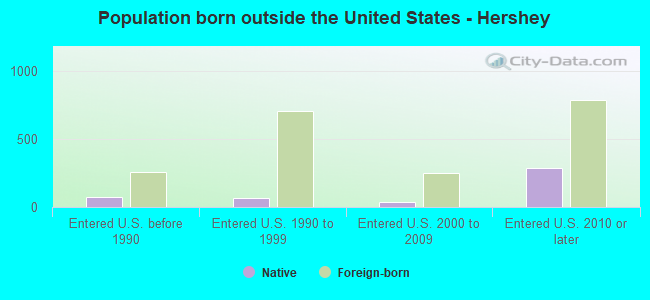
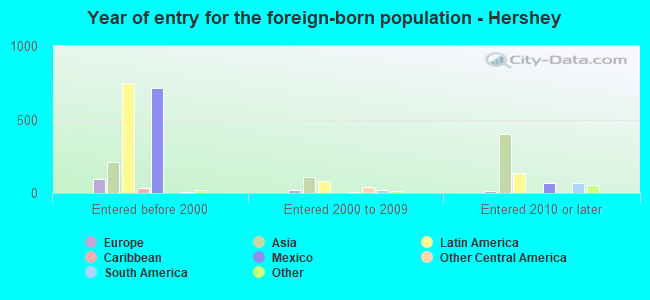
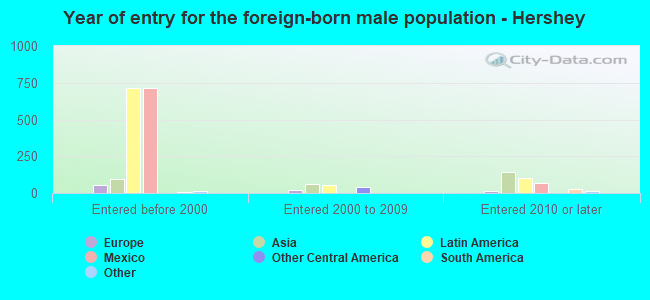
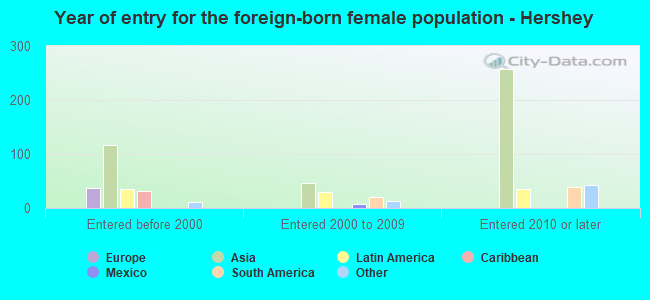
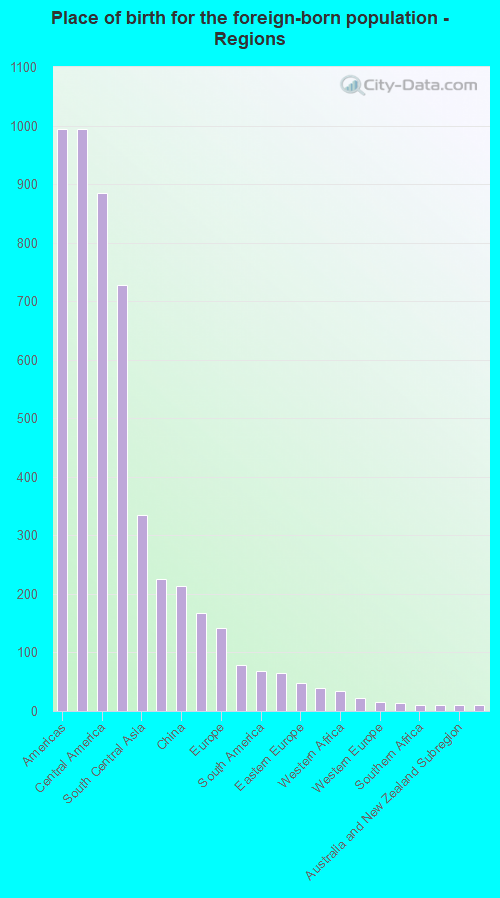
According to 2022 data, the most numerous races in Hershey, PA are White alone (10,621 residents), Black alone (347 residents), and Hispanic (1,893 residents). 80.0% of Hershey residents speak English at home. 13.2% of Hershey, PA residents are foreign-born (6.5% born in Latin America, 4.8% born in Asia), which is 47.0% greater than the foreign-born rate of 7.0% across the entire state of Pennsylvania.
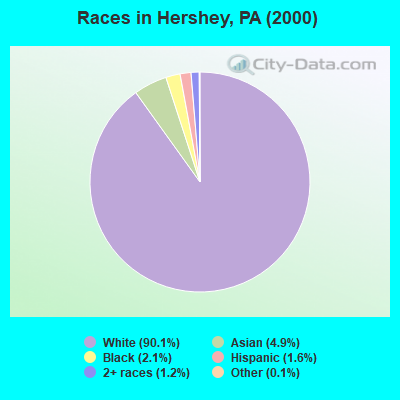
Race distribution in Hershey
2000 2022
10,322,455 84.1% White alone 1,202,437 9.8% Black alone 394,088 3.2% Hispanic 218,296 1.8% Asian alone 113,097 0.9% Two or more races 13,086 0.1% Other race alone 14,904 0.1% American Indian alone 2,691 0.02% Native Hawaiian and Other
9,487,228 73.1% White alone 1,311,581 10.1% Black alone 1,115,997 8.6% Hispanic 493,942 3.8% Two or more races 487,124 3.8% Asian alone 63,582 0.5% Other race alone 10,130 0.08% American Indian alone 2,424 0.02% Native Hawaiian and Other
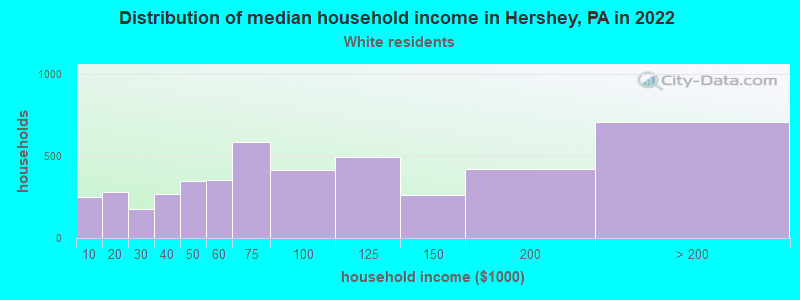
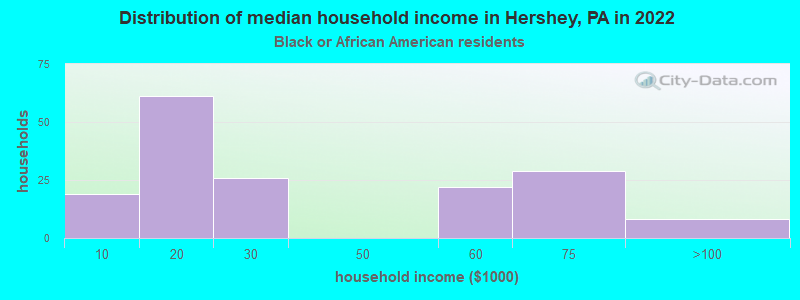
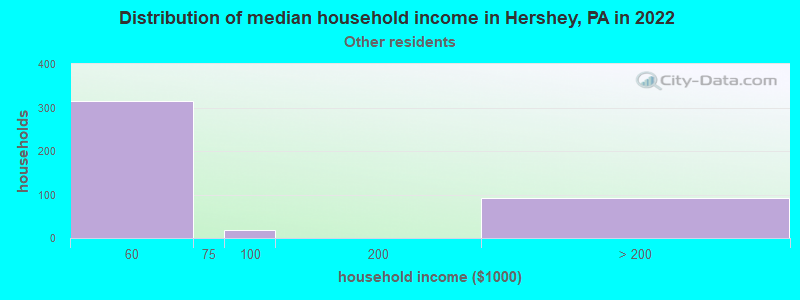
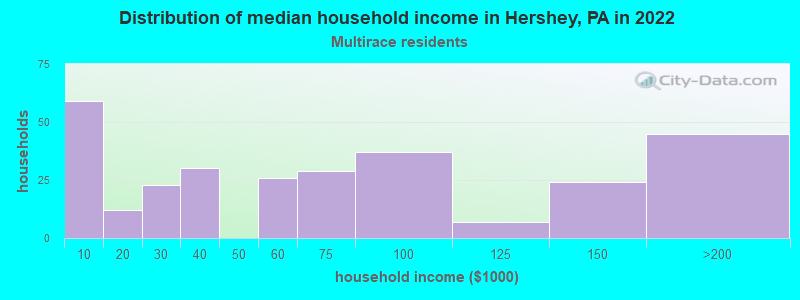
Income and house value in Hershey Median household income in 2022 $81,797 White non-Hispanic householders$24,844 Black householders$97,611 Asian householders$53,708 Two or more races householders$145,458 Hispanic or Latino race householdersMedian 2022 house value $349,031 White Non-Hispanic householders $340,214 Asian householders$310,827 Two or more races householders
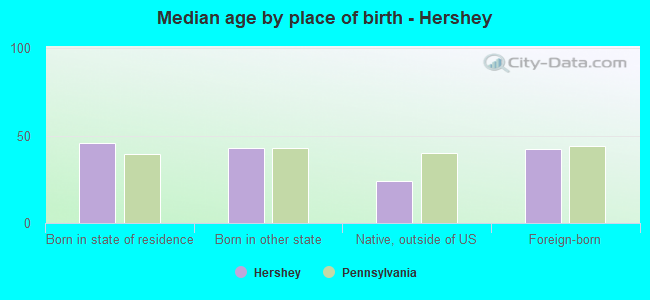
Median age by race in Hershey
46.5 Median age for White residents37.7 51.7 34.4 Median age for Black or African American residents33.6 34.6 -465,804,066.1 Median age for American Indian / Alaska Native residents-964,080,458.8 -577,519,379.3 32.1 Median age for Asian residents40.4 30.5 -680,432,644.4 Median age for Native Hawaiian / Pacific Islander residents-649,523,808.9 -747,474,746.7 39.0 Median age for Other race residents45.9 52.8 25.2 Median age for Two or more races residents36.2 19.9 46.3 Median age for White alone residents37.1 51.6 52.1 Median age for Hispanic or Latino residents53.5 33.0
Owner/renter occupied households by race in Hershey
House owners and renters - White residents 2,594 56.3% Owner occupied2,012 43.7% Renter occupiedHouse owners and renters - Black or African American residents 19 10.9% Owner occupied156 89.1% Renter occupiedHouse owners and renters - Asian residents 202 42.2% Owner occupied276 57.8% Renter occupiedHouse owners and renters - Other race residents 156 83.9% Owner occupied30 16.1% Renter occupiedHouse owners and renters - Two or more races residents 74 24.5% Owner occupied228 75.5% Renter occupiedHouse owners and renters - White alone residents 2,595 56.6% Owner occupied1,991 43.4% Renter occupiedHouse owners and renters - Hispanic or Latino residents 106 42.1% Owner occupied145 57.9% Renter occupied
Language usage in Hershey
English speakers - Total 80.0% of residents of Hershey speak English at home.
12.9% of residents speak Spanish at home 831 45.2% Speak English very well1,006 54.8% Speak English less than very well9.1% of residents speak other language at home 1,090 84.2% Speak English very well204 15.8% Speak English less than very well
English speakers - Born in the United States 90.4% of residents of Hershey speak English at home.
7.2% of residents speak Spanish at home 379 100.0% Speak English very well2.8% of residents speak other language at home 138 95.2% Speak English very well7 4.8% Speak English less than very well
English speakers - Native, born elsewhere 13.9% of residents of Hershey speak English at home.
55.2% of residents speak Spanish at home 188 76.4% Speak English very well58 23.6% Speak English less than very well19.1% of residents speak other language at home 85 100.0% Speak English very well
English speakers - Foreign-born 20.2% of residents of Hershey speak English at home.
45.3% of residents speak Spanish at home 58 5.6% Speak English very well985 94.4% Speak English less than very well39.1% of residents speak other language at home 705 78.3% Speak English very well195 21.7% Speak English less than very well
White (Caucasian) - Speak only English Native:
96.2% (9,796)Foreign-born:
78.5% (187)
White (Caucasian) - Speak another language Native:
3.8% (389)Foreign-born:
39.8% (95)
Black or African American - Speak only English Native:
100.0% (223)Foreign-born:
15.3% (23)
Asian - Speak only English Native:
41.9% (157)Foreign-born:
14.5% (106)
Asian - Speak another language Native:
52.1% (196)Foreign-born:
85.4% (624)
Other race - Speak another language Native:
35.8% (268)Foreign-born:
87.4% (1,357)
Two or more races - Speak only English Native:
56.4% (539)Foreign-born:
79.2% (18)
White alone - Speak only English Native:
96.8% (9,680)Foreign-born:
68.3% (135)
White alone - Speak another language Native:
3.2% (323)Foreign-born:
41.7% (83)
Hispanic or Latino - Speak only English Native:
32.9% (294)Foreign-born:
6.1% (68)
Hispanic or Latino - Speak another language Native:
71.5% (639)Foreign-born:
93.9% (1,054)
Foreign-born residents in Hershey 1,956 residents are foreign born (6.5% Latin America , 4.8% Asia ).
This city:
13.2%Pennsylvania:
7.3%
Marital status for residents in Hershey Marital status - White (Caucasian) population 15 years and over
Males 34.5% Never married55.4% Now married1.1% Separated4.5% Widowed4.5% DivorcedFemales 21.9% Never married55.4% Now married2.6% Separated8.9% Widowed11.3% DivorcedWomen who gave birth in the past 12 months Now married:
84.1% (65)Unmarried:
15.9% (12)
Women who did not give birth in the past 12 months Now married:
47.5% (1,046)Unmarried:
52.5% (1,157)
Marital status - Black or African American population 15 years and over
Males 57.3% Never married14.5% Now married0.0% Separated28.2% Widowed0.0% DivorcedFemales 63.7% Never married6.6% Now married11.1% Separated0.0% Widowed18.6% DivorcedWomen who did not give birth in the past 12 months Now married:
11.3% (14)Unmarried:
88.7% (113)
Marital status - Asian population 15 years and over
Males 23.8% Never married76.2% Now married0.0% Separated0.0% Widowed0.0% DivorcedFemales 43.0% Never married51.9% Now married0.0% Separated1.0% Widowed4.1% DivorcedWomen who gave birth in the past 12 months Now married:
0.0% (0)Unmarried:
100.0% (45)
Women who did not give birth in the past 12 months Now married:
38.1% (143)Unmarried:
61.9% (232)
Marital status - Other race population 15 years and over
Males 78.1% Never married21.8% Now married0.0% Separated0.0% Widowed0.1% DivorcedFemales 11.8% Never married88.2% Now married0.0% Separated0.0% Widowed0.0% DivorcedWomen who did not give birth in the past 12 months Now married:
67.0% (81)Unmarried:
33.0% (40)
Marital status - Two or more races population 15 years and over
Males 68.4% Never married31.6% Now married0.0% Separated0.0% Widowed0.0% DivorcedFemales 52.3% Never married34.8% Now married0.0% Separated8.4% Widowed4.5% DivorcedWomen who gave birth in the past 12 months Now married:
100.0% (6)Unmarried:
0.0% (0)
Women who did not give birth in the past 12 months Now married:
16.0% (46)Unmarried:
84.0% (239)
Marital status - White alone, not Hispanic / Latino population 15 years and over
Males 33.8% Never married56.1% Now married1.1% Separated4.5% Widowed4.6% DivorcedFemales 21.2% Never married56.0% Now married2.1% Separated9.0% Widowed11.6% DivorcedWomen who gave birth in the past 12 months Now married:
84.1% (68)Unmarried:
15.9% (13)
Women who did not give birth in the past 12 months Now married:
47.4% (1,020)Unmarried:
52.6% (1,129)
Marital status - Hispanic or Latino population 15 years and over
Males 90.8% Never married8.6% Now married0.0% Separated0.5% Widowed0.1% DivorcedFemales 50.4% Never married38.8% Now married6.0% Separated3.2% Widowed1.5% DivorcedWomen who did not give birth in the past 12 months Now married:
40.7% (155)Unmarried:
59.3% (226)
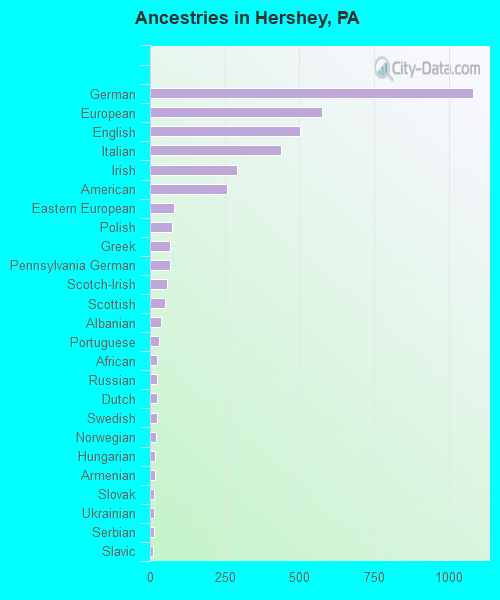
Ancestries in Hershey
1,081 17.5% German575 9.3% European503 8.1% English438 7.1% Italian290 4.7% Irish258 4.2% American81 1.3% Eastern European74 1.2% Polish67 1.1% Greek66 1.1% Pennsylvania German56 0.9% Scotch-Irish51 0.8% Scottish36 0.6% Albanian31 0.5% Portuguese25 0.4% African23 0.4% Russian22 0.4% Dutch22 0.4% Swedish19 0.3% Norwegian17 0.3% Hungarian16 0.3% Armenian15 0.2% Slovak13 0.2% Ukrainian12 0.2% Serbian11 0.2% Slavic10 0.2% Egyptian10 0.2% Austrian8 0.1% Swiss7 0.1% Belgian7 0.1% Brazilian5 0.08% Croatian
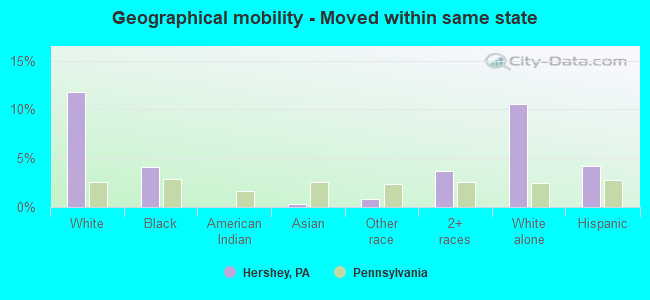
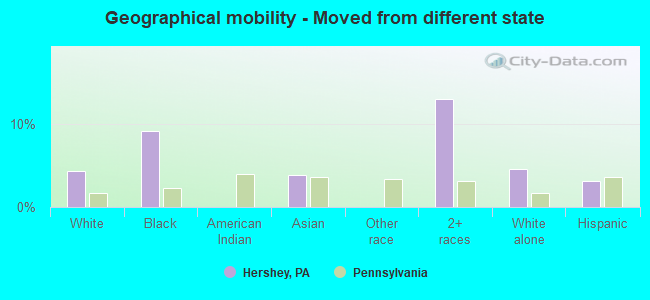
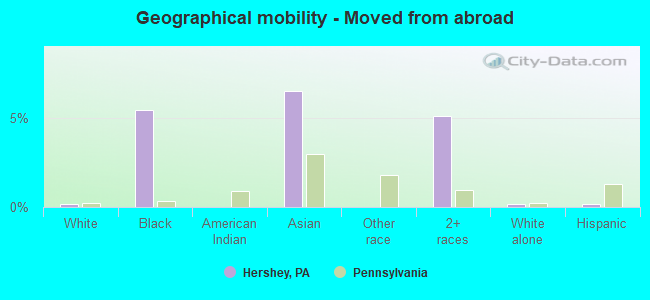
Geographical mobility in Hershey Same house 1 year ago 8,637 80.2% White (Caucasian)190 57.9% Black or African American10 99.6% American Indian / Alaska Native760 76.3% Asian1,273 71.7% Other race639 63.1% Two or more races8,440 80.0% White alone, not Hispanic / Latino1,759 94.1% Hispanic or LatinoMoved within same county 337 3.1% White / Caucasian42 12.7% Black or African American131 13.1% Asian400 22.5% Other race160 15.8% Two or more races352 3.3% White alone, not Hispanic / Latino66 3.5% Hispanic or LatinoMoved within same state 1,271 11.8% White / Caucasian13 4.1% Black or African American3 0.3% Asian15 0.8% Other race37 3.6% Two or more races1,116 10.6% White alone, not Hispanic / Latino78 4.2% Hispanic or LatinoMoved from different state 474 4.4% White / Caucasian30 9.2% Black or African American39 3.9% Asian132 13.1% Two or more races488 4.6% White alone, not Hispanic / Latino59 3.1% Hispanic or LatinoMoved from abroad 18 0.2% White18 5.4% Black or African American65 6.5% Asian51 5.1% Two or more races17 0.2% White alone, not Hispanic / Latino3 0.2% Hispanic or Latino
Children Nativity (place of birth) in Hershey
Children under 6 years - Living with two parents Both parents native 487 100.0% NativeBoth parents foreign-born 37 100.0% NativeOne native, one foreign-born parent 73 100.0% NativeChildren under 6 years - Living with one parent Native parent 71 100.0% NativeForeign-born parent 10 100.0% Foreign-bornChildren 6 to 17 years - Living with two parents Both parents native 1,076 98.7% Native14 1.3% Foreign-bornBoth parents foreign-born 129 77.1% Native38 22.9% Foreign-bornOne native, one foreign-born parent 74 72.2% Native28 27.8% Foreign-bornChildren 6 to 17 years - Living with one parent Native parent 341 98.2% Native6 1.8% Foreign-bornForeign-born parent 185 71.4% Native74 28.6% Foreign-born
Grandparents responsible for own grandchildren in Hershey
Grandparents (30 to 59 years) White / Caucasian 4 45.9% Responsible for grandchildren5 54.1% Not responsible for grandchildrenAsian 8 100.0% Not responsible for grandchildrenWhite alone, not Hispanic / Latino 4 46.2% Responsible for grandchildren5 53.8% Not responsible for grandchildren
Grandparents (60 years and over) White / Caucasian 41 100.0% Not responsible for grandchildrenAsian 21 100.0% Not responsible for grandchildrenWhite alone, not Hispanic / Latino 42 100.0% Not responsible for grandchildren