Estimated zip code population in 2022: 17,000 Zip code population in 2010: 16,972 Zip code population in 2000: 15,069
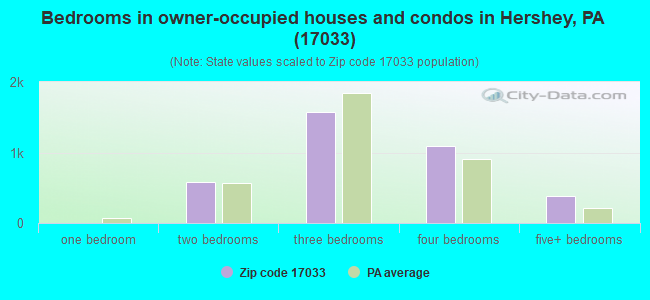
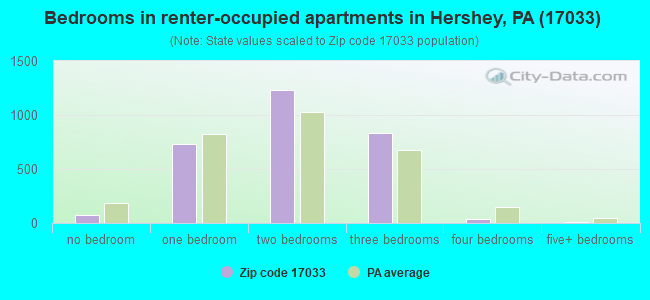
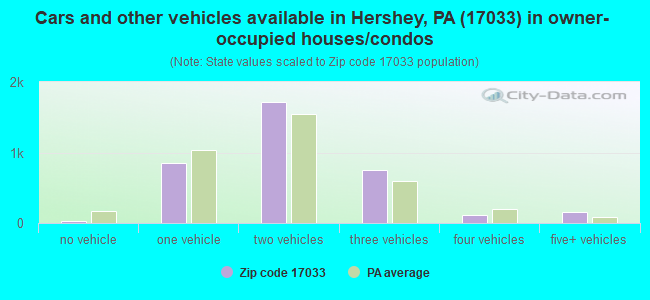
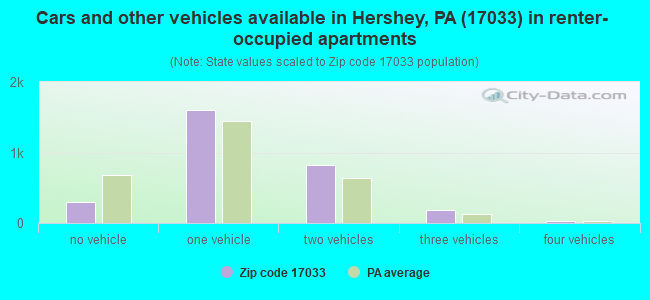
Houses and condos: 6,882 Renter-occupied apartments: 2,927
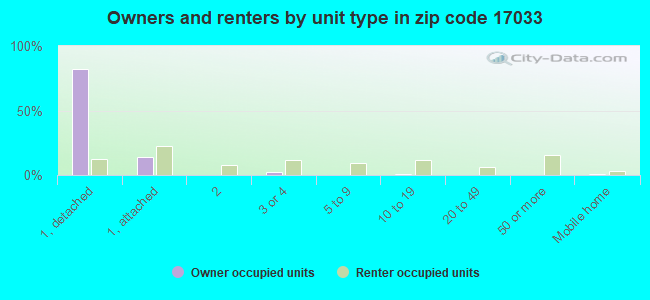
% of renters here:
45%
State:
31%
March 2022 cost of living index in zip code 17033: 98.1 (near average, U.S. average is 100)
Land area: 25.7 sq. mi. Water area: 0.2 sq. mi.
Population density: 661 people per square mile
(low).
OSM Map
General Map
Google Map
MSN Map
OSM Map
General Map
Google Map
MSN Map
OSM Map
General Map
Google Map
MSN Map
OSM Map
General Map
Google Map
MSN Map
Please wait while loading the map...
Real estate property taxes paid for housing units in 2022:
This zip code:
1.2% ($4,226)
Pennsylvania:
1.3% ($3,094)
Median real estate property taxes paid for housing units with mortgages in 2022: $4,474 (1.4%) Median real estate property taxes paid for housing units with no mortgage in 2022: $3,839 (1.0%)
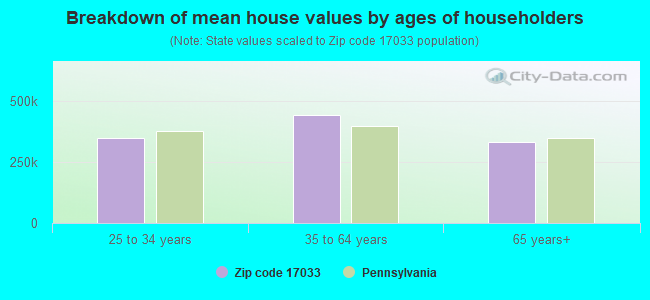
Estimated median house/condo value in 2022: $346,761
17033:
$346,761
Pennsylvania:
$245,500
According to our research of Pennsylvania and other state lists, there were 8 registered sex offenders living in 17033 zip code as of June 04, 2024. The ratio of all residents to sex offenders in zip code 17033 is 2,187 to 1. The ratio of registered sex offenders to all residents in this zip code is much lower than the state average.
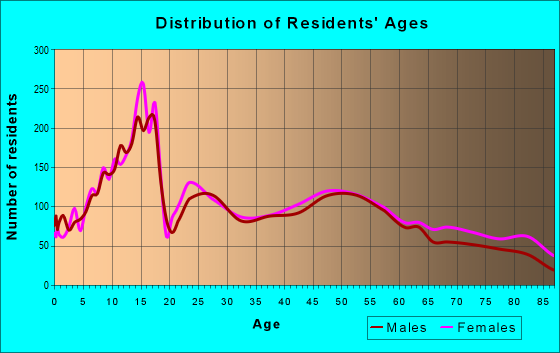
Median resident age:
This zip code:
43.8 years
Pennsylvania median age:
40.9 years
Average household size:
This zip code:
2.3 people
Pennsylvania:
2.4 people
Averages for the 2020 tax year for zip code 17033, filed in 2021:
Average Adjusted Gross Income (AGI) in 2020: $93,150 (Individual Income Tax Returns)
Here:
$93,150
State:
$75,707
Salary/wage: $77,848 (reported on 79.5% of returns)
Here:
$77,848
State:
$62,806
(% of AGI for various income ranges: 1135.5% for AGIs below $25k, 3483.5% for AGIs $25k-50k, 5958.8% for AGIs $50k-75k, 9412.4% for AGIs $75k-100k, 17326.2% for AGIs $100k-200k, 92919.5% for AGIs over 200k)
Taxable interest for individuals: $1,817 (reported on 37.2% of returns)
This zip code:
$1,817
Pennsylvania:
$1,633
(% of AGI for various income ranges: 18.5% for AGIs below $25k, 19.8% for AGIs $25k-50k, 47.9% for AGIs $50k-75k, 97.1% for AGIs $75k-100k, 186.7% for AGIs $100k-200k, 1162.7% for AGIs over 200k)
Ordinary dividends: $8,392 (reported on 30.9% of returns)
Here:
$8,392
State:
$7,382
(% of AGI for various income ranges: 52.1% for AGIs below $25k, 80.4% for AGIs $25k-50k, 170.9% for AGIs $50k-75k, 269.8% for AGIs $75k-100k, 617.8% for AGIs $100k-200k, 5132.3% for AGIs over 200k)
Net capital gain/loss in AGI: +$25,598 (reported on 25.9% of returns)
Here:
+$25,598
State:
+$23,522
(% of AGI for various income ranges: 26.7% for AGIs below $25k, 49.9% for AGIs $25k-50k, 136.9% for AGIs $50k-75k, 244.5% for AGIs $75k-100k, 692.3% for AGIs $100k-200k, 19599.1% for AGIs over 200k)
Profit/loss from business: +$17,958 (reported on 12.5% of returns)
Here:
+$17,958
State:
+$16,274
(% of AGI for various income ranges: 67.9% for AGIs below $25k, 130.6% for AGIs $25k-50k, 114.4% for AGIs $50k-75k, 187.6% for AGIs $75k-100k, 699.7% for AGIs $100k-200k, 3642.7% for AGIs over 200k)
Taxable individual retirement arrangement distribution: $27,350 (reported on 13.1% of returns)
17033:
$27,350
Pennsylvania:
$18,583
(% of AGI for various income ranges: 109.7% for AGIs below $25k, 149.8% for AGIs $25k-50k, 366.3% for AGIs $50k-75k, 496.5% for AGIs $75k-100k, 1321.4% for AGIs $100k-200k, 4434.1% for AGIs over 200k)
Self-employed (Keogh) retirement plans: $20,333 (reported on 0.8% of returns)
17033:
$20,333
Pennsylvania:
$25,407
(% of AGI for various income ranges: 29.0% for AGIs $25k-50k, 391.4% for AGIs over 200k)
Total itemized deductions: $39,365 (reported on 9.6% of returns)
Here:
$39,365
State:
$34,850
(% of AGI for various income ranges: 89.8% for AGIs below $25k, 95.9% for AGIs $25k-50k, 336.0% for AGIs $50k-75k, 404.7% for AGIs $75k-100k, 956.1% for AGIs $100k-200k, 7013.2% for AGIs over 200k)
Charity contributions: $15,633 (reported on 7.9% of returns)
Here:
$15,633
State:
$12,392
(% of AGI for various income ranges: 12.8% for AGIs $25k-50k, 53.2% for AGIs $50k-75k, 58.0% for AGIs $75k-100k, 268.6% for AGIs $100k-200k, 3096.8% for AGIs over 200k)
Taxes paid: $8,016 (reported on 9.6% of returns)
17033:
$8,016
State:
$8,200
(% of AGI for various income ranges: 7.6% for AGIs below $25k, 15.6% for AGIs $25k-50k, 57.1% for AGIs $50k-75k, 88.0% for AGIs $75k-100k, 242.0% for AGIs $100k-200k, 1395.5% for AGIs over 200k)
Earned income credit: $2,016 (reported on 9.1% of returns)
Here:
$2,016
State:
$2,100
(% of AGI for various income ranges: 58.2% for AGIs below $25k, 49.4% for AGIs $25k-50k)
Percentage of individuals using paid preparers for their 2020 taxes: 92.2%
Here:
92%
State:
92%
(% for various income ranges: 90.1% for AGIs below $25k, 93.2% for AGIs $25k-50k, 92.6% for AGIs $50k-75k, 93.6% for AGIs $75k-100k, 92.8% for AGIs $100k-200k, 93.3% for AGIs over 200k)
Averages for the 2012 tax year for zip code 17033, filed in 2013:
Average Adjusted Gross Income (AGI) in 2012: $77,523 (Individual Income Tax Returns)
Here:
$77,523
State:
$61,346
Salary/wage: $65,131 (reported on 80.1% of returns)
Here:
$65,131
State:
$51,902
(% of AGI for various income ranges: 70.0% for AGIs below $25k, 72.7% for AGIs $25k-50k, 73.5% for AGIs $50k-75k, 71.4% for AGIs $75k-100k, 71.9% for AGIs $100k-200k, 60.0% for AGIs over 200k)
Taxable interest for individuals: $1,474 (reported on 43.0% of returns)
This zip code:
$1,474
Pennsylvania:
$1,588
(% of AGI for various income ranges: 1.7% for AGIs below $25k, 0.8% for AGIs $25k-50k, 0.7% for AGIs $50k-75k, 0.6% for AGIs $75k-100k, 0.9% for AGIs $100k-200k, 0.7% for AGIs over 200k)
Ordinary dividends: $6,633 (reported on 32.7% of returns)
Here:
$6,633
State:
$5,827
(% of AGI for various income ranges: 3.5% for AGIs below $25k, 2.2% for AGIs $25k-50k, 1.9% for AGIs $50k-75k, 2.3% for AGIs $75k-100k, 2.6% for AGIs $100k-200k, 3.4% for AGIs over 200k)
Net capital gain/loss in AGI: +$23,142 (reported on 24.4% of returns)
Here:
+$23,142
State:
+$14,495
(% of AGI for various income ranges: 0.1% for AGIs below $25k, 0.3% for AGIs $25k-50k, 0.5% for AGIs $50k-75k, 1.3% for AGIs $75k-100k, 1.9% for AGIs $100k-200k, 16.5% for AGIs over 200k)
Profit/loss from business: +$17,398 (reported on 12.2% of returns)
Here:
+$17,398
State:
+$16,268
(% of AGI for various income ranges: 4.7% for AGIs below $25k, 3.1% for AGIs $25k-50k, 2.2% for AGIs $50k-75k, 1.9% for AGIs $75k-100k, 2.1% for AGIs $100k-200k, 3.2% for AGIs over 200k)
Taxable individual retirement arrangement distribution: $18,783 (reported on 14.8% of returns)
17033:
$18,783
Pennsylvania:
$14,550
(% of AGI for various income ranges: 5.0% for AGIs below $25k, 3.8% for AGIs $25k-50k, 3.7% for AGIs $50k-75k, 4.8% for AGIs $75k-100k, 4.4% for AGIs $100k-200k, 2.5% for AGIs over 200k)
Self-employment retirement plans: $18,771 (reported on 0.9% of returns)
17033:
$18,771
Pennsylvania:
$20,922
Total itemized deductions: $25,886 (16% of AGI, reported on 35.2% of returns)
Here:
$25,886
State:
$23,538
Here:
16.3% of AGI
State:
18.4% of AGI
(% of AGI for various income ranges: 9.8% for AGIs below $25k, 9.6% for AGIs $25k-50k, 10.9% for AGIs $50k-75k, 13.1% for AGIs $75k-100k, 14.3% for AGIs $100k-200k, 10.8% for AGIs over 200k)
Charity contributions: $5,756 (reported on 30.2% of returns)
Here:
$5,756
State:
$4,025
(% of AGI for various income ranges: 0.7% for AGIs below $25k, 1.4% for AGIs $25k-50k, 1.5% for AGIs $50k-75k, 2.1% for AGIs $75k-100k, 2.6% for AGIs $100k-200k, 2.6% for AGIs over 200k)
Taxes paid: $10,872 (reported on 35.0% of returns)
17033:
$10,872
State:
$9,982
(% of AGI for various income ranges: 2.0% for AGIs below $25k, 2.7% for AGIs $25k-50k, 3.6% for AGIs $50k-75k, 4.8% for AGIs $75k-100k, 6.1% for AGIs $100k-200k, 5.5% for AGIs over 200k)
Earned income credit: $1,941 (reported on 8.7% of returns)
Here:
$1,941
State:
$2,106
(% of AGI for various income ranges: 3.4% for AGIs below $25k, 0.6% for AGIs $25k-50k)
Percentage of individuals using paid preparers for their 2012 taxes: 47.6%
Here:
48%
State:
53%
(% for various income ranges: 38.8% for AGIs below $25k, 46.1% for AGIs $25k-50k, 49.1% for AGIs $50k-75k, 50.7% for AGIs $75k-100k, 56.3% for AGIs $100k-200k, 74.5% for AGIs over 200k)
Averages for the 2004 tax year for zip code 17033, filed in 2005:
Average Adjusted Gross Income (AGI) in 2004: $56,727 (Individual Income Tax Returns)
Here:
$56,727
State:
$48,049
Salary/wage: $51,389 (reported on 77.5% of returns)
Here:
$51,389
State:
$42,646
(% of AGI for various income ranges: 97.3% for AGIs below $10k, 63.9% for AGIs $10k-25k, 71.7% for AGIs $25k-50k, 71.7% for AGIs $50k-75k, 74.4% for AGIs $75k-100k, 68.4% for AGIs over 100k)
Taxable interest for individuals: $2,000 (reported on 56.7% of returns)
This zip code:
$2,000
Pennsylvania:
$1,657
(% of AGI for various income ranges: 8.3% for AGIs below $10k, 4.4% for AGIs $10k-25k, 2.5% for AGIs $25k-50k, 2.0% for AGIs $50k-75k, 1.8% for AGIs $75k-100k, 1.5% for AGIs over 100k)
Taxable dividends: $4,230 (reported on 40.4% of returns)
Here:
$4,230
State:
$3,566
(% of AGI for various income ranges: 7.0% for AGIs below $10k, 3.8% for AGIs $10k-25k, 2.6% for AGIs $25k-50k, 2.5% for AGIs $50k-75k, 1.9% for AGIs $75k-100k, 3.4% for AGIs over 100k)
Net capital gain/loss: +$7,462 (reported on 30.0% of returns)
Here:
+$7,462
State:
+$9,716
(% of AGI for various income ranges: -3.1% for AGIs below $10k, 0.7% for AGIs $10k-25k, 0.8% for AGIs $25k-50k, 0.9% for AGIs $50k-75k, 1.8% for AGIs $75k-100k, 6.9% for AGIs over 100k)
Profit/loss from business: +$16,910 (reported on 11.8% of returns)
Here:
+$16,910
State:
+$14,267
(% of AGI for various income ranges: 1.9% for AGIs below $10k, 3.3% for AGIs $10k-25k, 2.2% for AGIs $25k-50k, 1.6% for AGIs $50k-75k, 4.1% for AGIs $75k-100k, 4.4% for AGIs over 100k)
IRA payment deduction: $2,933 (reported on 2.6% of returns)
17033:
$2,933
Pennsylvania:
$2,903
(% of AGI for various income ranges: 0.2% for AGIs $10k-25k, 0.3% for AGIs $25k-50k, 0.2% for AGIs $50k-75k, 0.2% for AGIs $75k-100k, 0.1% for AGIs over 100k)
Self-employed pension: $13,625 (reported on 1.2% of returns)
Here:
$13,625
Pennsylvania:
$14,674
(% of AGI for various income ranges: 0.2% for AGIs $10k-25k, 0.2% for AGIs $75k-100k, 0.5% for AGIs over 100k)
Total itemized deductions: $20,843 (20% of AGI, reported on 37.6% of returns)
Here:
$20,843
State:
$18,804
Here:
19.6% of AGI
State:
19.5% of AGI
(% of AGI for various income ranges: 11.9% for AGIs below $10k, 12.0% for AGIs $10k-25k, 12.1% for AGIs $25k-50k, 13.9% for AGIs $50k-75k, 16.2% for AGIs $75k-100k, 13.9% for AGIs over 100k)
Charity contributions deductions: $4,641 (4% of AGI, reported on 33.3% of returns)
Here:
$4,641
State:
$3,337
Here:
4.1% of AGI
State:
3.3% of AGI
(% of AGI for various income ranges: 0.6% for AGIs below $10k, 1.2% for AGIs $10k-25k, 1.7% for AGIs $25k-50k, 2.3% for AGIs $50k-75k, 2.5% for AGIs $75k-100k, 3.5% for AGIs over 100k)
Total tax: $9,906 (reported on 77.5% of returns)
17033:
$9,906
State:
$8,008
(% of AGI for various income ranges: 2.2% for AGIs below $10k, 4.4% for AGIs $10k-25k, 7.4% for AGIs $25k-50k, 9.0% for AGIs $50k-75k, 10.6% for AGIs $75k-100k, 18.9% for AGIs over 100k)
Earned income credit: $1,432 (reported on 6.3% of returns)
Here:
$1,432
State:
$1,643
Percentage of individuals using paid preparers for their 2004 taxes: 52.5%
Here:
52%
State:
56%
(% for various income ranges: 42.9% for AGIs below $10k, 51.0% for AGIs $10k-25k, 52.1% for AGIs $25k-50k, 55.9% for AGIs $50k-75k, 54.0% for AGIs $75k-100k, 65.2% for AGIs over 100k)
Likely homosexual households (counted as self-reported same-sex unmarried-partner households)
Lesbian couples: 0.2% of all households
Gay men: 0.2% of all households
Household received Food Stamps/SNAP in the past 12 months: 313 Household did not receive Food Stamps/SNAP in the past 12 months: 6,199
Women who had a birth in the past 12 months: 204 (104 now married, 91 unmarried) Women who did not have a birth in the past 12 months: 3,613 (1,488 now married, 2,122 unmarried)
Housing units in zip code 17033 with a mortgage: 2,144 (159 second mortgage, 128 both second mortgage and home equity loan) Houses without a mortgage: 81
Median monthly owner costs for units with a mortgage: $2,053 Median monthly owner costs for units without a mortgage: $748
Residents with income below the poverty level in 2022:
This zip code:
11.2%
Whole state:
11.8%
Residents with income below 50% of the poverty level in 2022:
This zip code:
4.8%
Whole state:
6.1%
Median number of rooms in houses and condos:
Here:
7.1
State:
6.8
Median number of rooms in apartments:
Here:
4.5
State:
4.3
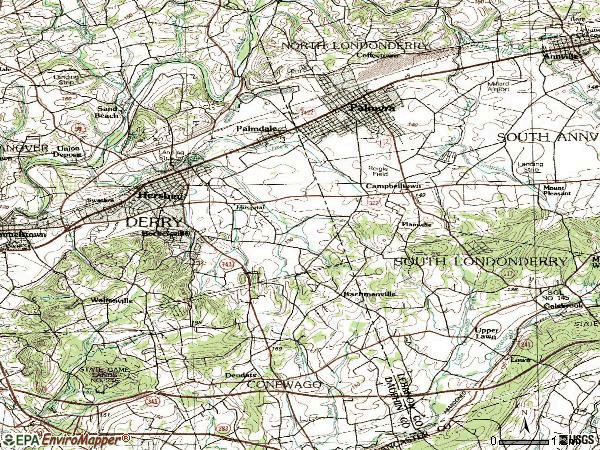
Notable locations in this zip code not listed on our city pages
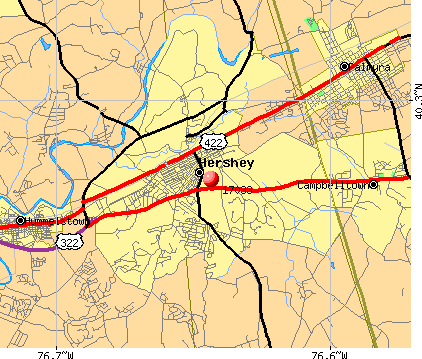
Notable locations in zip code 17033: Hotel Hershey Golf Course (A), Hershey Spring Creek Golf (B), Hershey Parkview Golf (C), Hershey Country Club and Golf Courses (D), Hershey Nursery (E), The Hotel Hershey (F), Union Deposit Volunteer Fire Company Station 47 (G), Hershey Information Center (H), Founders Hall (I), Hershey Museum of American Life (J), Hershey Volunteer Fire Company Station 48 (K). Display/hide their locations on the map
Churches in zip code 17033 include: Hershey Church (A), Balsbaugh Church (B), Conewago Church Number 1 (C), Fishburns Church (D), Spring Creek Church (E), Stauffers Church (F). Display/hide their locations on the map
In group quarters: 2,056 (-1 institutionalized population)
Size of family households: 2,162 2-persons, 747 3-persons, 749 4-persons, 390 5-persons, 40 6-persons, 72 7-or-more-persons
Size of nonfamily households: 1,877 1-person, 490 2-persons, 35 3-persons
2,145 married couples with children.
901 single-parent households (187 men, 714 women).
83.1% of residents of 17033 zip code speak English at home.
10.4% of residents speak Spanish at home (36% very well, 3% well, 60% not well).
3.3% of residents speak other Indo-European language at home (80% very well, 14% well, 3% not well, 3% not at all).
3.4% of residents speak Asian or Pacific Island language at home (67% very well, 26% well, 3% not well, 3% not at all).
0.4% of residents speak other language at home (100% very well).
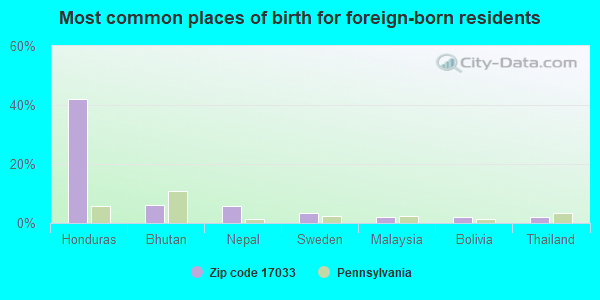
Foreign born population: 2,042 (12.0%) (29.7% of them are naturalized citizens)
Facilities with environmental interests located in this zip code:
AGATE ELEVATOR (GATES RD RD 1 in HERSHEY, PA)
TRANSPORTER (Resource Conservation and Recovery Act (tracking hazardous waste)) Organizations: OPERNAME (CONTACT/OPERATOR)
, JOS FREIGHT INC SHERWOOD N KEEPER PRES (CONTACT/OWNER)
ATLANTIC SERVICE STATION (CHOCOLATE & MILL-TANKS in HERSHEY, PA)
Conditionally Exempt Small Quantity Generators, less than 100 kg/month of hazardous waste (Resource Conservation and Recovery Act (tracking hazardous waste)) - notification Organizations: OPERNAME (CONTACT/OPERATOR)
, ATLANTIC REFINING & MARKETING (CONTACT/OWNER)
Housing units lacking complete plumbing facilities: 0.7% Housing units lacking complete kitchen facilities: 1.3%
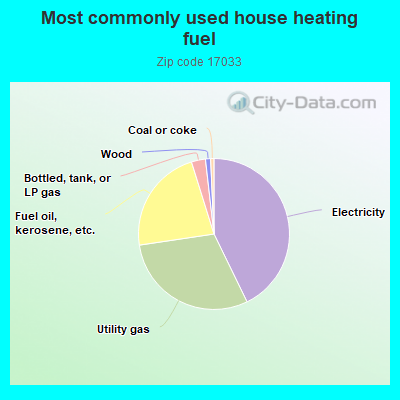
42.7%Electricity
29.8%Utility gas
22.5%Fuel oil, kerosene, etc.
3.0%Bottled, tank, or LP gas
1.1%Wood
0.7%Coal or coke
Population in 1990: 20,514.
Place of birth for U.S.-born residents:
This state: 8,561
Northeast: 2,701
Midwest: 1,381
South: 1,351
West: 730
56% of the 17033 zip code residents lived in the same house 5 years ago. Out of people who lived in different houses, 38% lived in this county. Out of people who lived in different counties, 50% lived in Pennsylvania.
79% of the 17033 zip code residents lived in the same house 1 year ago. Out of people who lived in different houses, 37% moved from this county. Out of people who lived in different houses, 44% moved from different county within same state. Out of people who lived in different houses, 12% moved from different state. Out of people who lived in different houses, 4% moved from abroad.
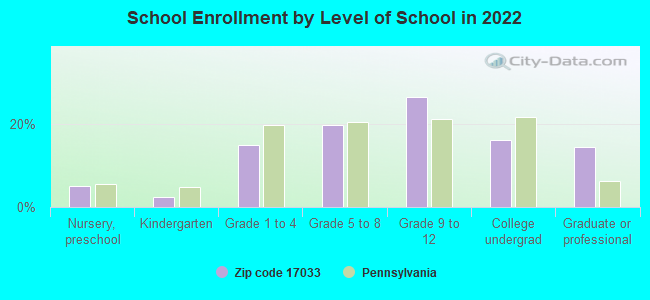
Private vs. public school enrollment:
Students in private schools in grades 1 to 8 (elementary and middle school): 293
Here:
19.8%
Pennsylvania:
15.7%
Students in private schools in grades 9 to 12 (high school): 53
Here:
4.8%
Pennsylvania:
13.4%
Students in private undergraduate colleges: 168
Here:
24.7%
Pennsylvania:
39.8%
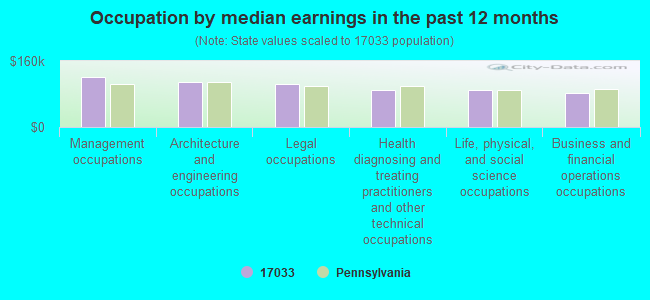
Occupation by median earnings in the past 12 months ($)
121,376Management occupations
107,887Architecture and engineering occupations
105,229Legal occupations
90,561Health diagnosing and treating practitioners and other technical occupations
88,912Life, physical, and social science occupations
81,669Business and financial operations occupations
Companies with federal contracts located in this zip code (HERSHEY, PA):
HERSHEY FOODS CORPORATION (100 CRYSTAL A DR UNIT 8) : $65,458,951 in 47 contractsfrom 2000 to 2005
Contracts for Food Items For Resale, Non-Food Items For Resale, Dairy Foods and Eggs by Defense Commissary Agency, Department of Defense, Defense Logistics Agency Signed by year:2000: $4,911,191; 2001: $6,148,943; 2002: $9,140,229; 2003: $4,656,739; 2004: $14,501,334; 2005: $26,100,515; 2006: $0.
Biggest contracts:
$10,232,615 with Defense Commissary Agency for Food Items For Resale. Signed on 2004-10-01. Completion date: 2005-02-28.
$10,161,779, same as above.Signed on 2005-04-01. Completion date: 2005-08-31.
$7,982,307 with Defense Commissary Agency for Non-Food Items For Resale. Signed on 2005-10-01. Completion date: 2005-12-31.
$4,056,362 with Department of Defense for Food Items For Resale. Signed on 2002-10-01. Completion date: 2003-05-31.
HERSHEY FOODS CORPORATION (14 E CHOCOLATE AVE) : $3,458,416 in 7 contractsfrom 1999 to 2000
Contracts for Food Items For Resale by Department of Defense Signed by year:2000: $161,071; 2001: $0; 2002: $0; 2003: $0; 2004: $0; 2005: $0; 2006: $0.
Biggest contracts:
$921,387 with Department of Defense for Food Items For Resale. Signed on 1999-12-31. Completion date: 2000-01-31.
$588,338, same as above.Signed on 1999-11-30. Completion date: 1999-11-30.
$583,024, same as above.Signed on 1999-10-31. Completion date: 1999-10-31.
$578,657, same as above.Signed on 1999-12-31. Completion date: 2000-03-31.
T D MILLS PROMOTIONAL PRODUCTS (1020 COCOA AVE; small business) : $203,407 in 17 contractsfrom 2004 to 2006
Contracts for Miscellaneous Items, Clothing, Special Purpose, Outerwear, Men's, Office Supplies, and moreby Defense Logistics Agency, Navy Signed by year:2000: $0; 2001: $0; 2002: $0; 2003: $0; 2004: $54,035; 2005: $132,745; 2006: $16,627.
Biggest contracts:
$55,099 with Defense Logistics Agency for Miscellaneous Items. Signed on 2005-07-28. Completion date: 2005-09-09.
$42,179 with Defense Logistics Agency for Clothing, Special Purpose. Signed on 2004-09-22. Completion date: 2004-11-03.
$22,205, same as above.Signed on 2005-08-29. Completion date: 2005-09-23.
$14,309 with Defense Logistics Agency for Miscellaneous Items. Signed on 2005-03-31. Completion date: 2005-04-22.
HERSHEY ENTERTAINMENT & RESORT (W CHCLTE UNIVERSITY DR; small business)
$42,000 with Office of Personnel Management for Lease or Rental of Facilities -- Conference Space and Facilities. Signed on 2000-07-15. Completion date: 2000-08-15.
LARRY LEO (581 W CHOCOLATE AVE; small business) : $33,720 in 3 contractsfrom 2003 to 2006
$15,000 with Army for ADP Software. Signed on 2003-08-27. Completion date: 2003-09-30.
$14,400 with Army for Office Supplies. Signed on 2005-06-17. Completion date: 2005-09-16.
$4,320 with Army for ADP Software. Signed on 2006-01-24. Completion date: 2006-02-10.
ENVIRONMENTAL CONTROLS AND SER (285 GATES RD) : $12,500 in 2 contractsfrom 2003 to 2005
$6,625 with Army for Oil Spill Response including Cleanup, Removal, Disposal and Operational Support. Signed on 2003-04-02. Completion date: 2003-03-03.
$5,875 with Army for Air Conditioning Equipment. Signed on 2005-06-28. Completion date: 2005-05-29.
SINGH, HARJIT (7 JACOBS CREEK DR; small business)
$2,674 with Army for Radiology Services. Taking place in HI. Signed on 2005-05-16. Completion date: 2005-05-27.
Top industries in this zip code by the number of employees in 2005:
Management of Companies and Enterprises: Corporate, Subsidiary, and Regional Managing Offices (over 1000 employees: 1 establishment, 100-249 employees: 1 establishment, 50-99 employees: 1 establishment, 10-19 employees: 1 establishment)
Accommodation and Food Services: Hotels (except Casino Hotels) and Motels (500-999: 2, 20-49: 2, 10-19: 2, 5-9: 2, 1-4: 5)
2005 - 2018 National Fire Incident Reporting System (NFIRS) incidents
According to the data from the years 2005 - 2018 the average number of fires per year is 117. The highest number of reported fire incidents - 169 took place in 2012, and the least - 72 in 2005. The data has a rising trend.
When looking into fire subcategories, the most reports belonged to: Structure Fires (68.3%), and Outside Fires (21.7%).
Fire incident types reported to NFIRS in Zip Code 17033
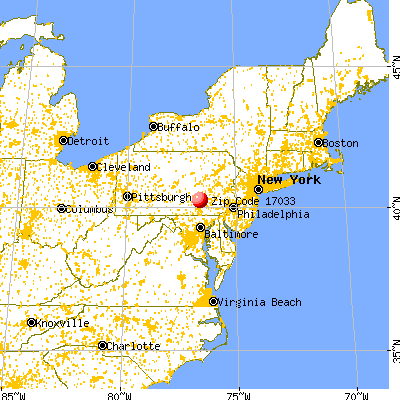


 Nearest zip codes: 17010, 17078, 17036, 17022, 17041, 17003.
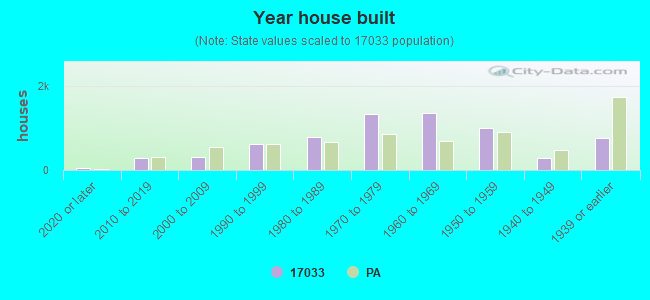


 According to the data from the years 2005 - 2018 the average number of fires per year is 117. The highest number of reported fire incidents - 169 took place in 2012, and the least - 72 in 2005. The data has a rising trend.
 When looking into fire subcategories, the most reports belonged to: Structure Fires (68.3%), and Outside Fires (21.7%).