Races in Gulf Gate Estates, Florida (FL) Detailed Stats
Data:
Races - White alone (%)
Races - White alone (% change since 2000)
Races - Black alone (%)
Races - Black alone (% change since 2000)
Races - American Indian alone (%)
Races - American Indian alone (% change since 2000)
Races - Asian alone (%)
Races - Asian alone (% change since 2000)
Races - Hispanic (%)
Races - Hispanic (% change since 2000)
Races - Native Hawaiian and Other Pacific Islander alone (%)
Races - Native Hawaiian and Other Pacific Islander alone (% change since 2000)
Races - Two or more races(%)
Races - Two or more races(% change since 2000)
Races - Other race alone (%)
Races - Other race alone (% change since 2000)
Racial diversity
Place of birth - Born in state of residence (%)
Place of birth - Born in state of residence (%) - White
Place of birth - Born in state of residence (%) - Black or African American
Place of birth - Born in state of residence (%) - Asian
Place of birth - Born in state of residence (%) - Hispanic or Latino
Place of birth - Born in state of residence (%) - American Indian and Alaska Native
Place of birth - Born in state of residence (%) - Multirace
Place of birth - Born in state of residence (%) - Other Race
Place of birth - Born in other state (%)
Place of birth - Born in other state (%) - White
Place of birth - Born in other state (%) - Black or African American
Place of birth - Born in other state (%) - Asian
Place of birth - Born in other state (%) - Hispanic or Latino
Place of birth - Born in other state (%) - American Indian and Alaska Native
Place of birth - Born in other state (%) - Multirace
Place of birth - Born in other state (%) - Other Race
Place of birth - Native, outside of US (%)
Place of birth - Native, outside of US (%) - White
Place of birth - Native, outside of US (%) - Black or African American
Place of birth - Native, outside of US (%) - Asian
Place of birth - Native, outside of US (%) - Hispanic or Latino
Place of birth - Native, outside of US (%) - American Indian and Alaska Native
Place of birth - Native, outside of US (%) - Multirace
Place of birth - Native, outside of US (%) - Other Race
Place of birth - Foreign born (%)
Place of birth - Foreign born (%) - White
Place of birth - Foreign born (%) - Black or African American
Place of birth - Foreign born (%) - Asian
Place of birth - Foreign born (%) - Hispanic or Latino
Place of birth - Foreign born (%) - American Indian and Alaska Native
Place of birth - Foreign born (%) - Multirace
Place of birth - Foreign born (%) - Other Race
Residents speaking English at home (%)
Residents speaking English at home - Born in the United States (%)
Residents speaking English at home - Native, born elsewhere (%)
Residents speaking English at home - Foreign born (%)
Residents speaking Spanish at home (%)
Residents speaking Spanish at home - Born in the United States (%)
Residents speaking Spanish at home - Native, born elsewhere (%)
Residents speaking Spanish at home - Foreign born (%)
Residents speaking other language at home (%)
Residents speaking other language at home - Born in the United States (%)
Residents speaking other language at home - Native, born elsewhere (%)
Residents speaking other language at home - Foreign born (%)
Marital status - Never married (%)
Marital status - Now married (%)
Marital status - Separated (%)
Marital status - Widowed (%)
Marital status - Divorced (%)
Ancestries Reported - Arab (%)
Ancestries Reported - Czech (%)
Ancestries Reported - Danish (%)
Ancestries Reported - Dutch (%)
Ancestries Reported - English (%)
Ancestries Reported - French (%)
Ancestries Reported - French Canadian (%)
Ancestries Reported - German (%)
Ancestries Reported - Greek (%)
Ancestries Reported - Hungarian (%)
Ancestries Reported - Irish (%)
Ancestries Reported - Italian (%)
Ancestries Reported - Lithuanian (%)
Ancestries Reported - Norwegian (%)
Ancestries Reported - Polish (%)
Ancestries Reported - Portuguese (%)
Ancestries Reported - Russian (%)
Ancestries Reported - Scotch-Irish (%)
Ancestries Reported - Scottish (%)
Ancestries Reported - Slovak (%)
Ancestries Reported - Subsaharan African (%)
Ancestries Reported - Swedish (%)
Ancestries Reported - Swiss (%)
Ancestries Reported - Ukrainian (%)
Ancestries Reported - United States (%)
Ancestries Reported - Welsh (%)
Ancestries Reported - West Indian (%)
Ancestries Reported - Other (%)
Geographical mobility - Same house 1 year ago (%)
Geographical mobility - Same house 1 year ago (%) - White
Geographical mobility - Same house 1 year ago (%) - Black or African American
Geographical mobility - Same house 1 year ago (%) - Asian
Geographical mobility - Same house 1 year ago (%) - Hispanic or Latino
Geographical mobility - Same house 1 year ago (%) - American Indian and Alaska Native
Geographical mobility - Same house 1 year ago (%) - Multirace
Geographical mobility - Same house 1 year ago (%) - Other Race
Geographical mobility - Moved within same county (%)
Geographical mobility - Moved within same county (%) - White
Geographical mobility - Moved within same county (%) - Black or African American
Geographical mobility - Moved within same county (%) - Asian
Geographical mobility - Moved within same county (%) - Hispanic or Latino
Geographical mobility - Moved within same county (%) - American Indian and Alaska Native
Geographical mobility - Moved within same county (%) - Multirace
Geographical mobility - Moved within same county (%) - Other Race
Geographical mobility - Moved from different county within same state (%)
Geographical mobility - Moved from different county within same state (%) - White
Geographical mobility - Moved from different county within same state (%) - Black or African American
Geographical mobility - Moved from different county within same state (%) - Asian
Geographical mobility - Moved from different county within same state (%) - Hispanic or Latino
Geographical mobility - Moved from different county within same state (%) - American Indian and Alaska Native
Geographical mobility - Moved from different county within same state (%) - Multirace
Geographical mobility - Moved from different county within same state (%) - Other Race
Geographical mobility - Moved from different state (%)
Geographical mobility - Moved from different state (%) - White
Geographical mobility - Moved from different state (%) - Black or African American
Geographical mobility - Moved from different state (%) - Asian
Geographical mobility - Moved from different state (%) - Hispanic or Latino
Geographical mobility - Moved from different state (%) - American Indian and Alaska Native
Geographical mobility - Moved from different state (%) - Multirace
Geographical mobility - Moved from different state (%) - Other Race
Geographical mobility - Moved from abroad (%)
Geographical mobility - Moved from abroad (%) - White
Geographical mobility - Moved from abroad (%) - Black or African American
Geographical mobility - Moved from abroad (%) - Asian
Geographical mobility - Moved from abroad (%) - Hispanic or Latino
Geographical mobility - Moved from abroad (%) - American Indian and Alaska Native
Geographical mobility - Moved from abroad (%) - Multirace
Geographical mobility - Moved from abroad (%) - Other Race
Place of birth for the foreign-born population - Ireland (%)
Place of birth for the foreign-born population - Denmark (%)
Place of birth for the foreign-born population - Norway (%)
Place of birth for the foreign-born population - Sweden (%)
Place of birth for the foreign-born population - United Kingdom (%)
Place of birth for the foreign-born population - England (%)
Place of birth for the foreign-born population - Scotland (%)
Place of birth for the foreign-born population - Other Northern Europe (%)
Place of birth for the foreign-born population - Austria (%)
Place of birth for the foreign-born population - Belgium (%)
Place of birth for the foreign-born population - France (%)
Place of birth for the foreign-born population - Germany (%)
Place of birth for the foreign-born population - Netherlands (%)
Place of birth for the foreign-born population - Switzerland (%)
Place of birth for the foreign-born population - Other Western Europe (%)
Place of birth for the foreign-born population - Greece (%)
Place of birth for the foreign-born population - Italy (%)
Place of birth for the foreign-born population - Portugal (%)
Place of birth for the foreign-born population - Spain (%)
Place of birth for the foreign-born population - Other Southern Europe (%)
Place of birth for the foreign-born population - Albania (%)
Place of birth for the foreign-born population - Belarus (%)
Place of birth for the foreign-born population - Bosnia and Herzegovina (%)
Place of birth for the foreign-born population - Bulgaria (%)
Place of birth for the foreign-born population - Croatia (%)
Place of birth for the foreign-born population - Czechoslovakia (%)
Place of birth for the foreign-born population - Hungary (%)
Place of birth for the foreign-born population - Latvia (%)
Place of birth for the foreign-born population - Lithuania (%)
Place of birth for the foreign-born population - North Macedonia (Macedonia) (%)
Place of birth for the foreign-born population - Moldova (%)
Place of birth for the foreign-born population - Poland (%)
Place of birth for the foreign-born population - Romania (%)
Place of birth for the foreign-born population - Russia (%)
Place of birth for the foreign-born population - Serbia (%)
Place of birth for the foreign-born population - Ukraine (%)
Place of birth for the foreign-born population - Other Eastern Europe (%)
Place of birth for the foreign-born population - China (%)
Place of birth for the foreign-born population - Hong Kong (%)
Place of birth for the foreign-born population - Taiwan (%)
Place of birth for the foreign-born population - Japan (%)
Place of birth for the foreign-born population - Korea (%)
Place of birth for the foreign-born population - Other Eastern Asia (%)
Place of birth for the foreign-born population - Afghanistan (%)
Place of birth for the foreign-born population - Bangladesh (%)
Place of birth for the foreign-born population - India (%)
Place of birth for the foreign-born population - Iran (%)
Place of birth for the foreign-born population - Kazakhstan (%)
Place of birth for the foreign-born population - Nepal (%)
Place of birth for the foreign-born population - Pakistan (%)
Place of birth for the foreign-born population - Sri Lanka (%)
Place of birth for the foreign-born population - Uzbekistan (%)
Place of birth for the foreign-born population - Other South Central Asia (%)
Place of birth for the foreign-born population - Burma (%)
Place of birth for the foreign-born population - Cambodia (%)
Place of birth for the foreign-born population - Indonesia (%)
Place of birth for the foreign-born population - Laos (%)
Place of birth for the foreign-born population - Malaysia (%)
Place of birth for the foreign-born population - Philippines (%)
Place of birth for the foreign-born population - Singapore (%)
Place of birth for the foreign-born population - Thailand (%)
Place of birth for the foreign-born population - Vietnam (%)
Place of birth for the foreign-born population - Other South Eastern Asia (%)
Place of birth for the foreign-born population - Armenia (%)
Place of birth for the foreign-born population - Iraq (%)
Place of birth for the foreign-born population - Israel (%)
Place of birth for the foreign-born population - Jordan (%)
Place of birth for the foreign-born population - Kuwait (%)
Place of birth for the foreign-born population - Lebanon (%)
Place of birth for the foreign-born population - Saudi Arabia (%)
Place of birth for the foreign-born population - Syria (%)
Place of birth for the foreign-born population - Turkey (%)
Place of birth for the foreign-born population - Yemen (%)
Place of birth for the foreign-born population - Other Western Asia (%)
Place of birth for the foreign-born population - Eritrea (%)
Place of birth for the foreign-born population - Ethiopia (%)
Place of birth for the foreign-born population - Kenya (%)
Place of birth for the foreign-born population - Somalia (%)
Place of birth for the foreign-born population - Uganda (%)
Place of birth for the foreign-born population - Zimbabwe (%)
Place of birth for the foreign-born population - Other Eastern Africa (%)
Place of birth for the foreign-born population - Cameroon (%)
Place of birth for the foreign-born population - Congo (%)
Place of birth for the foreign-born population - Democratic Republic of Congo (Zaire) (%)
Place of birth for the foreign-born population - Other Middle Africa (%)
Place of birth for the foreign-born population - Egypt (%)
Place of birth for the foreign-born population - Morocco (%)
Place of birth for the foreign-born population - Sudan (%)
Place of birth for the foreign-born population - Other Northern Africa (%)
Place of birth for the foreign-born population - South Africa (%)
Place of birth for the foreign-born population - Other Southern Africa (%)
Place of birth for the foreign-born population - Cabo Verde (%)
Place of birth for the foreign-born population - Ghana (%)
Place of birth for the foreign-born population - Liberia (%)
Place of birth for the foreign-born population - Nigeria (%)
Place of birth for the foreign-born population - Senegal (%)
Place of birth for the foreign-born population - Sierra Leone (%)
Place of birth for the foreign-born population - Other Western Africa (%)
Place of birth for the foreign-born population - Australia (%)
Place of birth for the foreign-born population - New Zealand (%)
Place of birth for the foreign-born population - Fiji (%)
Place of birth for the foreign-born population - Micronesia (%)
Place of birth for the foreign-born population - Bahamas (%)
Place of birth for the foreign-born population - Barbados (%)
Place of birth for the foreign-born population - Cuba (%)
Place of birth for the foreign-born population - Dominica (%)
Place of birth for the foreign-born population - Dominican Republic (%)
Place of birth for the foreign-born population - Grenada (%)
Place of birth for the foreign-born population - Haiti (%)
Place of birth for the foreign-born population - Jamaica (%)
Place of birth for the foreign-born population - St. Vincent and the Grenadines (%)
Place of birth for the foreign-born population - Trinidad and Tobago (%)
Place of birth for the foreign-born population - West Indies (%)
Place of birth for the foreign-born population - Other Caribbean (%)
Place of birth for the foreign-born population - Belize (%)
Place of birth for the foreign-born population - Costa Rica (%)
Place of birth for the foreign-born population - El Salvador (%)
Place of birth for the foreign-born population - Guatemala (%)
Place of birth for the foreign-born population - Honduras (%)
Place of birth for the foreign-born population - Mexico (%)
Place of birth for the foreign-born population - Nicaragua (%)
Place of birth for the foreign-born population - Panama (%)
Place of birth for the foreign-born population - Other Central America (%)
Place of birth for the foreign-born population - Argentina (%)
Place of birth for the foreign-born population - Bolivia (%)
Place of birth for the foreign-born population - Brazil (%)
Place of birth for the foreign-born population - Chile (%)
Place of birth for the foreign-born population - Colombia (%)
Place of birth for the foreign-born population - Ecuador (%)
Place of birth for the foreign-born population - Guyana (%)
Place of birth for the foreign-born population - Peru (%)
Place of birth for the foreign-born population - Uruguay (%)
Place of birth for the foreign-born population - Venezuela (%)
Place of birth for the foreign-born population - Other South America (%)
Place of birth for the foreign-born population - Canada (%)
Place of birth for the foreign-born population - Other Northern America (%)
Place of birth for the foreign-born population - Other (%)
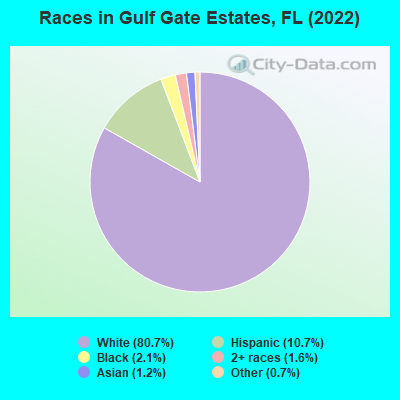
According to 2022 data, the most numerous races in Gulf Gate Estates, FL are White alone (9,546 residents), Hispanic (1,268 residents), and Black alone (245 residents). 86.6% of Gulf Gate Estates residents speak English at home. 12.2% of Gulf Gate Estates, FL residents are foreign-born (5.2% born in Europe, 5.1% born in Latin America), which is 71.9% less than the foreign-born rate of 21.0% across the entire state of Florida.
Race distribution in Gulf Gate Estates
2000 2022
10,458,509 65.4% White alone 2,682,715 16.8% Hispanic 2,264,268 14.2% Black alone 261,693 1.6% Asian alone 236,954 1.5% Two or more races 42,358 0.3% American Indian alone 28,994 0.2% Other race alone 6,887 0.04% Native Hawaiian and Other
11,309,403 50.8% White alone 6,025,039 27.1% Hispanic 3,241,015 14.6% Black alone 861,630 3.9% Two or more races 623,692 2.8% Asian alone 152,054 0.7% Other race alone 22,504 0.1% American Indian alone 9,486 0.04% Native Hawaiian and Other
Income and house value in Gulf Gate Estates Median household income in 2022 $66,010 White non-Hispanic householders$8,527 Black householders$55,767 Asian householders$70,331 Some other race householders$131,584 Two or more races householders$78,061 Hispanic or Latino race householdersMedian 2022 house value $397,985 White Non-Hispanic householders$680,859 Black or African American householders$499,296 American Indian or Alaska Native householders $50,474 Asian householders$344,968 Some other race householders$499,296 Two or more races householders$375,108 Hispanic or Latino householders
Median age by race in Gulf Gate Estates
59.4 Median age for White residents57.9 62.0 26.6 Median age for Black or African American residents5.7 Median age for American Indian / Alaska Native residents41.9 Median age for Asian residents20.7 Median age for Other race residents19.8 38.9 28.2 Median age for Two or more races residents60.7 Median age for White alone residents57.2 63.8 19.4 Median age for Hispanic or Latino residents20.3 17.4
Owner/renter occupied households by race in Gulf Gate Estates
House owners and renters - White residents 3,114 64.1% Owner occupied1,742 35.9% Renter occupiedHouse owners and renters - Black or African American residents 58 100.0% Renter occupiedHouse owners and renters - Asian residents 51 60.9% Owner occupied33 39.1% Renter occupiedHouse owners and renters - Other race residents 94 100.0% Renter occupiedHouse owners and renters - Two or more races residents 220 100.0% Renter occupiedHouse owners and renters - White alone residents 3,299 65.2% Owner occupied1,763 34.8% Renter occupiedHouse owners and renters - Hispanic or Latino residents 11 3.1% Owner occupied331 96.9% Renter occupied
Language usage in Gulf Gate Estates
English speakers - Total 86.6% of residents of Gulf Gate Estates speak English at home.
7.8% of residents speak Spanish at home 406 46.3% Speak English very well470 53.7% Speak English less than very well5.1% of residents speak other language at home 439 76.2% Speak English very well137 23.8% Speak English less than very well
English speakers - Born in the United States 98.2% of residents of Gulf Gate Estates speak English at home.
0.6% of residents speak Spanish at home 31 68.9% Speak English very well14 31.1% Speak English less than very well1.0% of residents speak other language at home 70 100.0% Speak English very well
English speakers - Native, born elsewhere 59.1% of residents of Gulf Gate Estates speak English at home.
41.3% of residents speak Spanish at home 32 37.2% Speak English very well54 62.8% Speak English less than very well
English speakers - Foreign-born 34.2% of residents of Gulf Gate Estates speak English at home.
32.5% of residents speak Spanish at home 123 25.8% Speak English very well354 74.2% Speak English less than very well32.9% of residents speak other language at home 347 71.8% Speak English very well136 28.2% Speak English less than very well
White (Caucasian) - Speak only English Native:
99.7% (8,660)Foreign-born:
53.1% (370)
White (Caucasian) - Speak another language Native:
3.6% (315)Foreign-born:
56.9% (396)
Asian - Speak only English Native:
70.8% (24)Foreign-born:
27.7% (30)
Other race - Speak another language Native:
32.9% (59)Foreign-born:
93.5% (238)
White alone - Speak only English Native:
98.3% (8,593)Foreign-born:
48.5% (354)
White alone - Speak another language Native:
1.7% (153)Foreign-born:
51.6% (376)
Hispanic or Latino - Speak only English Native:
53.2% (380)Foreign-born:
15.2% (82)
Hispanic or Latino - Speak another language Native:
48.9% (349)Foreign-born:
85.2% (461)
Foreign-born residents in Gulf Gate Estates 1,454 residents are foreign born (5.2% Europe , 5.1% Latin America ).
This city:
12.2%Florida:
100.0%
Marital status for residents in Gulf Gate Estates Marital status - White (Caucasian) population 15 years and over
Males 28.2% Never married46.2% Now married0.8% Separated8.5% Widowed16.2% DivorcedFemales 16.8% Never married41.9% Now married2.5% Separated20.2% Widowed18.6% DivorcedWomen who gave birth in the past 12 months Now married:
66.7% (32)Unmarried:
33.3% (16)
Women who did not give birth in the past 12 months Now married:
50.1% (565)Unmarried:
49.9% (562)
Marital status - Black or African American population 15 years and over
Males 100.0% Never married0.0% Now married0.0% Separated0.0% Widowed0.0% DivorcedFemales 93.7% Never married0.0% Now married0.0% Separated6.3% Widowed0.0% DivorcedWomen who did not give birth in the past 12 months Now married:
0.0% (0)Unmarried:
100.0% (132)
Marital status - Asian population 15 years and over
Males 75.0% Never married25.0% Now married0.0% Separated0.0% Widowed0.0% DivorcedFemales 0.0% Never married44.4% Now married22.2% Separated0.0% Widowed33.3% DivorcedWomen who did not give birth in the past 12 months Now married:
55.6% (26)Unmarried:
44.4% (21)
Marital status - Other race population 15 years and over
Males 80.8% Never married19.2% Now married0.0% Separated0.0% Widowed0.0% DivorcedFemales 0.0% Never married30.2% Now married0.0% Separated0.0% Widowed69.8% DivorcedWomen who did not give birth in the past 12 months Now married:
30.2% (23)Unmarried:
69.8% (53)
Marital status - White alone, not Hispanic / Latino population 15 years and over
Males 27.5% Never married46.1% Now married0.9% Separated8.9% Widowed16.5% DivorcedFemales 16.5% Never married41.3% Now married1.3% Separated21.0% Widowed19.9% DivorcedWomen who gave birth in the past 12 months Now married:
66.7% (37)Unmarried:
33.3% (18)
Women who did not give birth in the past 12 months Now married:
44.4% (454)Unmarried:
55.6% (569)
Marital status - Hispanic or Latino population 15 years and over
Males 68.1% Never married27.5% Now married0.0% Separated0.0% Widowed4.5% DivorcedFemales 19.0% Never married46.0% Now married15.4% Separated9.4% Widowed10.1% DivorcedWomen who did not give birth in the past 12 months Now married:
64.4% (231)Unmarried:
35.6% (127)
Ancestries in Gulf Gate Estates
1,779 28.8% American564 9.1% English479 7.8% German443 7.2% Irish436 7.1% Italian237 3.8% Polish118 1.9% South African93 1.5% European70 1.1% French69 1.1% Eastern European63 1.0% Dutch63 1.0% Scottish51 0.8% Scotch-Irish51 0.8% Swedish49 0.8% British42 0.7% Hungarian37 0.6% Brazilian37 0.6% Northern European34 0.6% Ukrainian27 0.4% Russian23 0.4% French Canadian22 0.4% Welsh20 0.3% Greek20 0.3% Turkish19 0.3% Slovak18 0.3% Iranian17 0.3% Canadian16 0.3% Norwegian14 0.2% Serbian14 0.2% Swiss13 0.2% Czech11 0.2% Pennsylvania German7 0.1% Romanian7 0.1% Belizean5 0.08% Finnish
Children Nativity (place of birth) in Gulf Gate Estates
Children under 6 years - Living with two parents Both parents native 164 99.9% Native0 0.1% Foreign-bornBoth parents foreign-born 10 100.0% Foreign-bornOne native, one foreign-born parent 183 100.0% NativeChildren under 6 years - Living with one parent Native parent 18 100.0% NativeForeign-born parent 83 100.0% Foreign-bornChildren 6 to 17 years - Living with two parents Both parents native 537 100.0% NativeBoth parents foreign-born 60 85.5% Native10 14.5% Foreign-bornOne native, one foreign-born parent 77 100.0% NativeChildren 6 to 17 years - Living with one parent Native parent 272 100.0% NativeForeign-born parent 354 58.5% Native252 41.5% Foreign-born
Grandparents responsible for own grandchildren in Gulf Gate Estates
Grandparents (30 to 59 years) White / Caucasian 5 100.0% Not responsible for grandchildrenHispanic or Latino 8 100.0% Not responsible for grandchildren
Grandparents (60 years and over) White / Caucasian 52 100.0% Not responsible for grandchildren