Estimated zip code population in 2022: 23,058 Zip code population in 2010: 17,500 Zip code population in 2000: 14,042
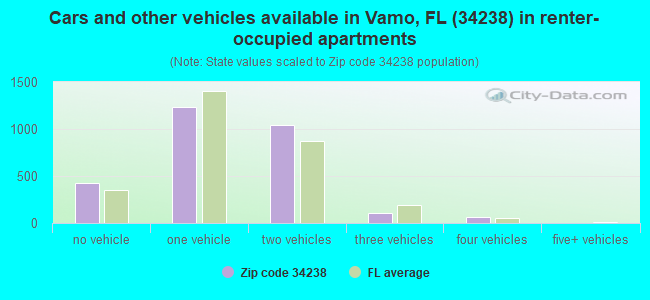
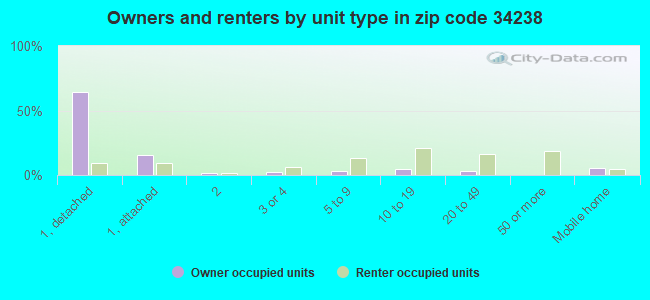
Houses and condos: 14,187 Renter-occupied apartments: 2,873
% of renters here:
24%
State:
33%
March 2022 cost of living index in zip code 34238: 97.1 (near average, U.S. average is 100)
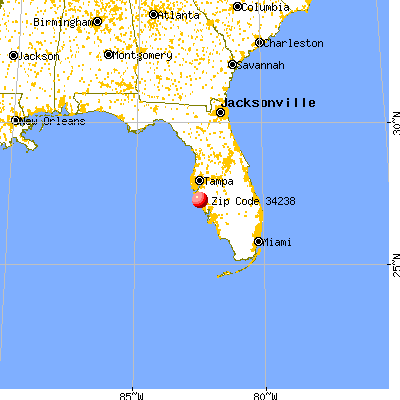
Land area: 13.2 sq. mi. Water area: 1.0 sq. mi.
Population density: 1,743 people per square mile
(low).
OSM Map
General Map
Google Map
MSN Map
OSM Map
General Map
Google Map
MSN Map
OSM Map
General Map
Google Map
MSN Map
OSM Map
General Map
Google Map
MSN Map
Please wait while loading the map...
Real estate property taxes paid for housing units in 2022:
This zip code:
0.7% ($4,178)
Florida:
0.7% ($2,529)
Median real estate property taxes paid for housing units with mortgages in 2022: $4,306 (0.7%) Median real estate property taxes paid for housing units with no mortgage in 2022: $4,071 (0.8%)
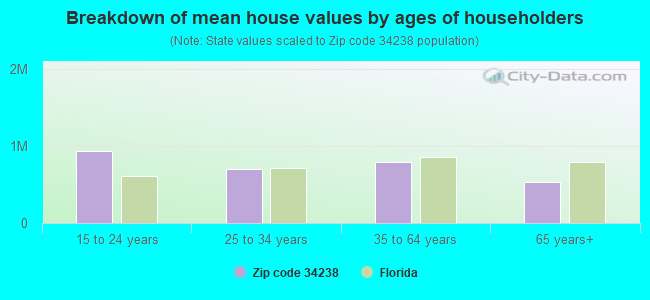
Estimated median house/condo value in 2022: $580,957
34238:
$580,957
Florida:
$354,100
According to our research of Florida and other state lists, there were 3 registered sex offenders living in 34238 zip code as of May 31, 2024. The ratio of all residents to sex offenders in zip code 34238 is 6,231 to 1. The ratio of registered sex offenders to all residents in this zip code is much lower than the state average.
Median resident age:
This zip code:
64.6 years
Florida median age:
42.7 years
Average household size:
This zip code:
2.0 people
Florida:
2.5 people
Averages for the 2020 tax year for zip code 34238, filed in 2021:
Average Adjusted Gross Income (AGI) in 2020: $124,215 (Individual Income Tax Returns)
Here:
$124,215
State:
$82,200
Salary/wage: $83,029 (reported on 55.8% of returns)
Here:
$83,029
State:
$58,347
(% of AGI for various income ranges: 1021.3% for AGIs below $25k, 2953.6% for AGIs $25k-50k, 4749.8% for AGIs $50k-75k, 6302.4% for AGIs $75k-100k, 11029.6% for AGIs $100k-200k, 69053.0% for AGIs over 200k)
Taxable interest for individuals: $4,078 (reported on 55.1% of returns)
This zip code:
$4,078
Florida:
$4,272
(% of AGI for various income ranges: 66.3% for AGIs below $25k, 108.5% for AGIs $25k-50k, 202.8% for AGIs $50k-75k, 336.4% for AGIs $75k-100k, 540.9% for AGIs $100k-200k, 3395.2% for AGIs over 200k)
Ordinary dividends: $17,594 (reported on 50.3% of returns)
Here:
$17,594
State:
$15,863
(% of AGI for various income ranges: 158.2% for AGIs below $25k, 295.9% for AGIs $25k-50k, 703.7% for AGIs $50k-75k, 1170.6% for AGIs $75k-100k, 2452.3% for AGIs $100k-200k, 13649.5% for AGIs over 200k)
Net capital gain/loss in AGI: +$34,781 (reported on 48.2% of returns)
Here:
+$34,781
State:
+$62,983
(% of AGI for various income ranges: 43.8% for AGIs below $25k, 142.0% for AGIs $25k-50k, 376.6% for AGIs $50k-75k, 741.1% for AGIs $75k-100k, 2359.0% for AGIs $100k-200k, 38901.1% for AGIs over 200k)
Profit/loss from business: +$22,183 (reported on 18.3% of returns)
Here:
+$22,183
State:
+$9,719
(% of AGI for various income ranges: 190.4% for AGIs below $25k, 344.5% for AGIs $25k-50k, 394.5% for AGIs $50k-75k, 514.1% for AGIs $75k-100k, 953.4% for AGIs $100k-200k, 5579.8% for AGIs over 200k)
Taxable individual retirement arrangement distribution: $34,997 (reported on 27.6% of returns)
34238:
$34,997
Florida:
$24,823
(% of AGI for various income ranges: 190.4% for AGIs below $25k, 415.0% for AGIs $25k-50k, 877.2% for AGIs $50k-75k, 1562.3% for AGIs $75k-100k, 3613.1% for AGIs $100k-200k, 11148.4% for AGIs over 200k)
Self-employed (Keogh) retirement plans: $22,944 (reported on 1.4% of returns)
34238:
$22,944
Florida:
$29,694
(% of AGI for various income ranges: 30.8% for AGIs $25k-50k, 77.7% for AGIs $100k-200k, 621.1% for AGIs over 200k)
Total itemized deductions: $45,249 (reported on 16.0% of returns)
Here:
$45,249
State:
$45,393
(% of AGI for various income ranges: 237.4% for AGIs below $25k, 328.1% for AGIs $25k-50k, 622.1% for AGIs $50k-75k, 1141.5% for AGIs $75k-100k, 1858.0% for AGIs $100k-200k, 10492.7% for AGIs over 200k)
Charity contributions: $16,710 (reported on 14.1% of returns)
Here:
$16,710
State:
$20,178
(% of AGI for various income ranges: 10.9% for AGIs below $25k, 36.7% for AGIs $25k-50k, 83.3% for AGIs $50k-75k, 157.7% for AGIs $75k-100k, 384.4% for AGIs $100k-200k, 5122.5% for AGIs over 200k)
Taxes paid: $6,783 (reported on 16.0% of returns)
34238:
$6,783
State:
$6,967
(% of AGI for various income ranges: 30.5% for AGIs below $25k, 57.4% for AGIs $25k-50k, 116.4% for AGIs $50k-75k, 210.2% for AGIs $75k-100k, 352.4% for AGIs $100k-200k, 1245.9% for AGIs over 200k)
Earned income credit: $1,569 (reported on 5.9% of returns)
Here:
$1,569
State:
$2,306
(% of AGI for various income ranges: 48.0% for AGIs below $25k, 29.2% for AGIs $25k-50k)
Percentage of individuals using paid preparers for their 2020 taxes: 92.0%
Here:
92%
State:
92%
(% for various income ranges: 90.8% for AGIs below $25k, 92.6% for AGIs $25k-50k, 91.1% for AGIs $50k-75k, 91.8% for AGIs $75k-100k, 92.6% for AGIs $100k-200k, 93.3% for AGIs over 200k)
Averages for the 2012 tax year for zip code 34238, filed in 2013:
Average Adjusted Gross Income (AGI) in 2012: $94,161 (Individual Income Tax Returns)
Here:
$94,161
State:
$60,316
Salary/wage: $60,753 (reported on 56.7% of returns)
Here:
$60,753
State:
$45,277
(% of AGI for various income ranges: 59.9% for AGIs below $25k, 53.0% for AGIs $25k-50k, 39.2% for AGIs $50k-75k, 33.8% for AGIs $75k-100k, 35.7% for AGIs $100k-200k, 32.2% for AGIs over 200k)
Taxable interest for individuals: $4,205 (reported on 58.5% of returns)
This zip code:
$4,205
Florida:
$3,587
(% of AGI for various income ranges: 4.5% for AGIs below $25k, 2.8% for AGIs $25k-50k, 3.0% for AGIs $50k-75k, 2.7% for AGIs $75k-100k, 2.7% for AGIs $100k-200k, 2.3% for AGIs over 200k)
Ordinary dividends: $16,382 (reported on 50.1% of returns)
Here:
$16,382
State:
$12,831
(% of AGI for various income ranges: 9.1% for AGIs below $25k, 6.7% for AGIs $25k-50k, 7.5% for AGIs $50k-75k, 7.2% for AGIs $75k-100k, 7.8% for AGIs $100k-200k, 10.3% for AGIs over 200k)
Net capital gain/loss in AGI: +$20,624 (reported on 47.3% of returns)
Here:
+$20,624
State:
+$33,493
(% of AGI for various income ranges: 0.5% for AGIs $25k-50k, 1.0% for AGIs $50k-75k, 2.4% for AGIs $75k-100k, 4.0% for AGIs $100k-200k, 21.3% for AGIs over 200k)
Profit/loss from business: +$18,472 (reported on 15.8% of returns)
Here:
+$18,472
State:
+$10,012
(% of AGI for various income ranges: 8.9% for AGIs below $25k, 3.9% for AGIs $25k-50k, 3.8% for AGIs $50k-75k, 2.1% for AGIs $75k-100k, 2.6% for AGIs $100k-200k, 2.9% for AGIs over 200k)
Taxable individual retirement arrangement distribution: $29,960 (reported on 33.6% of returns)
34238:
$29,960
Florida:
$21,544
(% of AGI for various income ranges: 10.5% for AGIs below $25k, 8.8% for AGIs $25k-50k, 9.3% for AGIs $50k-75k, 11.5% for AGIs $75k-100k, 13.9% for AGIs $100k-200k, 9.2% for AGIs over 200k)
Self-employment retirement plans: $19,062 (reported on 0.8% of returns)
34238:
$19,062
Florida:
$20,611
(% of AGI for various income ranges: 0.3% for AGIs $50k-75k, 0.2% for AGIs $100k-200k, 0.2% for AGIs over 200k)
Total itemized deductions: $26,680 (19% of AGI, reported on 44.8% of returns)
Here:
$26,680
State:
$25,533
Here:
18.6% of AGI
State:
18.0% of AGI
(% of AGI for various income ranges: 26.3% for AGIs below $25k, 16.6% for AGIs $25k-50k, 16.5% for AGIs $50k-75k, 15.2% for AGIs $75k-100k, 13.8% for AGIs $100k-200k, 8.7% for AGIs over 200k)
Charity contributions: $4,926 (reported on 40.1% of returns)
Here:
$4,926
State:
$5,698
(% of AGI for various income ranges: 1.9% for AGIs below $25k, 1.5% for AGIs $25k-50k, 2.0% for AGIs $50k-75k, 2.0% for AGIs $75k-100k, 2.2% for AGIs $100k-200k, 2.2% for AGIs over 200k)
Taxes paid: $6,891 (reported on 44.5% of returns)
34238:
$6,891
State:
$6,203
(% of AGI for various income ranges: 5.1% for AGIs below $25k, 3.6% for AGIs $25k-50k, 3.7% for AGIs $50k-75k, 3.7% for AGIs $75k-100k, 3.7% for AGIs $100k-200k, 2.6% for AGIs over 200k)
Earned income credit: $1,684 (reported on 5.9% of returns)
Here:
$1,684
State:
$2,372
(% of AGI for various income ranges: 2.3% for AGIs below $25k, 0.4% for AGIs $25k-50k)
Percentage of individuals using paid preparers for their 2012 taxes: 61.9%
Here:
62%
State:
54%
(% for various income ranges: 52.4% for AGIs below $25k, 57.1% for AGIs $25k-50k, 61.6% for AGIs $50k-75k, 66.4% for AGIs $75k-100k, 69.2% for AGIs $100k-200k, 83.5% for AGIs over 200k)
Averages for the 2004 tax year for zip code 34238, filed in 2005:
Average Adjusted Gross Income (AGI) in 2004: $87,349 (Individual Income Tax Returns)
Here:
$87,349
State:
$50,523
Salary/wage: $51,538 (reported on 57.8% of returns)
Here:
$51,538
State:
$39,563
(% of AGI for various income ranges: 6609.7% for AGIs below $10k, 48.5% for AGIs $10k-25k, 49.3% for AGIs $25k-50k, 38.2% for AGIs $50k-75k, 33.4% for AGIs $75k-100k, 30.0% for AGIs over 100k)
Taxable interest for individuals: $5,334 (reported on 71.7% of returns)
This zip code:
$5,334
Florida:
$3,211
(% of AGI for various income ranges: 1275.8% for AGIs below $10k, 9.7% for AGIs $10k-25k, 5.9% for AGIs $25k-50k, 5.7% for AGIs $50k-75k, 5.3% for AGIs $75k-100k, 3.4% for AGIs over 100k)
Taxable dividends: $9,904 (reported on 57.8% of returns)
Here:
$9,904
State:
$6,129
(% of AGI for various income ranges: 1601.6% for AGIs below $10k, 8.2% for AGIs $10k-25k, 6.3% for AGIs $25k-50k, 6.1% for AGIs $50k-75k, 6.6% for AGIs $75k-100k, 6.4% for AGIs over 100k)
Net capital gain/loss: +$30,750 (reported on 54.4% of returns)
Here:
+$30,750
State:
+$27,205
(% of AGI for various income ranges: -1021.0% for AGIs below $10k, -0.7% for AGIs $10k-25k, 1.5% for AGIs $25k-50k, 2.7% for AGIs $50k-75k, 4.5% for AGIs $75k-100k, 27.6% for AGIs over 100k)
Profit/loss from business: +$17,774 (reported on 16.2% of returns)
Here:
+$17,774
State:
+$10,634
(% of AGI for various income ranges: -127.4% for AGIs below $10k, 6.2% for AGIs $10k-25k, 4.2% for AGIs $25k-50k, 3.3% for AGIs $50k-75k, 3.5% for AGIs $75k-100k, 3.0% for AGIs over 100k)
Profit/loss from farming: +$1,182 (reported on 0.1% of returns)
Here:
+$1,182
State:
-$6,005
IRA payment deduction: $3,666 (reported on 3.9% of returns)
34238:
$3,666
Florida:
$3,082
(% of AGI for various income ranges: 59.7% for AGIs below $10k, 0.3% for AGIs $10k-25k, 0.4% for AGIs $25k-50k, 0.4% for AGIs $50k-75k, 0.2% for AGIs $75k-100k, 0.1% for AGIs over 100k)
Self-employed pension: $12,634 (reported on 1.5% of returns)
Here:
$12,634
Florida:
$15,857
(% of AGI for various income ranges: 0.2% for AGIs $25k-50k, 0.2% for AGIs $50k-75k, 0.4% for AGIs $75k-100k, 0.2% for AGIs over 100k)
Total itemized deductions: $25,685 (20% of AGI, reported on 51.3% of returns)
Here:
$25,685
State:
$20,370
Here:
20.4% of AGI
State:
20.7% of AGI
(% of AGI for various income ranges: 4080.6% for AGIs below $10k, 30.2% for AGIs $10k-25k, 22.7% for AGIs $25k-50k, 19.9% for AGIs $50k-75k, 20.1% for AGIs $75k-100k, 11.3% for AGIs over 100k)
Charity contributions deductions: $4,828 (4% of AGI, reported on 46.5% of returns)
Here:
$4,828
State:
$4,064
Here:
3.7% of AGI
State:
3.8% of AGI
(% of AGI for various income ranges: 151.6% for AGIs below $10k, 2.3% for AGIs $10k-25k, 2.3% for AGIs $25k-50k, 2.4% for AGIs $50k-75k, 2.7% for AGIs $75k-100k, 2.6% for AGIs over 100k)
Total tax: $16,491 (reported on 82.1% of returns)
34238:
$16,491
State:
$9,431
(% of AGI for various income ranges: 300.0% for AGIs below $10k, 4.1% for AGIs $10k-25k, 7.1% for AGIs $25k-50k, 9.8% for AGIs $50k-75k, 10.7% for AGIs $75k-100k, 18.9% for AGIs over 100k)
Earned income credit: $1,182 (reported on 4.5% of returns)
Here:
$1,182
State:
$1,808
Percentage of individuals using paid preparers for their 2004 taxes: 67.1%
Here:
67%
State:
60%
(% for various income ranges: 62.2% for AGIs below $10k, 61.9% for AGIs $10k-25k, 66.0% for AGIs $25k-50k, 65.7% for AGIs $50k-75k, 67.0% for AGIs $75k-100k, 76.6% for AGIs over 100k)
Likely homosexual households (counted as self-reported same-sex unmarried-partner households)
Lesbian couples: 0.0% of all households
Gay men: 0.1% of all households
Household received Food Stamps/SNAP in the past 12 months: 131 Household did not receive Food Stamps/SNAP in the past 12 months: 11,684
Women who had a birth in the past 12 months: 46 (18 now married, 26 unmarried) Women who did not have a birth in the past 12 months: 2,441 (1,258 now married, 1,183 unmarried)
Housing units in zip code 34238 with a mortgage: 3,695 (270 second mortgage, 180 both second mortgage and home equity loan) Houses without a mortgage: 126
Median monthly owner costs for units with a mortgage: $2,316 Median monthly owner costs for units without a mortgage: $853
Residents with income below the poverty level in 2022:
This zip code:
5.1%
Whole state:
12.7%
Residents with income below 50% of the poverty level in 2022:
This zip code:
1.2%
Whole state:
6.6%
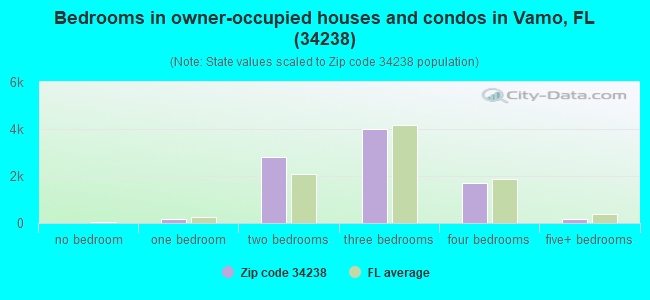
Median number of rooms in houses and condos:
Here:
6.0
State:
5.9
Median number of rooms in apartments:
Here:
4.1
State:
4.2
Notable locations in this zip code not listed on our city pages
Notable locations in zip code 34238: Sarasota County Fire Department Station 14 (A), Intensive Air (B), Sarasota Police Department Community Policing Station (C). Display/hide their locations on the map
Tourist attraction (not listed on the city page) : International Introductions (Cultural Attractions- Events- & Facilities; 8308 jesolo lane) (1). Display/hide its approximate location on the map
In group quarters: 267 (-1 institutionalized population)
Size of family households: 5,587 2-persons, 1,135 3-persons, 606 4-persons, 176 5-persons, 13 6-persons, 43 7-or-more-persons
Size of nonfamily households: 3,610 1-person, 482 2-persons, 53 3-persons
1,745 married couples with children.
523 single-parent households (113 men, 410 women).
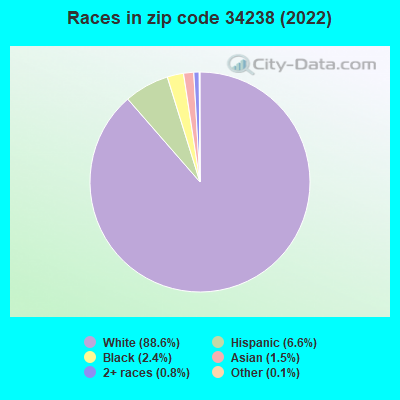
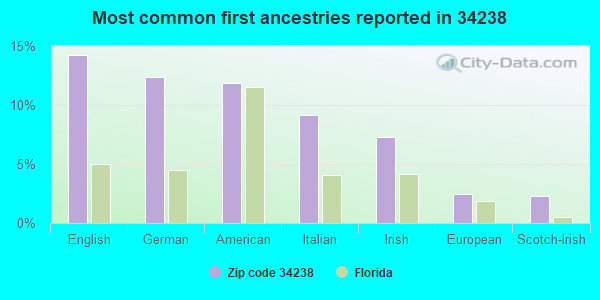
87.3% of residents of 34238 zip code speak English at home.
4.3% of residents speak Spanish at home (59% very well, 14% well, 16% not well, 11% not at all).
6.6% of residents speak other Indo-European language at home (75% very well, 19% well, 5% not well, 2% not at all).
1.2% of residents speak Asian or Pacific Island language at home (74% very well, 6% well, 18% not well, 2% not at all).
1.5% of residents speak other language at home (78% very well, 17% well, 6% not well).
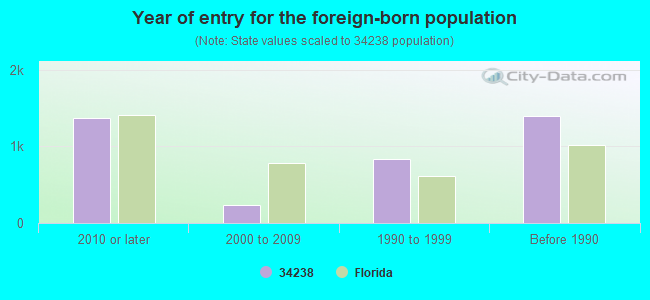
Foreign born population: 3,490 (15.1%) (66.6% of them are naturalized citizens)
Major facilities with environmental interests located in this zip code:
SARASOTA YMCA AQUATIC CENTER EXPANSION (8301 POTTER PARK DR in SARASOTA, FL)
STATE MASTER (FDM) - WAFR-FL0276359, INDUSTRIAL WASTEWATER PROGRAM National Pollutant Discharge Elimination System NON-MAJOR (Tracking pollutant discharge elimination systems) - permit Business SIC classification: BUSINESS SERVICES Organizations: SARASOTA FAMILY YMCA, INC., DAVE TICHENOR (CONTACT/OWNER)
Alternative names: SARASOTA FAMILY YMCA, INC -EVALYN SADLIER JONES BRANCH
RECREATIONAL WHSE INC (6165 S MCINTOSH RD in SARASOTA, FL)
(Integrated Compliance Information System) - ICIS-04-1998-0413, FORMAL ENFORCEMENT ACTION COMPLIANCE ACTIVITY (Tracking inspections of insecticide, fungicide, and rodenticide, and toxic substances) Business SIC classification: SPECIALTY CLEANING, POLISHING, AND SANITATION PREPARATIONS; CHEMICALS AND CHEMICAL PREPARATIONS; RETAIL NURSERIES, LAWN AND GARDEN SUPPLY STORES
ARTISAN SIGNS INC (4063 S TAMIAMI TRAIL in SARASOTA, FL)
National Pollutant Discharge Elimination System NON-MAJOR (Tracking pollutant discharge elimination systems) - permit Small Quantity Generators, between 100 kg and 1000 kg of hazardous waste/month (Resource Conservation and Recovery Act (tracking hazardous waste)) - notification Business SIC classification: SIGNS AND ADVERTISING SPECIALTIES Organizations: SPETH PATRICIA S BOOKKEEPER (CONTACT/OWNER)
Alternative names: TYGATE, INC DBA ARTISAN SIGNS
ISLES OF SARASOTA, PHASE 1 (HONORE AVE/AVIANO LN in SARASOTA, FL)
National Pollutant Discharge Elimination System NON-MAJOR (Tracking pollutant discharge elimination systems) - permit Organizations: JEFFREY BLOCH (CONTACT/OWNER)
ISLES OF SARASOTA, PHASES 2A, (BENEVENTO DR/AVIANO LN in SARASOTA, FL)
National Pollutant Discharge Elimination System NON-MAJOR (Tracking pollutant discharge elimination systems) - permit Organizations: JEFFREY BLOCH (CONTACT/OWNER)
PALMER CROSSING, PARCEL A (CLARK RD in SARASOTA, FL)
National Pollutant Discharge Elimination System NON-MAJOR (Tracking pollutant discharge elimination systems) - permit Organizations: WILLIAM SABA (CONTACT/OWNER)
ALROE FLEX SPACE (LOT 17 CLARK CENTER AVE in SARASOTA, FL)
National Pollutant Discharge Elimination System NON-MAJOR (Tracking pollutant discharge elimination systems) - permit Organizations: ALLAN LEHTO (CONTACT/OWNER)
AM SOUTH BANK - SARASOTA MALL ( in SARASOTA, FL)
National Pollutant Discharge Elimination System NON-MAJOR (Tracking pollutant discharge elimination systems) - permit Organizations: GREGORY HARRIS (CONTACT/OWNER)
MICHAEL THE CLEANER (8262 TAMIAMI TR S in SARASOTA, FL)
(Resource Conservation and Recovery Act (tracking hazardous waste)) Organizations: STEUER MICHAEL (CONTACT/OWNER)
PALMER OAKS - PHASE II ( in SARASOTA, FL)
National Pollutant Discharge Elimination System NON-MAJOR (Tracking pollutant discharge elimination systems) - permit Organizations: DARLENE THIBODEAU (CONTACT/OWNER)
National Pollutant Discharge Elimination System NON-MAJOR (Tracking pollutant discharge elimination systems) - permit Organizations: RICHARD JOUDREY (CONTACT/OWNER)
PERFECT MOTION (6225 MCINTOSH RD in SARASOTA, FL)
(Resource Conservation and Recovery Act (tracking hazardous waste)) Business NAICS classification: GENERAL AUTOMOTIVE REPAIR.; AUTOMOTIVE BODY, PAINT, AND INTERIOR REPAIR AND MAINTENANCE. Organizations: JEFFREY FELLMAN (CONTACT/OWNER)
Housing units lacking complete plumbing facilities: 0.3% Housing units lacking complete kitchen facilities: 2.5%
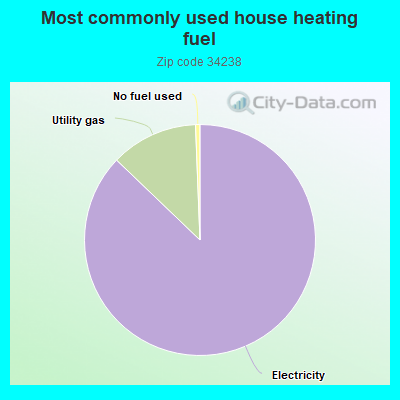
86.3%Electricity
12.1%Utility gas
0.6%No fuel used
Population in 1990: 5,493. Population change in the 1990s: +8,549 (+155.6%).
Place of birth for U.S.-born residents:
This state: 2,689
Northeast: 8,501
Midwest: 5,327
South: 2,208
West: 563
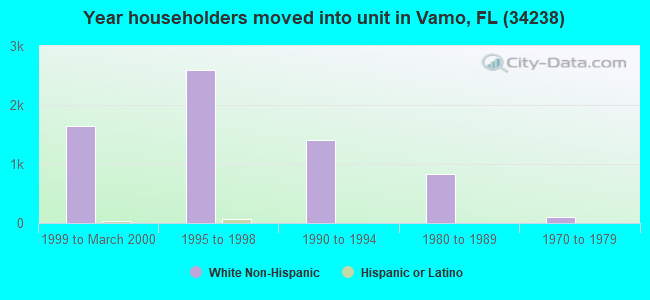
37% of the 34238 zip code residents lived in the same house 5 years ago. Out of people who lived in different houses, 38% lived in this county. Out of people who lived in different counties, 50% lived in Florida.
84% of the 34238 zip code residents lived in the same house 1 year ago. Out of people who lived in different houses, 37% moved from this county. Out of people who lived in different houses, 14% moved from different county within same state. Out of people who lived in different houses, 39% moved from different state. Out of people who lived in different houses, 12% moved from abroad.
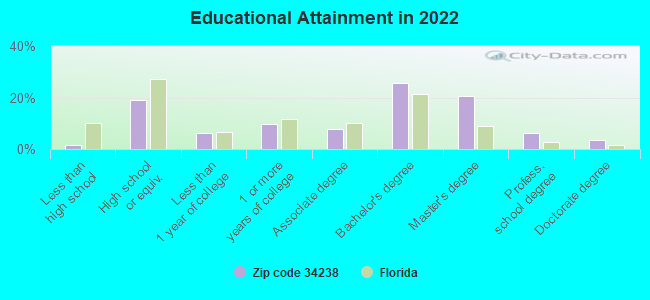
Private vs. public school enrollment:
Students in private schools in grades 1 to 8 (elementary and middle school): 171
Here:
19.3%
Florida:
15.8%
Students in private schools in grades 9 to 12 (high school):
Here:
0.0%
Florida:
12.9%
Students in private undergraduate colleges: 17
Here:
6.6%
Florida:
23.6%
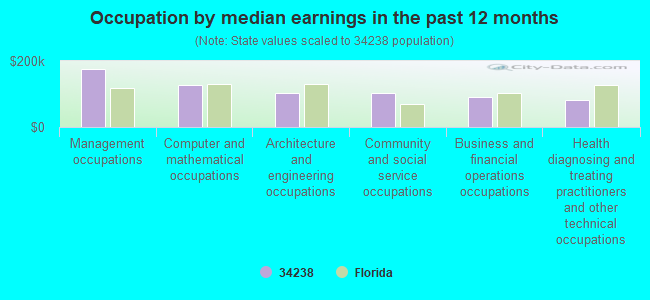
Occupation by median earnings in the past 12 months ($)
175,851Management occupations
126,671Computer and mathematical occupations
102,919Architecture and engineering occupations
101,969Community and social service occupations
89,890Business and financial operations occupations
82,240Health diagnosing and treating practitioners and other technical occupations
Companies with federal contracts located in this zip code:
VALERGA STANISLAUS R P (3710 PRAIRIE DUNES DR in SARAGOTA, FL) : $202,998 in 9 contractsfrom 2002 to 2005
Contracts for Personal Services Contracts by Departmental Offices Signed by year:2000: $0; 2001: $0; 2002: $123,000; 2003: $140,438; 2004: -$66,899; 2005: $6,459; 2006: $0.
Biggest contracts:
$114,000 with Departmental Offices for Personal Services Contracts. Taking place in DC. Signed on 2002-02-15. Completion date: 2003-02-15.
$103,063, same as above.Signed on 2003-05-15. Completion date: 2004-02-15.
$26,664, same as above.Signed on 2003-04-15. Completion date: 2004-02-15.
$10,711, same as above.Signed on 2003-02-15. Completion date: 2004-02-15.
ALPHA MANAGEMENT SOLUTIONS INC (4791 HANGING MOSS LN in SARASOTA, FL; small business)
$163,000 with Army for Educational Services. Signed on 2005-09-21. Completion date: 2008-08-30.
SAGUARO COMPUTER SERVICES (8499 S TAMIAMI TR in SARASOTA, FL; small business)
$82,875 with Navy for ADP Components. Signed on 2001-11-15. Completion date: 2001-11-15.
THE CBT WORKSHOP (4913 SABAL LAKE CIR in SARASOTA, FL; small business) : $49,994 in 3 contractsfrom 2003 to 2005
$36,995 with Department of Defense for ADP Software. Taking place in VA. Signed on 2003-09-06. Completion date: 2003-09-26.
$12,999 with Defense Contract Management Agency for ADP Software. Signed on 2005-11-16. Completion date: 2006-09-30.
$0, same as above.Signed on 2005-11-16. Completion date: 2006-09-30.
CANUSA CUTTING TOOLS INC (4957 GARDINERS BAY CIRCLE in SARASOTA, FL; small business)
$8,646 with Navy for Hand Tools, Nonedged, Nonpowered. Signed on 2005-05-24. Completion date: 2005-07-05.
R F CARLSON COMPANY INC (6551 PALMER PARK CIR in SARASOTA, FL; small business)
$2,631 with Navy for Electrical Hardware and Supplies. Signed on 2005-02-02. Completion date: 2005-05-02.
Top industries in this zip code by the number of employees in 2005:
Health Care and Social Assistance: Nursing Care Facilities (100-249 employees: 1 establishment, 50-99 employees: 1 establishment, 20-49 employees: 1 establishment)
Arts, Entertainment, and Recreation: Golf Courses and Country Clubs (100-249: 1, 50-99: 1)
Health Care and Social Assistance: Home Health Care Services (100-249: 1, 20-49: 2)
Arts, Entertainment, and Recreation: Fitness and Recreational Sports Centers (100-249: 1, 20-49: 1, 10-19: 1)
Health Care and Social Assistance: Homes for the Elderly (100-249: 1, 20-49: 1)
People in group quarters in 2010:
157 people in nursing facilities/skilled-nursing facilities
People in group quarters in 2000:
132 people in nursing homes
99 people in other noninstitutional group quarters
37 people in mental (psychiatric) hospitals or wards
Fatal accident statistics in 2014:
Fatal accident count: 4
Vehicles involved in fatal accidents: 5
Fatal accidents caused by drunken drivers: 0
Fatalities: 4
Persons involved in fatal accidents: 10
Pedestrians involved in fatal accidents: 2
Fatal accident statistics in 2013:
Fatal accident count: 2
Vehicles involved in fatal accidents: 4
Fatal accidents caused by drunken drivers: 0
Fatalities: 2
Persons involved in fatal accidents: 8
Pedestrians involved in fatal accidents: 0
Home Mortgage Disclosure Act Aggregated Statistics For Year 2009 (Based on 2 full and 2 partial tracts)
A) FHA, FSA/RHS & VA Home Purchase Loans
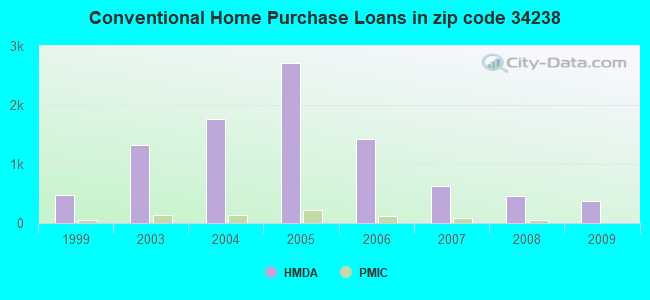
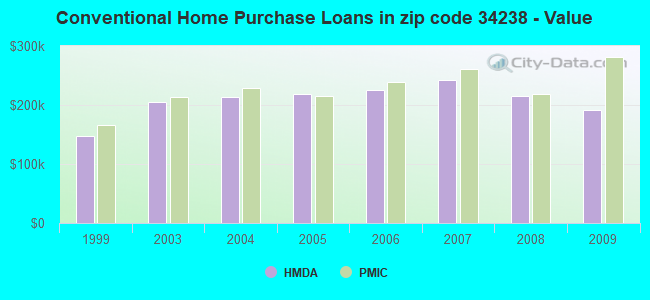
B) Conventional Home Purchase Loans
C) Refinancings
D) Home Improvement Loans
E) Loans on Dwellings For 5+ Families
F) Non-occupant Loans on < 5 Family Dwellings (A B C & D)
G) Loans On Manufactured Home Dwelling (A B C & D)
Number
Average Value
Number
Average Value
Number
Average Value
Number
Average Value
Number
Average Value
Number
Average Value
Number
Average Value
LOANS ORIGINATED
21
$197,028
379
$191,014
664
$222,188
15
$49,499
2
$5,417,870
347
$187,115
4
$247,308
APPLICATIONS APPROVED, NOT ACCEPTED
4
$99,022
36
$200,451
79
$234,079
2
$14,930
0
$0
20
$200,658
2
$87,580
APPLICATIONS DENIED
8
$224,896
49
$170,495
260
$237,013
8
$94,645
0
$0
79
$174,983
0
$0
APPLICATIONS WITHDRAWN
8
$199,359
58
$182,714
167
$221,347
0
$0
0
$0
66
$178,006
0
$0
FILES CLOSED FOR INCOMPLETENESS
4
$214,465
6
$159,563
26
$216,659
0
$0
0
$0
18
$173,607
0
$0
Aggregated Statistics For Year 2008 (Based on 2 full and 2 partial tracts)
A) FHA, FSA/RHS & VA Home Purchase Loans
B) Conventional Home Purchase Loans
C) Refinancings
D) Home Improvement Loans
F) Non-occupant Loans on < 5 Family Dwellings (A B C & D)
G) Loans On Manufactured Home Dwelling (A B C & D)
Number
Average Value
Number
Average Value
Number
Average Value
Number
Average Value
Number
Average Value
Number
Average Value
LOANS ORIGINATED
32
$234,151
454
$215,893
316
$239,435
14
$137,361
278
$202,142
4
$55,730
APPLICATIONS APPROVED, NOT ACCEPTED
2
$122,320
69
$221,579
84
$201,323
3
$125,653
44
$213,789
4
$36,325
APPLICATIONS DENIED
2
$151,415
57
$203,749
207
$293,356
26
$183,722
54
$204,395
4
$64,073
APPLICATIONS WITHDRAWN
6
$205,070
65
$192,605
83
$274,968
4
$215,305
36
$194,232
0
$0
FILES CLOSED FOR INCOMPLETENESS
0
$0
26
$247,768
27
$246,966
0
$0
10
$176,349
0
$0
Aggregated Statistics For Year 2007 (Based on 2 full and 2 partial tracts)
A) FHA, FSA/RHS & VA Home Purchase Loans
B) Conventional Home Purchase Loans
C) Refinancings
D) Home Improvement Loans
F) Non-occupant Loans on < 5 Family Dwellings (A B C & D)
G) Loans On Manufactured Home Dwelling (A B C & D)
Number
Average Value
Number
Average Value
Number
Average Value
Number
Average Value
Number
Average Value
Number
Average Value
LOANS ORIGINATED
18
$220,663
630
$242,621
557
$255,803
38
$113,680
400
$234,396
0
$0
APPLICATIONS APPROVED, NOT ACCEPTED
0
$0
117
$201,980
141
$283,574
19
$141,649
72
$202,563
2
$29,855
APPLICATIONS DENIED
0
$0
128
$201,956
375
$268,060
59
$197,331
169
$194,860
2
$33,005
APPLICATIONS WITHDRAWN
0
$0
81
$226,618
171
$276,818
9
$63,569
64
$218,478
0
$0
FILES CLOSED FOR INCOMPLETENESS
0
$0
37
$233,066
44
$281,593
6
$134,697
22
$226,363
0
$0
Aggregated Statistics For Year 2006 (Based on 2 full and 2 partial tracts)
B) Conventional Home Purchase Loans
C) Refinancings
D) Home Improvement Loans
F) Non-occupant Loans on < 5 Family Dwellings (A B C & D)
G) Loans On Manufactured Home Dwelling (A B C & D)
Number
Average Value
Number
Average Value
Number
Average Value
Number
Average Value
Number
Average Value
LOANS ORIGINATED
1,421
$225,173
665
$270,899
98
$210,298
810
$219,813
12
$49,078
APPLICATIONS APPROVED, NOT ACCEPTED
200
$236,452
133
$277,097
14
$135,489
104
$215,779
4
$62,698
APPLICATIONS DENIED
317
$178,498
234
$303,114
44
$185,845
177
$163,923
6
$48,935
APPLICATIONS WITHDRAWN
203
$198,879
192
$302,372
11
$282,905
131
$182,191
0
$0
FILES CLOSED FOR INCOMPLETENESS
42
$237,637
70
$276,186
4
$92,865
30
$180,463
0
$0
Aggregated Statistics For Year 2005 (Based on 2 full and 2 partial tracts)
A) FHA, FSA/RHS & VA Home Purchase Loans
B) Conventional Home Purchase Loans
C) Refinancings
D) Home Improvement Loans
F) Non-occupant Loans on < 5 Family Dwellings (A B C & D)
G) Loans On Manufactured Home Dwelling (A B C & D)
Number
Average Value
Number
Average Value
Number
Average Value
Number
Average Value
Number
Average Value
Number
Average Value
LOANS ORIGINATED
0
$0
2,718
$218,812
805
$244,928
59
$156,407
1,674
$196,233
8
$69,415
APPLICATIONS APPROVED, NOT ACCEPTED
0
$0
309
$223,575
120
$229,542
12
$269,468
175
$217,637
6
$86,670
APPLICATIONS DENIED
0
$0
627
$201,977
253
$259,803
38
$123,542
398
$170,769
8
$118,592
APPLICATIONS WITHDRAWN
2
$122,410
315
$183,172
127
$255,754
33
$200,697
184
$169,161
2
$28,245
FILES CLOSED FOR INCOMPLETENESS
0
$0
86
$220,655
114
$255,157
2
$153,260
49
$178,956
0
$0
Aggregated Statistics For Year 2004 (Based on 2 full and 2 partial tracts)
A) FHA, FSA/RHS & VA Home Purchase Loans
B) Conventional Home Purchase Loans
C) Refinancings
D) Home Improvement Loans
F) Non-occupant Loans on < 5 Family Dwellings (A B C & D)
G) Loans On Manufactured Home Dwelling (A B C & D)
Number
Average Value
Number
Average Value
Number
Average Value
Number
Average Value
Number
Average Value
Number
Average Value
LOANS ORIGINATED
0
$0
1,771
$214,255
726
$200,561
36
$98,785
882
$182,820
13
$42,645
APPLICATIONS APPROVED, NOT ACCEPTED
0
$0
183
$216,911
111
$197,141
8
$57,289
104
$186,278
2
$16,920
APPLICATIONS DENIED
2
$97,530
237
$196,043
186
$234,598
33
$66,628
97
$175,589
12
$46,632
APPLICATIONS WITHDRAWN
2
$105,015
188
$187,115
149
$197,118
13
$156,922
103
$178,165
2
$90,565
FILES CLOSED FOR INCOMPLETENESS
0
$0
31
$302,167
80
$214,360
2
$300,960
28
$182,904
2
$290,600
Aggregated Statistics For Year 2003 (Based on 2 full and 2 partial tracts)
A) FHA, FSA/RHS & VA Home Purchase Loans
B) Conventional Home Purchase Loans
C) Refinancings
D) Home Improvement Loans
E) Loans on Dwellings For 5+ Families
F) Non-occupant Loans on < 5 Family Dwellings (A B C & D)
Number
Average Value
Number
Average Value
Number
Average Value
Number
Average Value
Number
Average Value
Number
Average Value
LOANS ORIGINATED
2
$199,590
1,330
$205,828
2,184
$172,125
32
$41,088
2
$14,231,360
851
$170,958
APPLICATIONS APPROVED, NOT ACCEPTED
2
$135,250
127
$178,896
275
$179,521
15
$92,097
0
$0
58
$144,541
APPLICATIONS DENIED
0
$0
92
$193,384
260
$191,640
20
$104,728
0
$0
45
$168,426
APPLICATIONS WITHDRAWN
0
$0
91
$238,998
192
$196,628
8
$29,856
0
$0
45
$201,746
FILES CLOSED FOR INCOMPLETENESS
0
$0
31
$196,373
53
$183,395
2
$27,630
0
$0
18
$158,793
Aggregated Statistics For Year 1999 (Based on 1 full tract)
A) FHA, FSA/RHS & VA Home Purchase Loans
B) Conventional Home Purchase Loans
C) Refinancings
D) Home Improvement Loans
E) Loans on Dwellings For 5+ Families
F) Non-occupant Loans on < 5 Family Dwellings (A B C & D)
Detailed PMIC statistics for the following Tracts:0020.04
, 0020.06
2002 - 2018 National Fire Incident Reporting System (NFIRS) incidents
According to the data from the years 2002 - 2018 the average number of fires per year is 21. The highest number of fires - 37 took place in 2018, and the least - 0 in 2004. The data has a rising trend.
When looking into fire subcategories, the most reports belonged to: Outside Fires (43.8%), and Structure Fires (26.0%).
Fire incident types reported to NFIRS in Zip Code 34238


+$1,182
-$6,005
 Nearest zip codes: 34233, 34229, 34231, 34242, 34232, 34239.
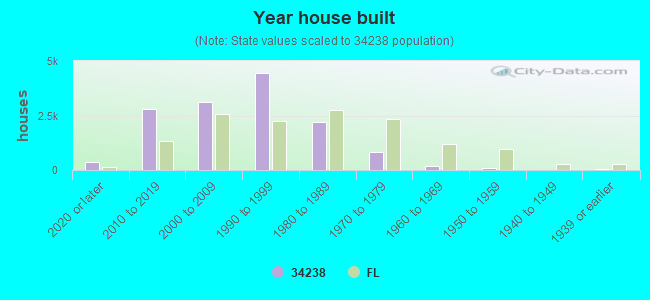


 According to the data from the years 2002 - 2018 the average number of fires per year is 21. The highest number of fires - 37 took place in 2018, and the least - 0 in 2004. The data has a rising trend.
 When looking into fire subcategories, the most reports belonged to: Outside Fires (43.8%), and Structure Fires (26.0%).