Races in Greensboro, North Carolina (NC) Detailed Stats
Data:
Races - White alone (%)
Races - White alone (% change since 2000)
Races - Black alone (%)
Races - Black alone (% change since 2000)
Races - American Indian alone (%)
Races - American Indian alone (% change since 2000)
Races - Asian alone (%)
Races - Asian alone (% change since 2000)
Races - Hispanic (%)
Races - Hispanic (% change since 2000)
Races - Native Hawaiian and Other Pacific Islander alone (%)
Races - Native Hawaiian and Other Pacific Islander alone (% change since 2000)
Races - Two or more races(%)
Races - Two or more races(% change since 2000)
Races - Other race alone (%)
Races - Other race alone (% change since 2000)
Racial diversity
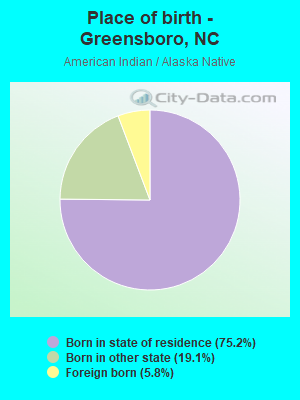
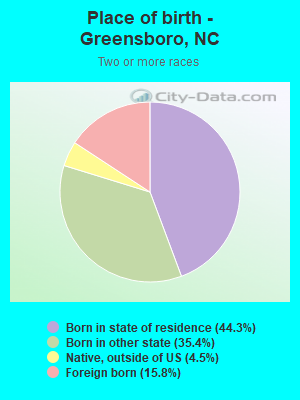
Place of birth - Born in state of residence (%)
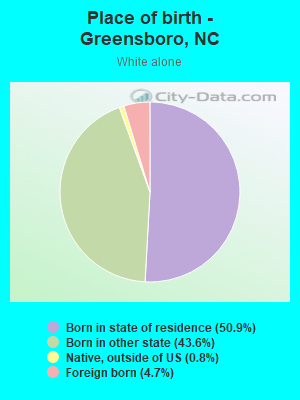
Place of birth - Born in state of residence (%) - White
Place of birth - Born in state of residence (%) - Black or African American
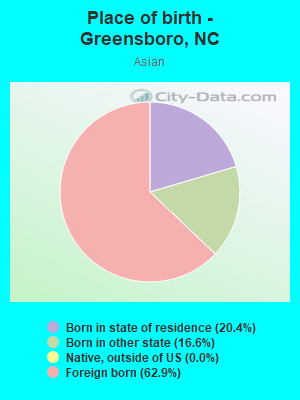
Place of birth - Born in state of residence (%) - Asian
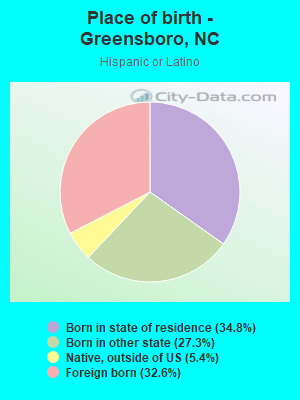
Place of birth - Born in state of residence (%) - Hispanic or Latino
Place of birth - Born in state of residence (%) - American Indian and Alaska Native
Place of birth - Born in state of residence (%) - Multirace
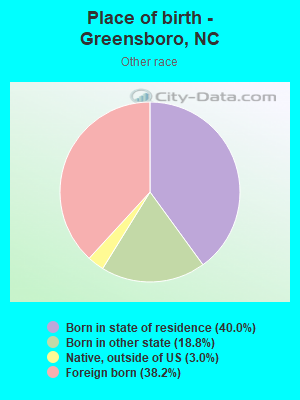
Place of birth - Born in state of residence (%) - Other Race
Place of birth - Born in other state (%)
Place of birth - Born in other state (%) - White
Place of birth - Born in other state (%) - Black or African American
Place of birth - Born in other state (%) - Asian
Place of birth - Born in other state (%) - Hispanic or Latino
Place of birth - Born in other state (%) - American Indian and Alaska Native
Place of birth - Born in other state (%) - Multirace
Place of birth - Born in other state (%) - Other Race
Place of birth - Native, outside of US (%)
Place of birth - Native, outside of US (%) - White
Place of birth - Native, outside of US (%) - Black or African American
Place of birth - Native, outside of US (%) - Asian
Place of birth - Native, outside of US (%) - Hispanic or Latino
Place of birth - Native, outside of US (%) - American Indian and Alaska Native
Place of birth - Native, outside of US (%) - Multirace
Place of birth - Native, outside of US (%) - Other Race
Place of birth - Foreign born (%)
Place of birth - Foreign born (%) - White
Place of birth - Foreign born (%) - Black or African American
Place of birth - Foreign born (%) - Asian
Place of birth - Foreign born (%) - Hispanic or Latino
Place of birth - Foreign born (%) - American Indian and Alaska Native
Place of birth - Foreign born (%) - Multirace
Place of birth - Foreign born (%) - Other Race
Residents speaking English at home (%)
Residents speaking English at home - Born in the United States (%)
Residents speaking English at home - Native, born elsewhere (%)
Residents speaking English at home - Foreign born (%)
Residents speaking Spanish at home (%)
Residents speaking Spanish at home - Born in the United States (%)
Residents speaking Spanish at home - Native, born elsewhere (%)
Residents speaking Spanish at home - Foreign born (%)
Residents speaking other language at home (%)
Residents speaking other language at home - Born in the United States (%)
Residents speaking other language at home - Native, born elsewhere (%)
Residents speaking other language at home - Foreign born (%)
Marital status - Never married (%)
Marital status - Now married (%)
Marital status - Separated (%)
Marital status - Widowed (%)
Marital status - Divorced (%)
Ancestries Reported - Arab (%)
Ancestries Reported - Czech (%)
Ancestries Reported - Danish (%)
Ancestries Reported - Dutch (%)
Ancestries Reported - English (%)
Ancestries Reported - French (%)
Ancestries Reported - French Canadian (%)
Ancestries Reported - German (%)
Ancestries Reported - Greek (%)
Ancestries Reported - Hungarian (%)
Ancestries Reported - Irish (%)
Ancestries Reported - Italian (%)
Ancestries Reported - Lithuanian (%)
Ancestries Reported - Norwegian (%)
Ancestries Reported - Polish (%)
Ancestries Reported - Portuguese (%)
Ancestries Reported - Russian (%)
Ancestries Reported - Scotch-Irish (%)
Ancestries Reported - Scottish (%)
Ancestries Reported - Slovak (%)
Ancestries Reported - Subsaharan African (%)
Ancestries Reported - Swedish (%)
Ancestries Reported - Swiss (%)
Ancestries Reported - Ukrainian (%)
Ancestries Reported - United States (%)
Ancestries Reported - Welsh (%)
Ancestries Reported - West Indian (%)
Ancestries Reported - Other (%)
Geographical mobility - Same house 1 year ago (%)
Geographical mobility - Same house 1 year ago (%) - White
Geographical mobility - Same house 1 year ago (%) - Black or African American
Geographical mobility - Same house 1 year ago (%) - Asian
Geographical mobility - Same house 1 year ago (%) - Hispanic or Latino
Geographical mobility - Same house 1 year ago (%) - American Indian and Alaska Native
Geographical mobility - Same house 1 year ago (%) - Multirace
Geographical mobility - Same house 1 year ago (%) - Other Race
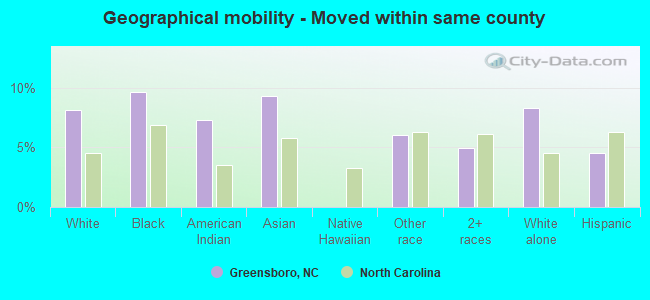
Geographical mobility - Moved within same county (%)
Geographical mobility - Moved within same county (%) - White
Geographical mobility - Moved within same county (%) - Black or African American
Geographical mobility - Moved within same county (%) - Asian
Geographical mobility - Moved within same county (%) - Hispanic or Latino
Geographical mobility - Moved within same county (%) - American Indian and Alaska Native
Geographical mobility - Moved within same county (%) - Multirace
Geographical mobility - Moved within same county (%) - Other Race
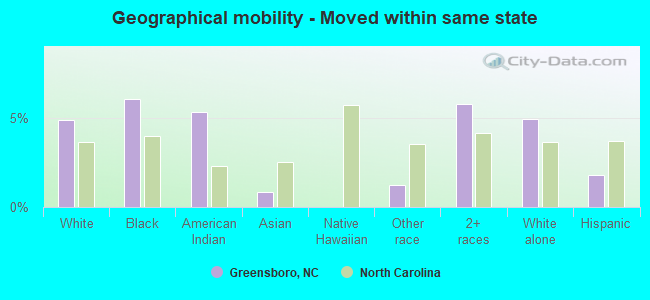
Geographical mobility - Moved from different county within same state (%)
Geographical mobility - Moved from different county within same state (%) - White
Geographical mobility - Moved from different county within same state (%) - Black or African American
Geographical mobility - Moved from different county within same state (%) - Asian
Geographical mobility - Moved from different county within same state (%) - Hispanic or Latino
Geographical mobility - Moved from different county within same state (%) - American Indian and Alaska Native
Geographical mobility - Moved from different county within same state (%) - Multirace
Geographical mobility - Moved from different county within same state (%) - Other Race
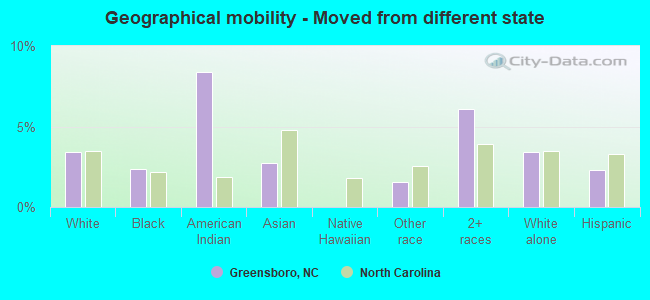
Geographical mobility - Moved from different state (%)
Geographical mobility - Moved from different state (%) - White
Geographical mobility - Moved from different state (%) - Black or African American
Geographical mobility - Moved from different state (%) - Asian
Geographical mobility - Moved from different state (%) - Hispanic or Latino
Geographical mobility - Moved from different state (%) - American Indian and Alaska Native
Geographical mobility - Moved from different state (%) - Multirace
Geographical mobility - Moved from different state (%) - Other Race
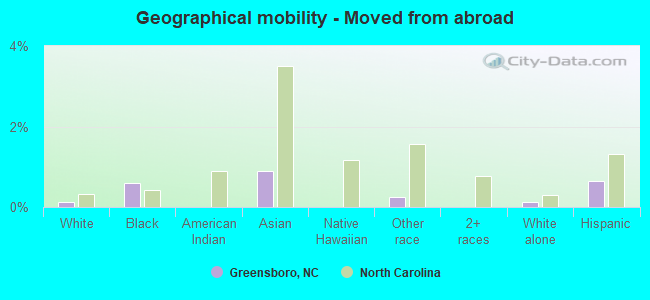
Geographical mobility - Moved from abroad (%)
Geographical mobility - Moved from abroad (%) - White
Geographical mobility - Moved from abroad (%) - Black or African American
Geographical mobility - Moved from abroad (%) - Asian
Geographical mobility - Moved from abroad (%) - Hispanic or Latino
Geographical mobility - Moved from abroad (%) - American Indian and Alaska Native
Geographical mobility - Moved from abroad (%) - Multirace
Geographical mobility - Moved from abroad (%) - Other Race
Place of birth for the foreign-born population - Ireland (%)
Place of birth for the foreign-born population - Denmark (%)
Place of birth for the foreign-born population - Norway (%)
Place of birth for the foreign-born population - Sweden (%)
Place of birth for the foreign-born population - United Kingdom (%)
Place of birth for the foreign-born population - England (%)
Place of birth for the foreign-born population - Scotland (%)
Place of birth for the foreign-born population - Other Northern Europe (%)
Place of birth for the foreign-born population - Austria (%)
Place of birth for the foreign-born population - Belgium (%)
Place of birth for the foreign-born population - France (%)
Place of birth for the foreign-born population - Germany (%)
Place of birth for the foreign-born population - Netherlands (%)
Place of birth for the foreign-born population - Switzerland (%)
Place of birth for the foreign-born population - Other Western Europe (%)
Place of birth for the foreign-born population - Greece (%)
Place of birth for the foreign-born population - Italy (%)
Place of birth for the foreign-born population - Portugal (%)
Place of birth for the foreign-born population - Spain (%)
Place of birth for the foreign-born population - Other Southern Europe (%)
Place of birth for the foreign-born population - Albania (%)
Place of birth for the foreign-born population - Belarus (%)
Place of birth for the foreign-born population - Bosnia and Herzegovina (%)
Place of birth for the foreign-born population - Bulgaria (%)
Place of birth for the foreign-born population - Croatia (%)
Place of birth for the foreign-born population - Czechoslovakia (%)
Place of birth for the foreign-born population - Hungary (%)
Place of birth for the foreign-born population - Latvia (%)
Place of birth for the foreign-born population - Lithuania (%)
Place of birth for the foreign-born population - North Macedonia (Macedonia) (%)
Place of birth for the foreign-born population - Moldova (%)
Place of birth for the foreign-born population - Poland (%)
Place of birth for the foreign-born population - Romania (%)
Place of birth for the foreign-born population - Russia (%)
Place of birth for the foreign-born population - Serbia (%)
Place of birth for the foreign-born population - Ukraine (%)
Place of birth for the foreign-born population - Other Eastern Europe (%)
Place of birth for the foreign-born population - China (%)
Place of birth for the foreign-born population - Hong Kong (%)
Place of birth for the foreign-born population - Taiwan (%)
Place of birth for the foreign-born population - Japan (%)
Place of birth for the foreign-born population - Korea (%)
Place of birth for the foreign-born population - Other Eastern Asia (%)
Place of birth for the foreign-born population - Afghanistan (%)
Place of birth for the foreign-born population - Bangladesh (%)
Place of birth for the foreign-born population - India (%)
Place of birth for the foreign-born population - Iran (%)
Place of birth for the foreign-born population - Kazakhstan (%)
Place of birth for the foreign-born population - Nepal (%)
Place of birth for the foreign-born population - Pakistan (%)
Place of birth for the foreign-born population - Sri Lanka (%)
Place of birth for the foreign-born population - Uzbekistan (%)
Place of birth for the foreign-born population - Other South Central Asia (%)
Place of birth for the foreign-born population - Burma (%)
Place of birth for the foreign-born population - Cambodia (%)
Place of birth for the foreign-born population - Indonesia (%)
Place of birth for the foreign-born population - Laos (%)
Place of birth for the foreign-born population - Malaysia (%)
Place of birth for the foreign-born population - Philippines (%)
Place of birth for the foreign-born population - Singapore (%)
Place of birth for the foreign-born population - Thailand (%)
Place of birth for the foreign-born population - Vietnam (%)
Place of birth for the foreign-born population - Other South Eastern Asia (%)
Place of birth for the foreign-born population - Armenia (%)
Place of birth for the foreign-born population - Iraq (%)
Place of birth for the foreign-born population - Israel (%)
Place of birth for the foreign-born population - Jordan (%)
Place of birth for the foreign-born population - Kuwait (%)
Place of birth for the foreign-born population - Lebanon (%)
Place of birth for the foreign-born population - Saudi Arabia (%)
Place of birth for the foreign-born population - Syria (%)
Place of birth for the foreign-born population - Turkey (%)
Place of birth for the foreign-born population - Yemen (%)
Place of birth for the foreign-born population - Other Western Asia (%)
Place of birth for the foreign-born population - Eritrea (%)
Place of birth for the foreign-born population - Ethiopia (%)
Place of birth for the foreign-born population - Kenya (%)
Place of birth for the foreign-born population - Somalia (%)
Place of birth for the foreign-born population - Uganda (%)
Place of birth for the foreign-born population - Zimbabwe (%)
Place of birth for the foreign-born population - Other Eastern Africa (%)
Place of birth for the foreign-born population - Cameroon (%)
Place of birth for the foreign-born population - Congo (%)
Place of birth for the foreign-born population - Democratic Republic of Congo (Zaire) (%)
Place of birth for the foreign-born population - Other Middle Africa (%)
Place of birth for the foreign-born population - Egypt (%)
Place of birth for the foreign-born population - Morocco (%)
Place of birth for the foreign-born population - Sudan (%)
Place of birth for the foreign-born population - Other Northern Africa (%)
Place of birth for the foreign-born population - South Africa (%)
Place of birth for the foreign-born population - Other Southern Africa (%)
Place of birth for the foreign-born population - Cabo Verde (%)
Place of birth for the foreign-born population - Ghana (%)
Place of birth for the foreign-born population - Liberia (%)
Place of birth for the foreign-born population - Nigeria (%)
Place of birth for the foreign-born population - Senegal (%)
Place of birth for the foreign-born population - Sierra Leone (%)
Place of birth for the foreign-born population - Other Western Africa (%)
Place of birth for the foreign-born population - Australia (%)
Place of birth for the foreign-born population - New Zealand (%)
Place of birth for the foreign-born population - Fiji (%)
Place of birth for the foreign-born population - Micronesia (%)
Place of birth for the foreign-born population - Bahamas (%)
Place of birth for the foreign-born population - Barbados (%)
Place of birth for the foreign-born population - Cuba (%)
Place of birth for the foreign-born population - Dominica (%)
Place of birth for the foreign-born population - Dominican Republic (%)
Place of birth for the foreign-born population - Grenada (%)
Place of birth for the foreign-born population - Haiti (%)
Place of birth for the foreign-born population - Jamaica (%)
Place of birth for the foreign-born population - St. Vincent and the Grenadines (%)
Place of birth for the foreign-born population - Trinidad and Tobago (%)
Place of birth for the foreign-born population - West Indies (%)
Place of birth for the foreign-born population - Other Caribbean (%)
Place of birth for the foreign-born population - Belize (%)
Place of birth for the foreign-born population - Costa Rica (%)
Place of birth for the foreign-born population - El Salvador (%)
Place of birth for the foreign-born population - Guatemala (%)
Place of birth for the foreign-born population - Honduras (%)
Place of birth for the foreign-born population - Mexico (%)
Place of birth for the foreign-born population - Nicaragua (%)
Place of birth for the foreign-born population - Panama (%)
Place of birth for the foreign-born population - Other Central America (%)
Place of birth for the foreign-born population - Argentina (%)
Place of birth for the foreign-born population - Bolivia (%)
Place of birth for the foreign-born population - Brazil (%)
Place of birth for the foreign-born population - Chile (%)
Place of birth for the foreign-born population - Colombia (%)
Place of birth for the foreign-born population - Ecuador (%)
Place of birth for the foreign-born population - Guyana (%)
Place of birth for the foreign-born population - Peru (%)
Place of birth for the foreign-born population - Uruguay (%)
Place of birth for the foreign-born population - Venezuela (%)
Place of birth for the foreign-born population - Other South America (%)
Place of birth for the foreign-born population - Canada (%)
Place of birth for the foreign-born population - Other Northern America (%)
Place of birth for the foreign-born population - Other (%)
Latest news about races in Greensboro, NC collected exclusively by city-data.com from local newspapers, TV, and radio stations
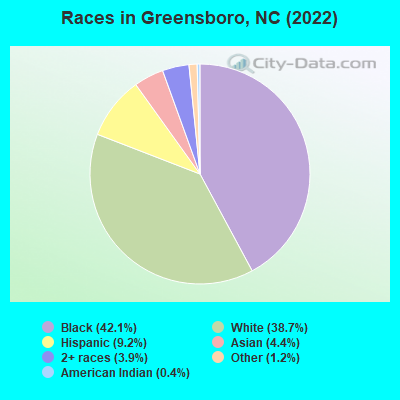
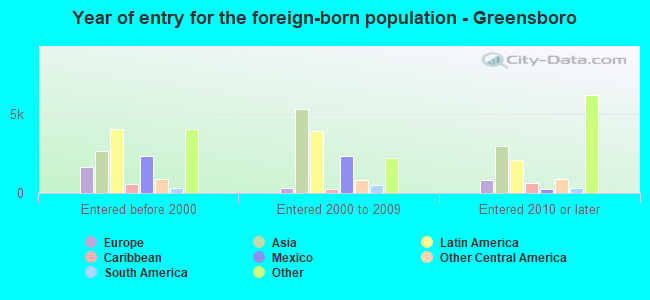
According to 2022 data, the most numerous races in Greensboro, NC are White alone (116,680 residents), Black alone (126,919 residents), and Hispanic (27,578 residents). 82.5% of Greensboro residents speak English at home. 12.9% of Greensboro, NC residents are foreign-born (4.2% born in Asia, 3.8% born in Latin America, 3.1% born in Africa), which is 37.8% greater than the foreign-born rate of 8.0% across the entire state of North Carolina.
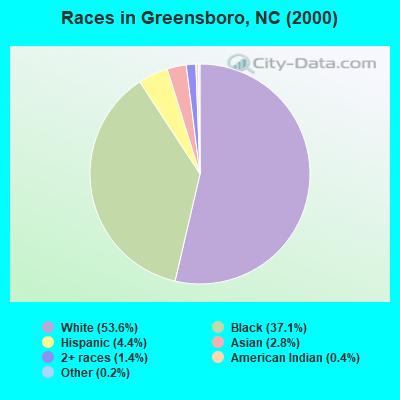
Race distribution in Greensboro
2000 2022
120,112 53.6% White alone 83,041 37.1% Black alone 9,742 4.4% Hispanic 6,303 2.8% Asian alone 3,211 1.4% Two or more races 920 0.4% American Indian alone 487 0.2% Other race alone 75 0.03% Native Hawaiian and Other
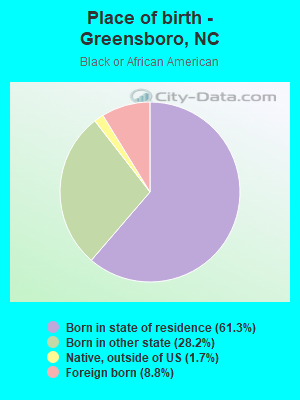
126,919 42.1% Black alone 116,680 38.7% White alone 27,578 9.2% Hispanic 13,288 4.4% Asian alone 11,748 3.9% Two or more races 3,671 1.2% Other race alone 1,102 0.4% American Indian alone 132 0.04% Native Hawaiian and Other
2000 2022
5,647,155 70.2% White alone 1,723,301 21.4% Black alone 378,963 4.7% Hispanic 112,416 1.4% Asian alone 95,333 1.2% American Indian alone 79,965 1.0% Two or more races 9,015 0.1% Other race alone 3,165 0.04% Native Hawaiian and Other
6,497,519 60.7% White alone 2,155,650 20.1% Black alone 1,114,799 10.4% Hispanic 438,061 4.1% Two or more races 341,052 3.2% Asian alone 91,758 0.9% American Indian alone 50,180 0.5% Other race alone 9,954 0.09% Native Hawaiian and Other
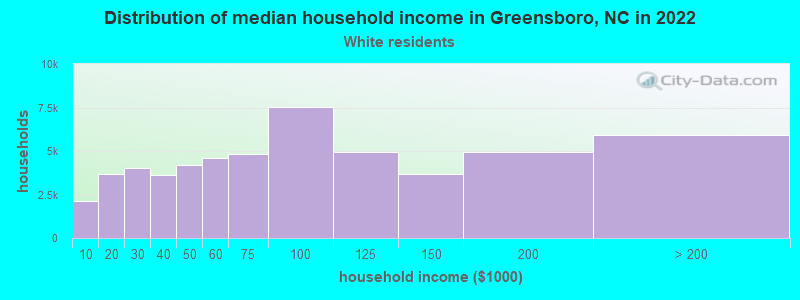
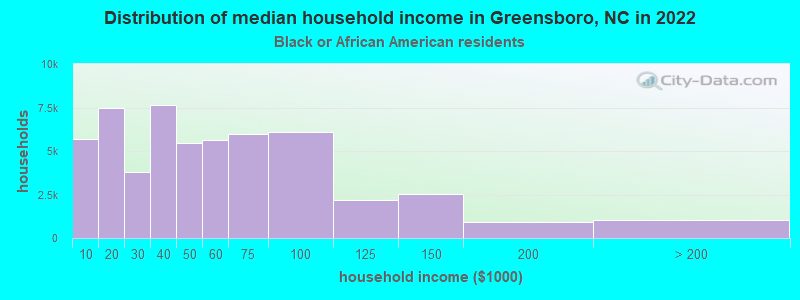
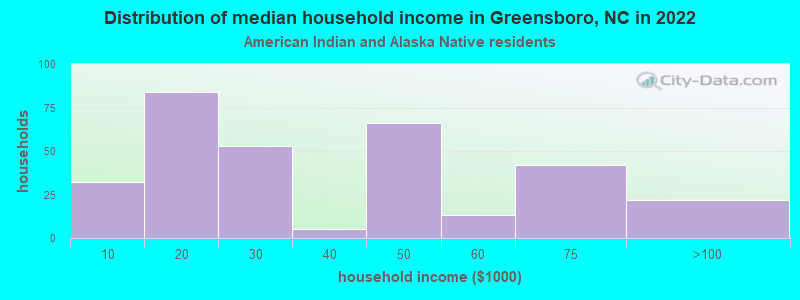
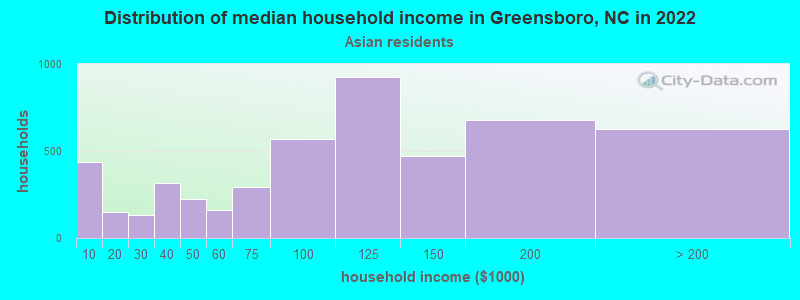
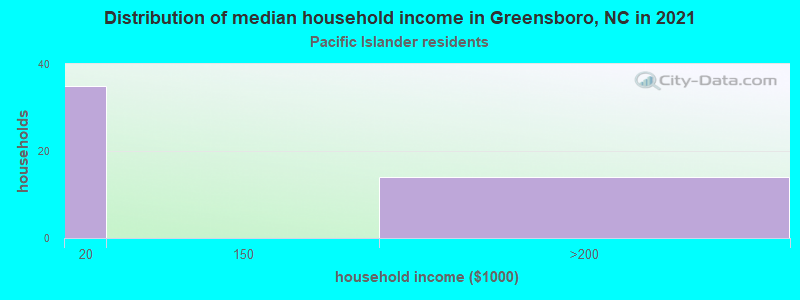
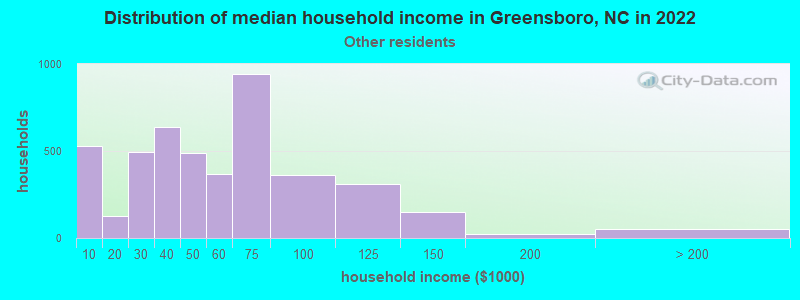
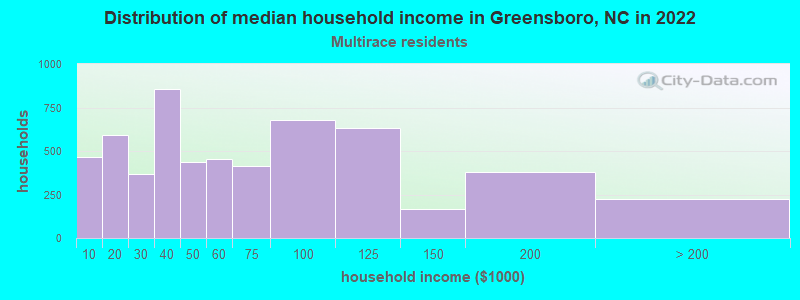
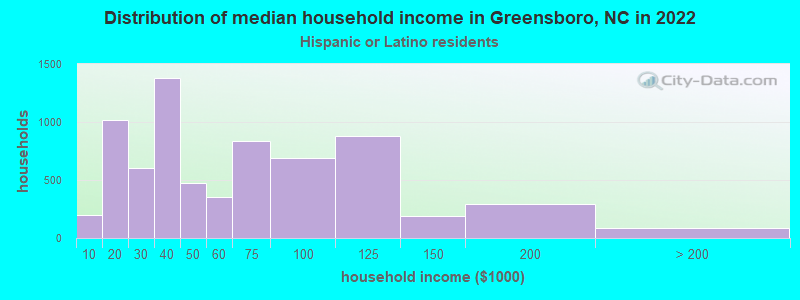
Income and house value in Greensboro Median household income in 2022 $74,756 White non-Hispanic householders$45,035 Black householders$23,209 American Indian and Alaska Native householders$102,671 Asian householders$39,717 Some other race householders$38,007 Two or more races householders$46,739 Hispanic or Latino race householdersMedian 2022 house value $277,701 White Non-Hispanic householders$180,625 Black or African American householders$185,425 American Indian or Alaska Native householders $215,311 Asian householders$163,610 Native Hawaiian and other Pacific Islander householders$207,239 Some other race householders$224,037 Two or more races householders$217,928 Hispanic or Latino householders
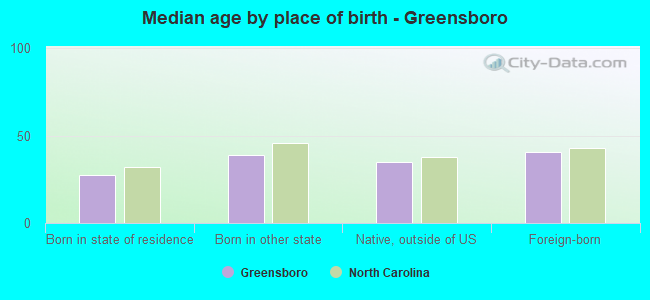
Median age by race in Greensboro
40.6 Median age for White residents38.8 41.8 32.0 Median age for Black or African American residents29.6 34.0 41.4 Median age for American Indian / Alaska Native residents42.0 35.6 34.6 Median age for Asian residents34.6 35.0 -666,666,666.0 Median age for Native Hawaiian / Pacific Islander residents-666,666,666.0 -666,666,666.0 20.7 Median age for Other race residents19.2 21.6 22.2 Median age for Two or more races residents22.7 21.3 40.8 Median age for White alone residents39.3 41.9 23.0 Median age for Hispanic or Latino residents22.9 23.0
Owner/renter occupied households by race in Greensboro
House owners and renters - White residents 34,191 63.2% Owner occupied19,879 36.8% Renter occupiedHouse owners and renters - Black or African American residents 20,587 37.8% Owner occupied33,875 62.2% Renter occupiedHouse owners and renters - American Indian / Alaska Native residents 196 38.2% Owner occupied317 61.8% Renter occupiedHouse owners and renters - Asian residents 2,417 63.0% Owner occupied1,418 37.0% Renter occupiedHouse owners and renters - Native Hawaiian / Pacific Islander residents 33 57.9% Owner occupied24 42.1% Renter occupiedHouse owners and renters - Other race residents 2,084 49.7% Owner occupied2,106 50.3% Renter occupiedHouse owners and renters - Two or more races residents 2,036 35.8% Owner occupied3,646 64.2% Renter occupiedHouse owners and renters - White alone residents 33,784 63.3% Owner occupied19,560 36.7% Renter occupiedHouse owners and renters - Hispanic or Latino residents 2,989 42.7% Owner occupied4,013 57.3% Renter occupied
Language usage in Greensboro
English speakers - Total 82.5% of residents of Greensboro speak English at home.
8.0% of residents speak Spanish at home 12,806 56.5% Speak English very well9,870 43.5% Speak English less than very well9.5% of residents speak other language at home 15,519 57.6% Speak English very well11,404 42.4% Speak English less than very well
English speakers - Born in the United States 92.7% of residents of Greensboro speak English at home.
5.6% of residents speak Spanish at home 4,881 87.7% Speak English very well683 12.3% Speak English less than very well1.8% of residents speak other language at home 1,689 96.8% Speak English very well56 3.2% Speak English less than very well
English speakers - Native, born elsewhere 56.6% of residents of Greensboro speak English at home.
37.3% of residents speak Spanish at home 957 57.3% Speak English very well714 42.7% Speak English less than very well6.1% of residents speak other language at home 75 27.7% Speak English very well196 72.3% Speak English less than very well
English speakers - Foreign-born 17.7% of residents of Greensboro speak English at home.
24.5% of residents speak Spanish at home 2,312 26.1% Speak English very well6,555 73.9% Speak English less than very well57.7% of residents speak other language at home 10,961 52.6% Speak English very well9,890 47.4% Speak English less than very well
White (Caucasian) - Speak only English Native:
97.4% (104,717)Foreign-born:
35.0% (2,317)
White (Caucasian) - Speak another language Native:
2.6% (2,843)Foreign-born:
65.0% (4,304)
Black or African American - Speak only English Native:
97.7% (107,829)Foreign-born:
28.4% (3,179)
Black or African American - Speak another language Native:
2.3% (2,550)Foreign-born:
71.6% (8,009)
American Indian / Alaska Native - Speak only English Native:
92.6% (956)Foreign-born:
35.5% (32)
American Indian / Alaska Native - Speak another language Native:
6.3% (65)Foreign-born:
35.9% (32)
Asian - Speak only English Native:
42.7% (1,636)Foreign-born:
7.2% (598)
Asian - Speak another language Native:
57.3% (2,193)Foreign-born:
92.8% (7,763)
Other race - Speak only English Native:
14.3% (1,276)Foreign-born:
0.4% (25)
Other race - Speak another language Native:
85.7% (7,619)Foreign-born:
99.6% (6,178)
Two or more races - Speak only English Native:
70.9% (11,043)Foreign-born:
8.2% (288)
Two or more races - Speak another language Native:
29.1% (4,536)Foreign-born:
91.8% (3,215)
White alone - Speak only English Native:
98.3% (104,356)Foreign-born:
39.4% (2,153)
White alone - Speak another language Native:
1.7% (1,838)Foreign-born:
60.6% (3,312)
Hispanic or Latino - Speak only English Native:
24.7% (3,795)Foreign-born:
3.4% (304)
Hispanic or Latino - Speak another language Native:
75.3% (11,580)Foreign-born:
96.6% (8,608)
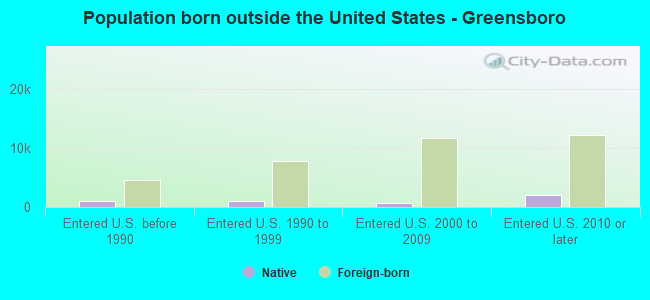
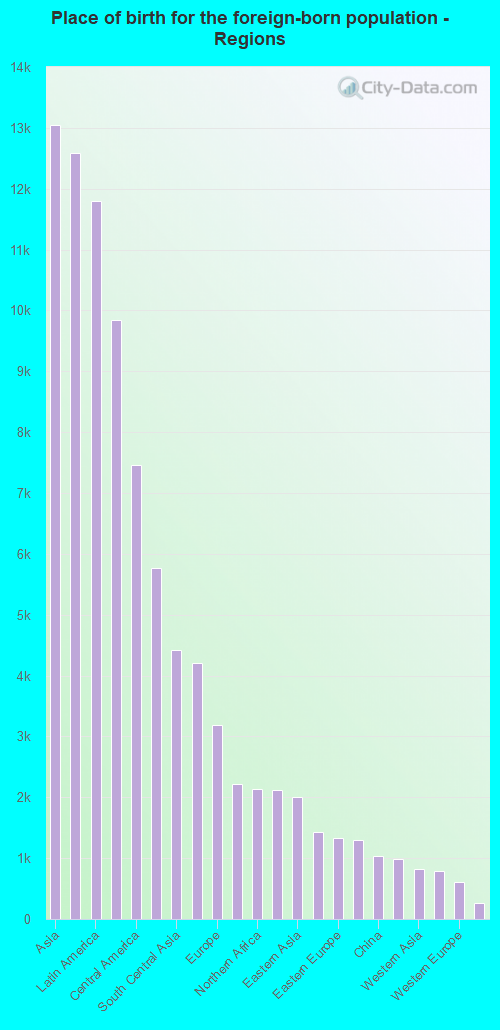
Foreign-born residents in Greensboro 38,685 residents are foreign born (4.2% Asia , 3.8% Latin America , 3.1% Africa ).
This city:
12.9%North Carolina:
8.3%
Marital status for residents in Greensboro Marital status - White (Caucasian) population 15 years and over
Males 32.8% Never married56.5% Now married1.0% Separated2.6% Widowed7.1% DivorcedFemales 30.1% Never married46.8% Now married1.9% Separated8.2% Widowed13.0% DivorcedWomen who gave birth in the past 12 months Now married:
51.0% (471)Unmarried:
49.0% (452)
Women who did not give birth in the past 12 months Now married:
41.2% (11,275)Unmarried:
58.8% (16,095)
Marital status - Black or African American population 15 years and over
Males 56.2% Never married31.8% Now married2.1% Separated2.0% Widowed7.9% DivorcedFemales 55.9% Never married21.4% Now married2.1% Separated6.3% Widowed14.2% DivorcedWomen who gave birth in the past 12 months Now married:
47.0% (849)Unmarried:
53.0% (957)
Women who did not give birth in the past 12 months Now married:
19.0% (7,471)Unmarried:
81.0% (31,766)
Marital status - American Indian / Alaska Native population 15 years and over
Males 41.4% Never married22.8% Now married7.0% Separated16.0% Widowed12.8% DivorcedFemales 42.8% Never married22.4% Now married7.6% Separated9.7% Widowed17.6% DivorcedWomen who did not give birth in the past 12 months Now married:
36.9% (69)Unmarried:
63.1% (118)
Marital status - Asian population 15 years and over
Males 42.2% Never married50.3% Now married0.7% Separated3.0% Widowed3.8% DivorcedFemales 30.5% Never married58.4% Now married1.9% Separated4.8% Widowed4.4% DivorcedWomen who gave birth in the past 12 months Now married:
50.0% (98)Unmarried:
50.0% (98)
Women who did not give birth in the past 12 months Now married:
56.9% (2,491)Unmarried:
43.1% (1,888)
Marital status - Native Hawaiian / Pacific Islander population 15 years and over
Males 100.0% Never married0.0% Now married0.0% Separated0.0% Widowed0.0% DivorcedFemales 21.4% Never married78.6% Now married0.0% Separated0.0% Widowed0.0% DivorcedWomen who did not give birth in the past 12 months Now married:
0.0% (0)Unmarried:
100.0% (6)
Marital status - Other race population 15 years and over
Males 51.2% Never married37.5% Now married2.9% Separated1.0% Widowed7.3% DivorcedFemales 42.8% Never married36.3% Now married5.4% Separated4.8% Widowed10.7% DivorcedWomen who gave birth in the past 12 months Now married:
93.2% (508)Unmarried:
6.8% (37)
Women who did not give birth in the past 12 months Now married:
24.9% (1,020)Unmarried:
75.1% (3,083)
Marital status - Two or more races population 15 years and over
Males 50.1% Never married42.5% Now married4.5% Separated0.4% Widowed2.5% DivorcedFemales 54.7% Never married33.5% Now married1.2% Separated2.4% Widowed8.3% DivorcedWomen who gave birth in the past 12 months Now married:
89.2% (753)Unmarried:
10.8% (91)
Women who did not give birth in the past 12 months Now married:
24.1% (1,382)Unmarried:
75.9% (4,348)
Marital status - White alone, not Hispanic / Latino population 15 years and over
Males 32.3% Never married56.6% Now married1.0% Separated2.7% Widowed7.3% DivorcedFemales 29.7% Never married47.2% Now married1.9% Separated8.2% Widowed13.0% DivorcedWomen who gave birth in the past 12 months Now married:
57.2% (471)Unmarried:
42.8% (352)
Women who did not give birth in the past 12 months Now married:
41.9% (11,275)Unmarried:
58.1% (15,632)
Marital status - Hispanic or Latino population 15 years and over
Males 51.8% Never married42.3% Now married3.7% Separated0.0% Widowed2.3% DivorcedFemales 45.7% Never married40.4% Now married6.4% Separated2.4% Widowed5.0% DivorcedWomen who gave birth in the past 12 months Now married:
84.7% (1,261)Unmarried:
15.3% (228)
Women who did not give birth in the past 12 months Now married:
25.4% (1,557)Unmarried:
74.6% (4,561)
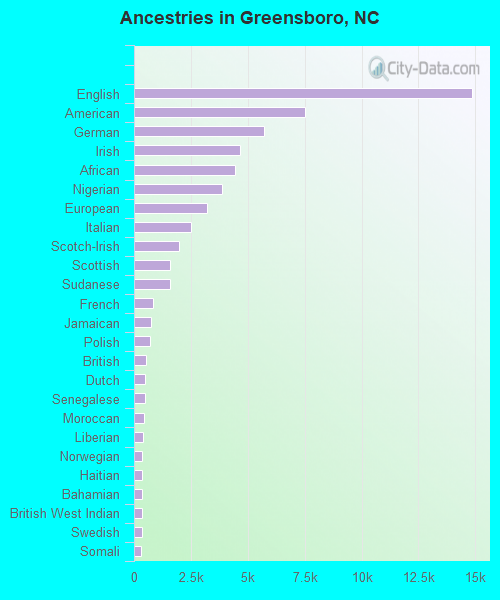
Ancestries in Greensboro
14,861 8.2% English7,532 4.2% American5,696 3.1% German4,674 2.6% Irish4,432 2.4% African3,877 2.1% Nigerian3,187 1.8% European2,510 1.4% Italian1,999 1.1% Scotch-Irish1,592 0.9% Scottish1,583 0.9% Sudanese822 0.5% French740 0.4% Jamaican707 0.4% Polish509 0.3% British473 0.3% Dutch467 0.3% Senegalese460 0.3% Moroccan392 0.2% Liberian361 0.2% Norwegian350 0.2% Haitian347 0.2% Bahamian340 0.2% British West Indian336 0.2% Swedish329 0.2% Somali284 0.2% Sierra Leonean277 0.2% Afghan273 0.2% Ethiopian254 0.1% Eastern European240 0.1% Iranian230 0.1% Barbadian227 0.1% Ghanaian221 0.1% Iraqi218 0.1% Russian216 0.1% Greek214 0.1% French Canadian205 0.1% Canadian203 0.1% Guyanese200 0.1% Yugoslavian191 0.1% Northern European178 0.10% Bulgarian169 0.09% Danish160 0.09% Welsh154 0.09% Hungarian135 0.07% Zimbabwean128 0.07% Arab122 0.07% Ukrainian120 0.07% West Indian101 0.06% Lithuanian87 0.05% Austrian85 0.05% Brazilian84 0.05% Armenian79 0.04% Scandinavian75 0.04% Swiss74 0.04% Trinidadian and Tobagonian71 0.04% Egyptian70 0.04% Romanian67 0.04% Turkish63 0.03% Czech59 0.03% Kenyan58 0.03% Israeli56 0.03% Lebanese48 0.03% Belgian45 0.02% Slovak41 0.02% Serbian40 0.02% Jordanian38 0.02% Slavic38 0.02% New Zealander36 0.02% Palestinian34 0.02% Slovene33 0.02% South African32 0.02% Syrian26 0.01% Maltese25 0.01% Pennsylvania German24 0.01% Finnish20 0.01% Estonian14 0.01% Croatian12 0.01% Portuguese
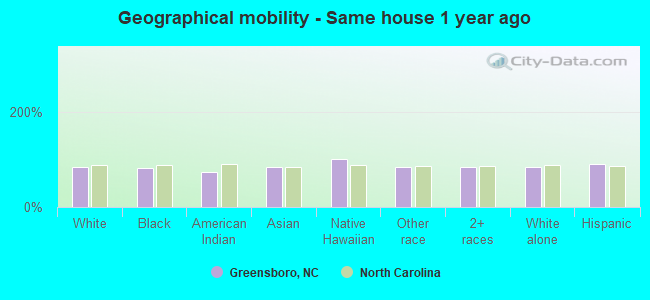
Geographical mobility in Greensboro Same house 1 year ago 98,137 83.5% White (Caucasian)103,834 81.3% Black or African American860 74.2% American Indian / Alaska Native13,262 84.2% Asian75 100.0% Native Hawaiian / Pacific Islander13,787 82.8% Other race17,488 83.2% Two or more races95,753 83.3% White alone, not Hispanic / Latino23,600 90.7% Hispanic or LatinoMoved within same county 9,541 8.1% White / Caucasian12,351 9.7% Black or African American85 7.3% American Indian / Alaska Native1,465 9.3% Asian1,003 6.0% Other race1,041 5.0% Two or more races9,541 8.3% White alone, not Hispanic / Latino1,173 4.5% Hispanic or LatinoMoved within same state 5,714 4.9% White / Caucasian7,705 6.0% Black or African American61 5.3% American Indian / Alaska Native132 0.8% Asian202 1.2% Other race1,211 5.8% Two or more races5,651 4.9% White alone, not Hispanic / Latino464 1.8% Hispanic or LatinoMoved from different state 3,979 3.4% White / Caucasian3,011 2.4% Black or African American97 8.4% American Indian / Alaska Native434 2.8% Asian260 1.6% Other race1,277 6.1% Two or more races3,904 3.4% White alone, not Hispanic / Latino605 2.3% Hispanic or LatinoMoved from abroad 138 0.1% White763 0.6% Black or African American140 0.9% Asian43 0.3% Other race138 0.1% White alone, not Hispanic / Latino171 0.7% Hispanic or Latino
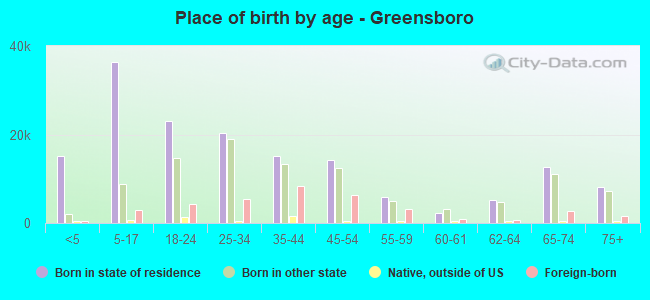
Children Nativity (place of birth) in Greensboro
Children under 6 years - Living with two parents Both parents native 6,960 100.0% NativeBoth parents foreign-born 1,991 94.4% Native119 5.6% Foreign-bornOne native, one foreign-born parent 1,287 100.0% NativeChildren under 6 years - Living with one parent Native parent 6,560 100.0% NativeForeign-born parent 2,018 95.1% Native104 4.9% Foreign-bornChildren 6 to 17 years - Living with two parents Both parents native 15,326 99.3% Native107 0.7% Foreign-bornBoth parents foreign-born 3,348 75.1% Native1,113 24.9% Foreign-bornOne native, one foreign-born parent 2,118 94.7% Native119 5.3% Foreign-bornChildren 6 to 17 years - Living with one parent Native parent 14,729 100.0% NativeForeign-born parent 5,272 55.6% Native4,206 44.4% Foreign-born
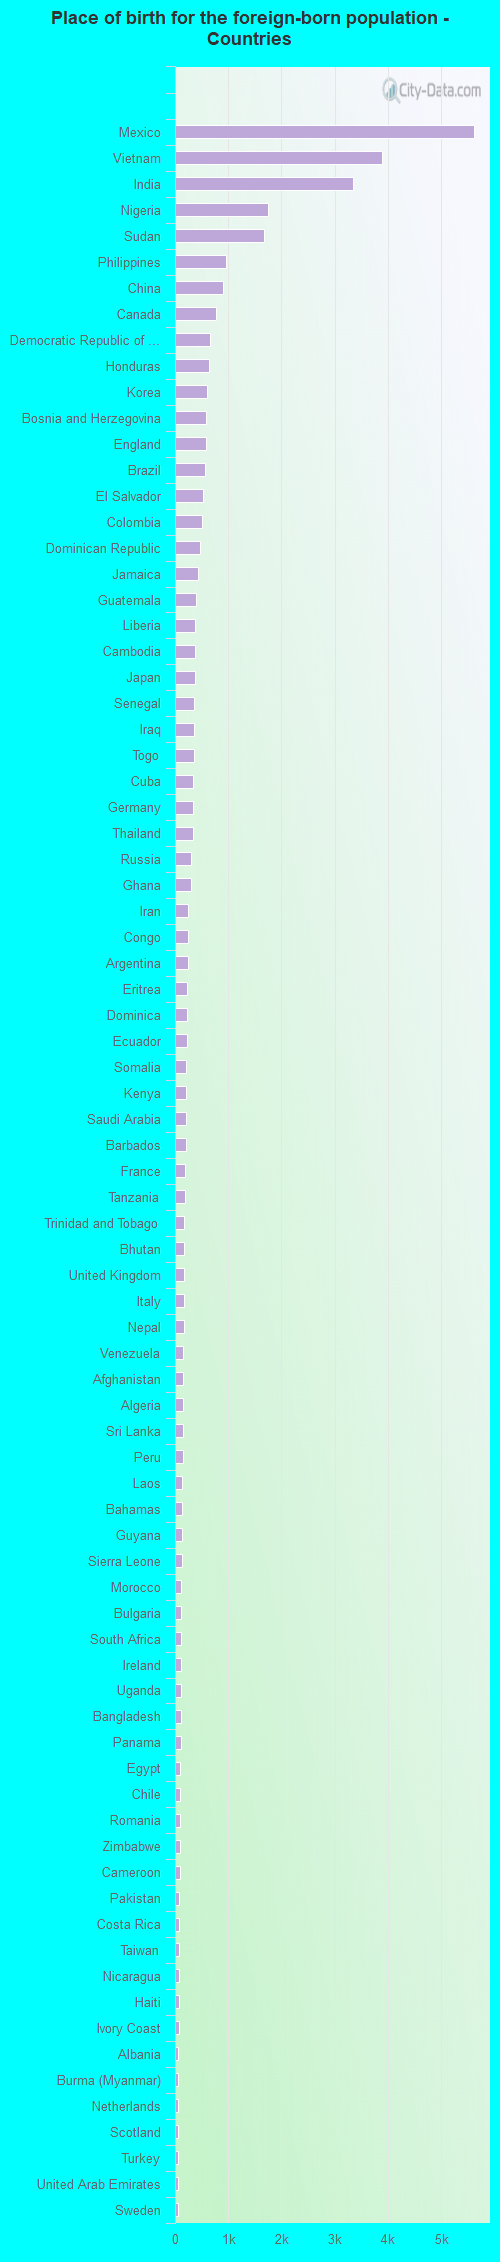
Place of birth for residents in Greensboro 13,043 Asia12,586 Americas11,792 Latin America9,849 Africa7,455 Central America5,773 South Eastern Asia4,419 South Central Asia4,211 Western Africa3,190 Europe2,223 Caribbean2,141 Northern Africa2,113 South America2,007 Eastern Asia1,436 Middle Africa1,328 Eastern Europe1,300 Eastern Africa1,039 China993 Northern Europe828 Western Asia794 Northern America605 Western Europe263 Southern Europe115 Southern Africa14 Oceania14 Australia and New Zealand Subregion5,621 Mexico3,892 Vietnam3,354 India1,754 Nigeria1,669 Sudan963 Philippines910 China780 Canada658 Democratic Republic of Congo (Zaire)642 Honduras596 Korea592 Bosnia and Herzegovina583 England556 Brazil529 El Salvador505 Colombia477 Dominican Republic440 Jamaica396 Guatemala377 Liberia373 Cambodia371 Japan365 Senegal352 Iraq351 Togo339 Cuba336 Germany331 Thailand297 Russia294 Ghana247 Iran240 Congo239 Argentina229 Eritrea224 Dominica219 Ecuador208 Somalia208 Kenya208 Saudi Arabia199 Barbados194 France181 Tanzania170 Trinidad and Tobago169 Bhutan167 United Kingdom162 Italy160 Nepal148 Venezuela147 Afghanistan142 Algeria142 Sri Lanka141 Peru138 Laos135 Bahamas130 Guyana129 Sierra Leone122 Morocco116 Bulgaria115 South Africa115 Ireland115 Uganda113 Bangladesh108 Panama96 Egypt96 Chile88 Romania86 Zimbabwe85 Cameroon84 Pakistan84 Costa Rica84 Taiwan72 Nicaragua71 Haiti69 Ivory Coast62 Albania61 Burma (Myanmar)59 Netherlands53 Scotland53 Turkey53 United Arab Emirates52 Sweden50 Spain44 Hong Kong44 Greece40 Ukraine36 Israel27 Azerbaijan27 Hungary26 Jordan25 Poland22 Syria20 Uruguay17 Ethiopia16 Serbia15 Denmark14 Austria14 Australia14 Croatia13 Armenia13 Czechoslovakia12 Kuwait12 Indonesia7 Lebanon7 Belarus5 Azores Islands5 Portugal
Grandparents responsible for own grandchildren in Greensboro
Grandparents (30 to 59 years) White / Caucasian 216 61.5% Responsible for grandchildren135 38.5% Not responsible for grandchildrenBlack or African American 116 19.8% Responsible for grandchildren469 80.2% Not responsible for grandchildrenAmerican Indian / Alaska Native 9 100.0% Responsible for grandchildrenAsian 64 23.4% Responsible for grandchildren209 76.6% Not responsible for grandchildrenOther race 19 16.4% Responsible for grandchildren96 83.6% Not responsible for grandchildrenTwo or more races 13 33.2% Responsible for grandchildren27 66.8% Not responsible for grandchildrenWhite alone, not Hispanic / Latino 166 54.4% Responsible for grandchildren139 45.6% Not responsible for grandchildrenHispanic or Latino 105 57.2% Responsible for grandchildren78 42.8% Not responsible for grandchildrenGrandparents (60 years and over) White / Caucasian 210 35.6% Responsible for grandchildren380 64.4% Not responsible for grandchildrenBlack or African American 1,013 51.4% Responsible for grandchildren956 48.6% Not responsible for grandchildrenAsian 161 22.9% Responsible for grandchildren545 77.1% Not responsible for grandchildrenOther race 23 40.6% Responsible for grandchildren34 59.4% Not responsible for grandchildrenTwo or more races 33 100.0% Not responsible for grandchildrenWhite alone, not Hispanic / Latino 210 35.9% Responsible for grandchildren376 64.1% Not responsible for grandchildrenHispanic or Latino 16 12.0% Responsible for grandchildren115 88.0% Not responsible for grandchildren
Zip codes: 27214 , 27235 , 27282 , 27301 , 27313 , 27358 , 27401 , 27403 , 27405 , 27407 , 27408 , 27409 , 27410 , 27455 .