Estimated zip code population in 2022: 15,810 Zip code population in 2010: 14,075 Zip code population in 2000: 9,846
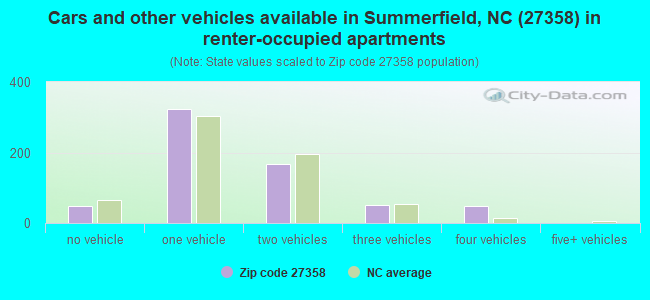
Houses and condos: 5,939 Renter-occupied apartments: 633
% of renters here:
11%
State:
33%
March 2022 cost of living index in zip code 27358: 91.6 (less than average, U.S. average is 100)
Land area: 54.5 sq. mi. Water area: 1.1 sq. mi.
Population density: 290 people per square mile
(very low).
OSM Map
General Map
Google Map
MSN Map
OSM Map
General Map
Google Map
MSN Map
OSM Map
General Map
Google Map
MSN Map
OSM Map
General Map
Google Map
MSN Map
Please wait while loading the map...
Real estate property taxes paid for housing units in 2022:
This zip code:
0.6% ($2,781)
North Carolina:
0.6% ($1,769)
Median real estate property taxes paid for housing units with mortgages in 2022: $3,138 (0.6%) Median real estate property taxes paid for housing units with no mortgage in 2022: $2,025 (0.7%)
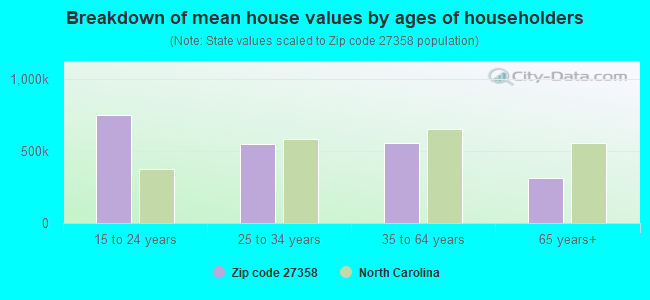
Estimated median house/condo value in 2022: $444,015
27358:
$444,015
North Carolina:
$280,600
According to our research of North Carolina and other state lists, there were 10 registered sex offenders living in 27358 zip code as of June 05, 2024. The ratio of all residents to sex offenders in zip code 27358 is 1,479 to 1. The ratio of registered sex offenders to all residents in this zip code is much lower than the state average.
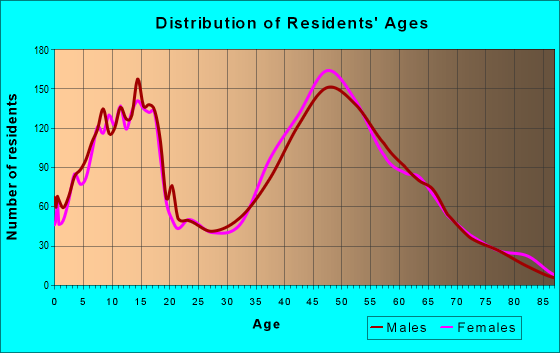
Median resident age:
This zip code:
45.6 years
North Carolina median age:
39.2 years
Average household size:
This zip code:
2.8 people
North Carolina:
2.4 people
Averages for the 2020 tax year for zip code 27358, filed in 2021:
Average Adjusted Gross Income (AGI) in 2020: $126,608 (Individual Income Tax Returns)
Here:
$126,608
State:
$70,020
Salary/wage: $104,726 (reported on 82.0% of returns)
Here:
$104,726
State:
$58,387
(% of AGI for various income ranges: 1123.2% for AGIs below $25k, 3752.1% for AGIs $25k-50k, 6753.5% for AGIs $50k-75k, 9984.0% for AGIs $75k-100k, 20204.8% for AGIs $100k-200k, 89634.7% for AGIs over 200k)
Taxable interest for individuals: $2,033 (reported on 44.9% of returns)
This zip code:
$2,033
North Carolina:
$1,479
(% of AGI for various income ranges: 16.1% for AGIs below $25k, 47.7% for AGIs $25k-50k, 89.2% for AGIs $50k-75k, 104.8% for AGIs $75k-100k, 167.4% for AGIs $100k-200k, 1019.1% for AGIs over 200k)
Ordinary dividends: $8,338 (reported on 35.0% of returns)
Here:
$8,338
State:
$7,888
(% of AGI for various income ranges: 50.6% for AGIs below $25k, 94.2% for AGIs $25k-50k, 210.2% for AGIs $50k-75k, 265.0% for AGIs $75k-100k, 516.0% for AGIs $100k-200k, 3613.5% for AGIs over 200k)
Net capital gain/loss in AGI: +$24,198 (reported on 32.4% of returns)
Here:
+$24,198
State:
+$23,652
(% of AGI for various income ranges: 36.9% for AGIs below $25k, 92.5% for AGIs $25k-50k, 140.2% for AGIs $50k-75k, 310.2% for AGIs $75k-100k, 855.0% for AGIs $100k-200k, 12736.5% for AGIs over 200k)
Profit/loss from business: +$22,718 (reported on 18.0% of returns)
Here:
+$22,718
State:
+$11,710
(% of AGI for various income ranges: 142.9% for AGIs below $25k, 257.1% for AGIs $25k-50k, 290.4% for AGIs $50k-75k, 375.0% for AGIs $75k-100k, 756.5% for AGIs $100k-200k, 4487.9% for AGIs over 200k)
Taxable individual retirement arrangement distribution: $22,183 (reported on 13.5% of returns)
27358:
$22,183
North Carolina:
$20,247
(% of AGI for various income ranges: 94.4% for AGIs below $25k, 188.4% for AGIs $25k-50k, 438.8% for AGIs $50k-75k, 494.0% for AGIs $75k-100k, 844.9% for AGIs $100k-200k, 2007.4% for AGIs over 200k)
Self-employed (Keogh) retirement plans: $27,590 (reported on 1.5% of returns)
27358:
$27,590
North Carolina:
$26,749
(% of AGI for various income ranges: 67.6% for AGIs $100k-200k, 644.4% for AGIs over 200k)
Total itemized deductions: $38,747 (reported on 17.3% of returns)
Here:
$38,747
State:
$34,549
(% of AGI for various income ranges: 73.5% for AGIs below $25k, 181.2% for AGIs $25k-50k, 489.0% for AGIs $50k-75k, 604.5% for AGIs $75k-100k, 1438.6% for AGIs $100k-200k, 7867.4% for AGIs over 200k)
Charity contributions: $14,775 (reported on 15.1% of returns)
Here:
$14,775
State:
$13,360
(% of AGI for various income ranges: 21.5% for AGIs $25k-50k, 85.4% for AGIs $50k-75k, 132.5% for AGIs $75k-100k, 401.7% for AGIs $100k-200k, 3160.9% for AGIs over 200k)
Taxes paid: $8,785 (reported on 17.1% of returns)
27358:
$8,785
State:
$7,586
(% of AGI for various income ranges: 4.6% for AGIs below $25k, 34.2% for AGIs $25k-50k, 93.3% for AGIs $50k-75k, 148.5% for AGIs $75k-100k, 379.8% for AGIs $100k-200k, 1690.0% for AGIs over 200k)
Earned income credit: $1,927 (reported on 7.6% of returns)
Here:
$1,927
State:
$2,337
(% of AGI for various income ranges: 55.1% for AGIs below $25k, 54.9% for AGIs $25k-50k)
Percentage of individuals using paid preparers for their 2020 taxes: 93.1%
Here:
93%
State:
93%
(% for various income ranges: 92.3% for AGIs below $25k, 93.2% for AGIs $25k-50k, 91.9% for AGIs $50k-75k, 92.1% for AGIs $75k-100k, 93.8% for AGIs $100k-200k, 94.6% for AGIs over 200k)
Averages for the 2012 tax year for zip code 27358, filed in 2013:
Average Adjusted Gross Income (AGI) in 2012: $100,603 (Individual Income Tax Returns)
Here:
$100,603
State:
$54,937
Salary/wage: $88,504 (reported on 84.6% of returns)
Here:
$88,504
State:
$46,336
(% of AGI for various income ranges: 71.0% for AGIs below $25k, 75.1% for AGIs $25k-50k, 70.1% for AGIs $50k-75k, 76.3% for AGIs $75k-100k, 80.8% for AGIs $100k-200k, 71.0% for AGIs over 200k)
Taxable interest for individuals: $1,605 (reported on 50.4% of returns)
This zip code:
$1,605
North Carolina:
$1,298
(% of AGI for various income ranges: 1.3% for AGIs below $25k, 1.0% for AGIs $25k-50k, 0.8% for AGIs $50k-75k, 0.7% for AGIs $75k-100k, 0.6% for AGIs $100k-200k, 0.9% for AGIs over 200k)
Ordinary dividends: $6,691 (reported on 33.4% of returns)
Here:
$6,691
State:
$6,213
(% of AGI for various income ranges: 2.4% for AGIs below $25k, 2.1% for AGIs $25k-50k, 1.9% for AGIs $50k-75k, 1.6% for AGIs $75k-100k, 1.6% for AGIs $100k-200k, 2.8% for AGIs over 200k)
Net capital gain/loss in AGI: +$12,593 (reported on 28.8% of returns)
Here:
+$12,593
State:
+$12,740
(% of AGI for various income ranges: 3.4% for AGIs below $25k, 0.2% for AGIs $25k-50k, 0.9% for AGIs $50k-75k, 0.8% for AGIs $75k-100k, 1.5% for AGIs $100k-200k, 6.5% for AGIs over 200k)
Profit/loss from business: +$19,404 (reported on 18.2% of returns)
Here:
+$19,404
State:
+$10,311
(% of AGI for various income ranges: 7.6% for AGIs below $25k, 3.8% for AGIs $25k-50k, 3.8% for AGIs $50k-75k, 2.9% for AGIs $75k-100k, 2.8% for AGIs $100k-200k, 3.7% for AGIs over 200k)
Taxable individual retirement arrangement distribution: $18,183 (reported on 13.3% of returns)
27358:
$18,183
North Carolina:
$15,575
(% of AGI for various income ranges: 5.9% for AGIs below $25k, 3.6% for AGIs $25k-50k, 4.6% for AGIs $50k-75k, 3.7% for AGIs $75k-100k, 3.1% for AGIs $100k-200k, 1.0% for AGIs over 200k)
Self-employment retirement plans: $22,100 (reported on 1.4% of returns)
27358:
$22,100
North Carolina:
$21,078
(% of AGI for various income ranges: 0.3% for AGIs $100k-200k, 0.5% for AGIs over 200k)
Total itemized deductions: $31,418 (19% of AGI, reported on 53.8% of returns)
Here:
$31,418
State:
$23,438
Here:
19.3% of AGI
State:
21.5% of AGI
(% of AGI for various income ranges: 17.7% for AGIs below $25k, 15.2% for AGIs $25k-50k, 17.7% for AGIs $50k-75k, 19.5% for AGIs $75k-100k, 19.3% for AGIs $100k-200k, 14.7% for AGIs over 200k)
Charity contributions: $5,271 (reported on 47.4% of returns)
Here:
$5,271
State:
$4,687
(% of AGI for various income ranges: 1.3% for AGIs below $25k, 1.8% for AGIs $25k-50k, 2.3% for AGIs $50k-75k, 2.6% for AGIs $75k-100k, 2.6% for AGIs $100k-200k, 2.6% for AGIs over 200k)
Taxes paid: $13,827 (reported on 53.6% of returns)
27358:
$13,827
State:
$8,823
(% of AGI for various income ranges: 2.9% for AGIs below $25k, 3.7% for AGIs $25k-50k, 5.1% for AGIs $50k-75k, 6.7% for AGIs $75k-100k, 8.0% for AGIs $100k-200k, 8.2% for AGIs over 200k)
Earned income credit: $1,834 (reported on 9.4% of returns)
Here:
$1,834
State:
$2,376
(% of AGI for various income ranges: 3.8% for AGIs below $25k, 0.9% for AGIs $25k-50k)
Percentage of individuals using paid preparers for their 2012 taxes: 55.8%
Here:
56%
State:
53%
(% for various income ranges: 50.3% for AGIs below $25k, 53.8% for AGIs $25k-50k, 59.7% for AGIs $50k-75k, 59.3% for AGIs $75k-100k, 54.9% for AGIs $100k-200k, 69.1% for AGIs over 200k)
Averages for the 2004 tax year for zip code 27358, filed in 2005:
Average Adjusted Gross Income (AGI) in 2004: $76,752 (Individual Income Tax Returns)
Here:
$76,752
State:
$45,376
Salary/wage: $67,057 (reported on 85.1% of returns)
Here:
$67,057
State:
$39,442
(% of AGI for various income ranges: 300.2% for AGIs below $10k, 71.7% for AGIs $10k-25k, 79.3% for AGIs $25k-50k, 80.5% for AGIs $50k-75k, 84.5% for AGIs $75k-100k, 69.4% for AGIs over 100k)
Taxable interest for individuals: $1,965 (reported on 56.5% of returns)
This zip code:
$1,965
North Carolina:
$1,515
(% of AGI for various income ranges: 30.5% for AGIs below $10k, 2.5% for AGIs $10k-25k, 1.2% for AGIs $25k-50k, 1.7% for AGIs $50k-75k, 0.9% for AGIs $75k-100k, 1.4% for AGIs over 100k)
Taxable dividends: $4,882 (reported on 37.4% of returns)
Here:
$4,882
State:
$4,016
(% of AGI for various income ranges: 22.1% for AGIs below $10k, 2.0% for AGIs $10k-25k, 1.6% for AGIs $25k-50k, 1.3% for AGIs $50k-75k, 1.2% for AGIs $75k-100k, 2.8% for AGIs over 100k)
Net capital gain/loss: +$13,033 (reported on 31.7% of returns)
Here:
+$13,033
State:
+$11,152
(% of AGI for various income ranges: 61.5% for AGIs below $10k, 0.5% for AGIs $10k-25k, 0.7% for AGIs $25k-50k, 1.1% for AGIs $50k-75k, 1.2% for AGIs $75k-100k, 7.6% for AGIs over 100k)
Profit/loss from business: +$16,045 (reported on 18.1% of returns)
Here:
+$16,045
State:
+$9,490
(% of AGI for various income ranges: -30.0% for AGIs below $10k, 4.8% for AGIs $10k-25k, 3.0% for AGIs $25k-50k, 3.2% for AGIs $50k-75k, 3.3% for AGIs $75k-100k, 4.2% for AGIs over 100k)
IRA payment deduction: $3,151 (reported on 3.5% of returns)
27358:
$3,151
North Carolina:
$2,967
(% of AGI for various income ranges: 0.3% for AGIs $10k-25k, 0.3% for AGIs $25k-50k, 0.2% for AGIs $50k-75k, 0.2% for AGIs $75k-100k, 0.1% for AGIs over 100k)
Self-employed pension: $16,812 (reported on 1.6% of returns)
Here:
$16,812
North Carolina:
$14,754
Total itemized deductions: $24,614 (20% of AGI, reported on 54.9% of returns)
Here:
$24,614
State:
$19,464
Here:
20.1% of AGI
State:
22.7% of AGI
(% of AGI for various income ranges: 52.1% for AGIs below $10k, 14.0% for AGIs $10k-25k, 18.7% for AGIs $25k-50k, 20.1% for AGIs $50k-75k, 22.4% for AGIs $75k-100k, 16.1% for AGIs over 100k)
Charity contributions deductions: $4,250 (3% of AGI, reported on 50.8% of returns)
Here:
$4,250
State:
$4,035
Here:
3.3% of AGI
State:
4.5% of AGI
(% of AGI for various income ranges: 4.3% for AGIs below $10k, 1.8% for AGIs $10k-25k, 2.5% for AGIs $25k-50k, 2.5% for AGIs $50k-75k, 3.4% for AGIs $75k-100k, 2.8% for AGIs over 100k)
Total tax: $13,659 (reported on 80.4% of returns)
27358:
$13,659
State:
$7,257
(% of AGI for various income ranges: 12.2% for AGIs below $10k, 4.5% for AGIs $10k-25k, 6.2% for AGIs $25k-50k, 7.9% for AGIs $50k-75k, 9.1% for AGIs $75k-100k, 18.2% for AGIs over 100k)
Earned income credit: $1,508 (reported on 7.3% of returns)
Here:
$1,508
State:
$1,851
Percentage of individuals using paid preparers for their 2004 taxes: 59.4%
Here:
59%
State:
62%
(% for various income ranges: 52.4% for AGIs below $10k, 59.3% for AGIs $10k-25k, 61.3% for AGIs $25k-50k, 63.4% for AGIs $50k-75k, 58.4% for AGIs $75k-100k, 61.8% for AGIs over 100k)
Household received Food Stamps/SNAP in the past 12 months: 404 Household did not receive Food Stamps/SNAP in the past 12 months: 5,299
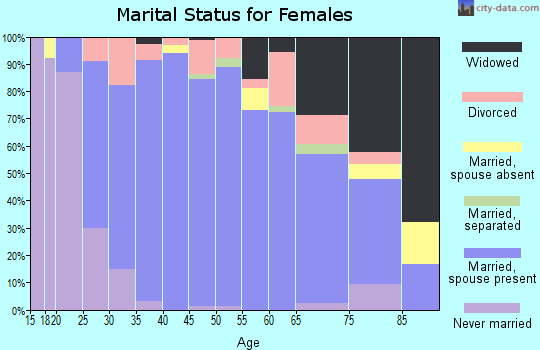
Women who had a birth in the past 12 months: 120 (82 now married, 38 unmarried) Women who did not have a birth in the past 12 months: 3,427 (1,732 now married, 1,699 unmarried)
Housing units in zip code 27358 with a mortgage: 3,320 (637 second mortgage, 22 home equity loan, 574 both second mortgage and home equity loan) Houses without a mortgage: 19
Median monthly owner costs for units with a mortgage: $2,089 Median monthly owner costs for units without a mortgage: $481
Residents with income below the poverty level in 2022:
This zip code:
10.0%
Whole state:
12.8%
Residents with income below 50% of the poverty level in 2022:
This zip code:
6.4%
Whole state:
6.8%
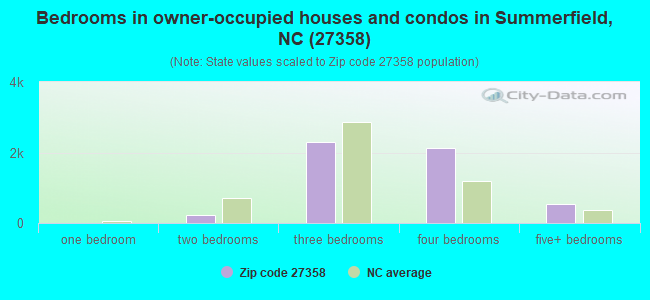
Median number of rooms in houses and condos:
Here:
7.9
State:
6.4
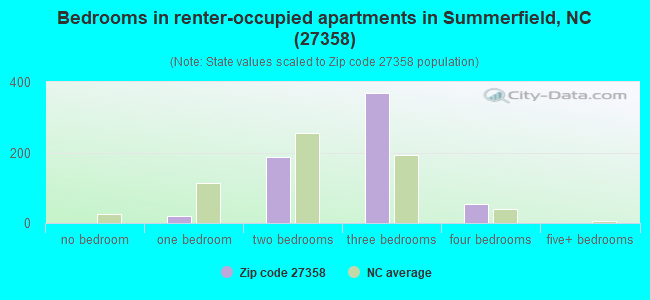
Median number of rooms in apartments:
Here:
5.2
State:
4.4
Notable locations in this zip code not listed on our city pages
Churches in zip code 27358 include: Hillsdale Church (A), Hopewell Church (B), Liberty Wesleyan Church (C), Mount Bethel Church (D), Glencoe Church (E). Display/hide their locations on the map
Reservoirs: Lake Higgins (A), Mebens Lake (B), Price Mill Lake (C), Britt-Fishman Lake (D), Carter Lake (E), Whitaker Lake (F), Hobbs Lake (G), Waynick Lake (H). Display/hide their locations on the map
In group quarters: 28 (-1 institutionalized population)
Size of family households: 2,093 2-persons, 1,195 3-persons, 965 4-persons, 306 5-persons, 63 6-persons, 28 7-or-more-persons
Size of nonfamily households: 845 1-person, 193 2-persons, 39 3-persons
2,510 married couples with children.
630 single-parent households (129 men, 501 women).
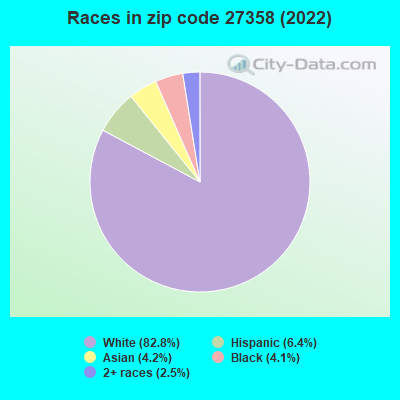
90.2% of residents of 27358 zip code speak English at home.
4.1% of residents speak Spanish at home (57% very well, 33% well, 10% not well).
2.6% of residents speak other Indo-European language at home (99% very well, 1% well).
1.1% of residents speak Asian or Pacific Island language at home (72% very well, 28% well).
1.7% of residents speak other language at home (94% very well, 6% well).
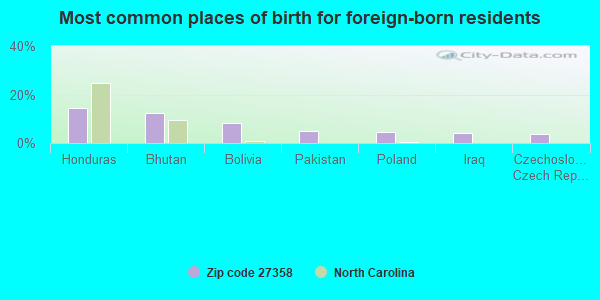
Foreign born population: 1,406 (8.9%) (54.3% of them are naturalized citizens)
This zip code:
8.9%
Whole state:
8.6%
14%Honduras
12%Bhutan
8%Bolivia
5%Pakistan
4%Poland
4%Iraq
4%Czechoslovakia (includes Czech Republic and Slovakia)
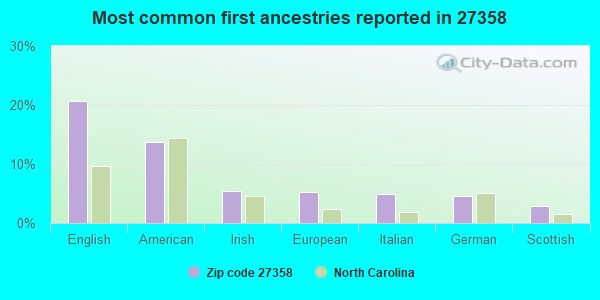
21%English
14%American
5%Irish
5%European
5%Italian
5%German
3%Scottish
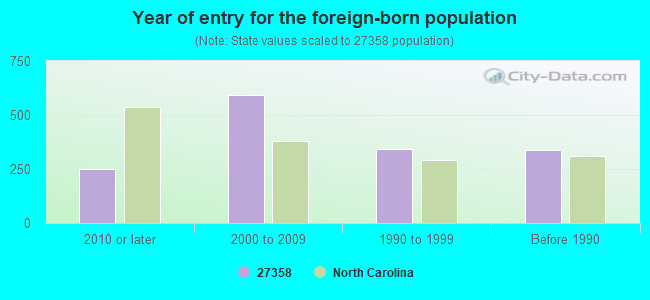
Year of entry for the foreign-born population
2482010 or later
5922000 to 2009
3421990 to 1999
339Before 1990
Facilities with environmental interests located in this zip code:
BETHANY UNITED METHODIST CHURCH (316 WITTY RD in SUMMERFIELD, NC)
(Integrated Compliance Information System) - ICIS-04-2001-0168, FORMAL ENFORCEMENT ACTION Business SIC classification: WATER SUPPLY; EATING PLACES
Housing units lacking complete plumbing facilities: 1.7% Housing units lacking complete kitchen facilities: 1.6%
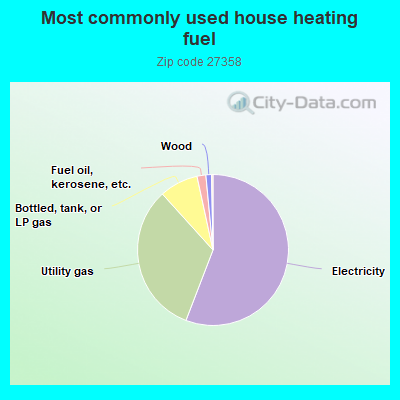
55.9%Electricity
32.5%Utility gas
8.3%Bottled, tank, or LP gas
1.9%Fuel oil, kerosene, etc.
1.2%Wood
Population in 1990: 5,937. Population change in the 1990s: +3,909 (+65.8%).
Place of birth for U.S.-born residents:
This state: 7,696
Northeast: 1,629
Midwest: 1,350
South: 2,719
West: 870
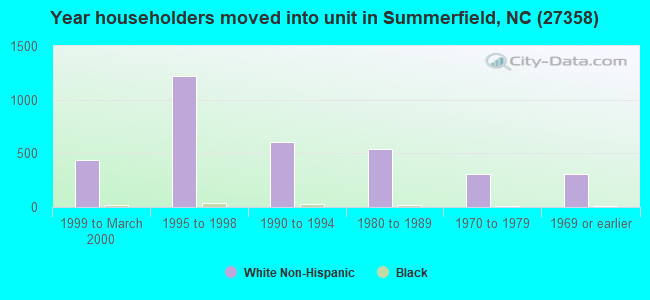
55% of the 27358 zip code residents lived in the same house 5 years ago. Out of people who lived in different houses, 55% lived in this county. Out of people who lived in different counties, 50% lived in North Carolina.
93% of the 27358 zip code residents lived in the same house 1 year ago. Out of people who lived in different houses, 42% moved from this county. Out of people who lived in different houses, 25% moved from different county within same state. Out of people who lived in different houses, 35% moved from different state. Out of people who lived in different houses, 2% moved from abroad.
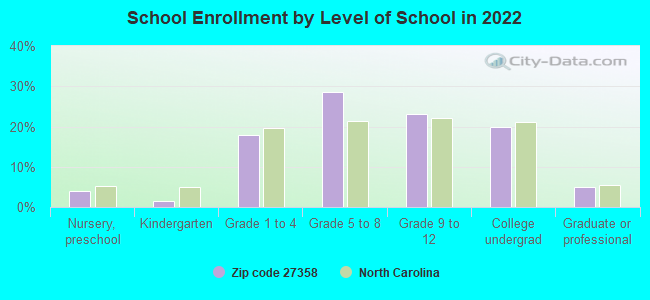
Private vs. public school enrollment:
Students in private schools in grades 1 to 8 (elementary and middle school): 504
Here:
27.2%
North Carolina:
13.8%
Students in private schools in grades 9 to 12 (high school): 232
Here:
25.3%
North Carolina:
11.9%
Students in private undergraduate colleges: 86
Here:
11.0%
North Carolina:
19.3%
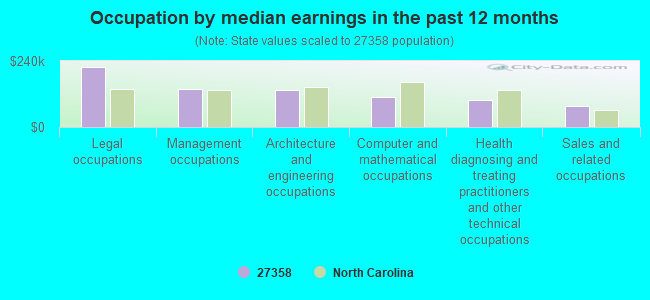
Occupation by median earnings in the past 12 months ($)
218,637Legal occupations
139,750Management occupations
134,213Architecture and engineering occupations
109,837Computer and mathematical occupations
99,545Health diagnosing and treating practitioners and other technical occupations
75,546Sales and related occupations
Companies with federal contracts located in this zip code:
CMP MEETING SERVICES (3505 VERNON WOODS DR in SUMMERFIELD, NC; small business) : $1,693,301 in 19 contractsfrom 2002 to 2006
Contracts for Audio/Visual Services, Public Relations Services(includes writing services, event planning and management, media relations, radio and television analysis, and press services), Lodging - Hotel/Motel, Other Management Support Services, and moreby Centers for Medicare & Medicaid Services, Department of State, Washington Headquarters Services, Centers for Disease Control and Prevention, and others Signed by year:2000: $0; 2001: $0; 2002: $93,000; 2003: $366,013; 2004: $55,408; 2005: $1,115,705; 2006: $63,175.
Biggest contracts:
$499,996 with Centers for Medicare & Medicaid Services for Audio/Visual Services. Signed on 2005-11-28. Effective on 2005-12-01. Completion date: 2006-11-30.
$494,168 with Centers for Medicare & Medicaid Services for Public Relations Services(includes writing services, event planning and management, media relations, radio and television analysis, and press services). Taking place in MD. Signed on 2005-01-26. Completion date: 2005-01-31.
$339,600, same as above.Signed on 2003-09-15. Completion date: 2004-09-15.
$93,000 with Department of State for Lodging - Hotel/Motel. Taking place in NY. Signed on 2002-08-15. Completion date: 2002-09-15.
BRADT LEADERSHIP CENTER (6793 MEADOW VIEW DR in SUMMERFIELD, NC; small business)
$8,000 with Army for Other Education and Training Services. Taking place in MA. Signed on 2004-07-09. Completion date: 2004-07-19.
BATES, MONI (8023 WITTY RD in SUMMERFIELD, NC; small business)
$6,100 with Army for Endangered Species Studies - Plant and Animal. Signed on 2002-03-04. Completion date: 2002-09-25.
Top industries in this zip code by the number of employees in 2005:
Construction: All Other Specialty Trade Contractors (50-99 employees: 1 establishment, 5-9 employees: 1 establishment)
Construction: Highway, Street, and Bridge Construction (50-99: 1)
Construction: New Single-Family Housing Construction (except Operative Builders) (10-19: 1, 5-9: 3, 1-4: 16)
Construction: Poured Concrete Foundation and Structure Contractors (20-49: 1, 5-9: 3)
Administrative and Support and Waste Management and Remediation Services: Landscaping Services (10-19: 1, 5-9: 1, 1-4: 13)
Health Care and Social Assistance: Child Day Care Services (20-49: 1, 10-19: 1)
Accommodation and Food Services: Snack and Nonalcoholic Beverage Bars (20-49: 1, 1-4: 3)
Health Care and Social Assistance: Offices of Physicians (except Mental Health Specialists) (20-49: 1, 1-4: 2)
Accommodation and Food Services: Full-Service Restaurants (20-49: 1, 1-4: 1)
People in group quarters in 2010:
10 people in group homes for juveniles (non-correctional)
6 people in group homes intended for adults
People in group quarters in 2000:
10 people in homes for the mentally retarded
Fatal accident statistics in 2014:
Fatal accident count: 1
Vehicles involved in fatal accidents: 1
Fatal accidents caused by drunken drivers: 0
Fatalities: 1
Persons involved in fatal accidents: 1
Pedestrians involved in fatal accidents: 1
Fatal accident statistics in 2013:
Fatal accident count: 2
Vehicles involved in fatal accidents: 3
Fatal accidents caused by drunken drivers: 0
Fatalities: 2
Persons involved in fatal accidents: 3
Pedestrians involved in fatal accidents: 1
Home Mortgage Disclosure Act Aggregated Statistics For Year 2009 (Based on 2 full and 10 partial tracts)
A) FHA, FSA/RHS & VA Home Purchase Loans
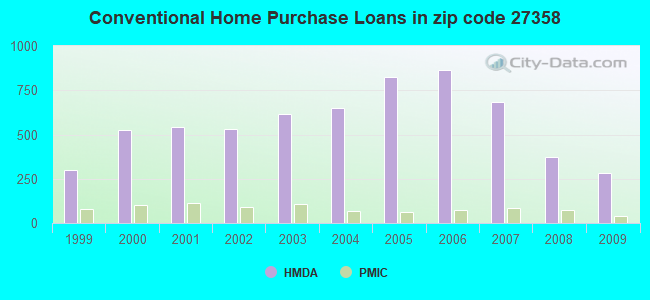
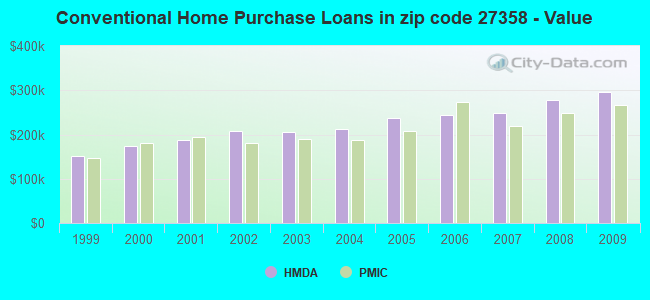
B) Conventional Home Purchase Loans
C) Refinancings
D) Home Improvement Loans
E) Loans on Dwellings For 5+ Families
F) Non-occupant Loans on < 5 Family Dwellings (A B C & D)
G) Loans On Manufactured Home Dwelling (A B C & D)
Number
Average Value
Number
Average Value
Number
Average Value
Number
Average Value
Number
Average Value
Number
Average Value
Number
Average Value
LOANS ORIGINATED
75
$201,073
282
$296,865
1,176
$250,605
25
$174,106
2
$3,834,720
35
$186,364
11
$88,992
APPLICATIONS APPROVED, NOT ACCEPTED
1
$228,740
14
$213,326
87
$258,241
5
$40,970
0
$0
3
$162,970
2
$123,815
APPLICATIONS DENIED
8
$187,848
21
$175,221
224
$246,252
10
$125,073
0
$0
8
$217,300
6
$63,445
APPLICATIONS WITHDRAWN
6
$131,800
40
$283,805
218
$248,719
2
$201,575
0
$0
4
$105,418
3
$69,900
FILES CLOSED FOR INCOMPLETENESS
2
$130,475
2
$139,830
43
$294,168
1
$98,920
0
$0
1
$91,860
1
$77,850
Aggregated Statistics For Year 2008 (Based on 2 full and 10 partial tracts)
A) FHA, FSA/RHS & VA Home Purchase Loans
B) Conventional Home Purchase Loans
C) Refinancings
D) Home Improvement Loans
F) Non-occupant Loans on < 5 Family Dwellings (A B C & D)
G) Loans On Manufactured Home Dwelling (A B C & D)
Number
Average Value
Number
Average Value
Number
Average Value
Number
Average Value
Number
Average Value
Number
Average Value
LOANS ORIGINATED
60
$197,304
375
$278,094
503
$226,816
22
$131,976
46
$186,249
15
$80,173
APPLICATIONS APPROVED, NOT ACCEPTED
3
$186,200
31
$296,778
99
$249,510
8
$82,909
4
$122,780
3
$85,453
APPLICATIONS DENIED
14
$158,330
43
$380,333
240
$211,610
26
$67,452
9
$273,923
12
$76,256
APPLICATIONS WITHDRAWN
11
$178,008
50
$264,255
148
$226,148
19
$98,655
8
$129,394
5
$107,716
FILES CLOSED FOR INCOMPLETENESS
3
$149,423
11
$389,375
32
$336,474
1
$79,240
0
$0
3
$116,933
Aggregated Statistics For Year 2007 (Based on 2 full and 10 partial tracts)
A) FHA, FSA/RHS & VA Home Purchase Loans
B) Conventional Home Purchase Loans
C) Refinancings
D) Home Improvement Loans
E) Loans on Dwellings For 5+ Families
F) Non-occupant Loans on < 5 Family Dwellings (A B C & D)
G) Loans On Manufactured Home Dwelling (A B C & D)
Number
Average Value
Number
Average Value
Number
Average Value
Number
Average Value
Number
Average Value
Number
Average Value
Number
Average Value
LOANS ORIGINATED
34
$148,290
681
$249,051
488
$215,661
57
$92,906
1
$900,340
63
$133,858
23
$81,024
APPLICATIONS APPROVED, NOT ACCEPTED
4
$233,935
70
$266,082
125
$186,120
17
$77,743
0
$0
10
$171,794
3
$86,280
APPLICATIONS DENIED
7
$174,473
89
$294,476
306
$232,878
47
$86,241
0
$0
14
$262,816
19
$88,732
APPLICATIONS WITHDRAWN
7
$135,194
68
$315,756
156
$207,674
22
$137,328
0
$0
10
$146,086
9
$95,590
FILES CLOSED FOR INCOMPLETENESS
0
$0
16
$400,569
42
$232,426
5
$172,986
0
$0
2
$57,480
0
$0
Aggregated Statistics For Year 2006 (Based on 2 full and 10 partial tracts)
A) FHA, FSA/RHS & VA Home Purchase Loans
B) Conventional Home Purchase Loans
C) Refinancings
D) Home Improvement Loans
F) Non-occupant Loans on < 5 Family Dwellings (A B C & D)
G) Loans On Manufactured Home Dwelling (A B C & D)
Number
Average Value
Number
Average Value
Number
Average Value
Number
Average Value
Number
Average Value
Number
Average Value
LOANS ORIGINATED
37
$164,489
863
$243,175
587
$194,624
49
$65,111
88
$192,885
22
$85,092
APPLICATIONS APPROVED, NOT ACCEPTED
1
$138,550
112
$190,323
134
$155,390
8
$74,504
8
$166,248
5
$87,728
APPLICATIONS DENIED
5
$138,832
119
$182,342
307
$174,121
31
$91,660
11
$211,096
35
$86,652
APPLICATIONS WITHDRAWN
3
$136,503
81
$220,111
149
$218,565
8
$111,830
10
$86,224
9
$102,359
FILES CLOSED FOR INCOMPLETENESS
0
$0
16
$209,777
62
$210,025
0
$0
2
$68,120
1
$86,520
Aggregated Statistics For Year 2005 (Based on 2 full and 10 partial tracts)
A) FHA, FSA/RHS & VA Home Purchase Loans
B) Conventional Home Purchase Loans
C) Refinancings
D) Home Improvement Loans
F) Non-occupant Loans on < 5 Family Dwellings (A B C & D)
G) Loans On Manufactured Home Dwelling (A B C & D)
Number
Average Value
Number
Average Value
Number
Average Value
Number
Average Value
Number
Average Value
Number
Average Value
LOANS ORIGINATED
45
$132,651
827
$236,424
657
$183,893
72
$114,540
67
$181,438
30
$116,458
APPLICATIONS APPROVED, NOT ACCEPTED
1
$103,240
61
$187,564
125
$181,810
7
$19,733
4
$105,658
10
$84,347
APPLICATIONS DENIED
8
$121,678
79
$197,263
366
$165,121
49
$109,780
23
$112,160
54
$91,642
APPLICATIONS WITHDRAWN
1
$121,700
82
$238,391
180
$177,667
8
$105,550
10
$193,890
11
$83,475
FILES CLOSED FOR INCOMPLETENESS
1
$67,060
12
$249,613
35
$246,810
3
$99,653
0
$0
0
$0
Aggregated Statistics For Year 2004 (Based on 2 full and 10 partial tracts)
A) FHA, FSA/RHS & VA Home Purchase Loans
B) Conventional Home Purchase Loans
C) Refinancings
D) Home Improvement Loans
F) Non-occupant Loans on < 5 Family Dwellings (A B C & D)
G) Loans On Manufactured Home Dwelling (A B C & D)
Number
Average Value
Number
Average Value
Number
Average Value
Number
Average Value
Number
Average Value
Number
Average Value
LOANS ORIGINATED
51
$132,312
647
$212,440
634
$181,822
55
$53,337
55
$139,472
26
$69,747
APPLICATIONS APPROVED, NOT ACCEPTED
3
$125,480
56
$194,154
104
$138,487
12
$124,565
7
$79,243
8
$76,959
APPLICATIONS DENIED
5
$106,960
63
$134,863
324
$158,175
47
$64,418
13
$93,345
44
$83,204
APPLICATIONS WITHDRAWN
3
$127,450
58
$187,266
186
$181,917
18
$125,922
5
$172,938
4
$85,220
FILES CLOSED FOR INCOMPLETENESS
0
$0
20
$213,961
43
$188,060
5
$41,218
4
$209,125
1
$50,000
Aggregated Statistics For Year 2003 (Based on 2 full and 8 partial tracts)
A) FHA, FSA/RHS & VA Home Purchase Loans
B) Conventional Home Purchase Loans
C) Refinancings
D) Home Improvement Loans
F) Non-occupant Loans on < 5 Family Dwellings (A B C & D)
Number
Average Value
Number
Average Value
Number
Average Value
Number
Average Value
Number
Average Value
LOANS ORIGINATED
43
$136,353
614
$204,675
1,681
$185,376
34
$40,358
42
$147,057
APPLICATIONS APPROVED, NOT ACCEPTED
1
$171,580
53
$187,173
148
$169,325
5
$42,530
10
$96,090
APPLICATIONS DENIED
3
$147,563
66
$151,590
258
$179,291
27
$22,073
10
$70,453
APPLICATIONS WITHDRAWN
2
$154,335
63
$200,413
188
$169,866
10
$29,279
8
$103,564
FILES CLOSED FOR INCOMPLETENESS
0
$0
12
$220,675
41
$169,692
0
$0
3
$70,177
Aggregated Statistics For Year 2002 (Based on 2 full and 6 partial tracts)
A) FHA, FSA/RHS & VA Home Purchase Loans
B) Conventional Home Purchase Loans
C) Refinancings
D) Home Improvement Loans
F) Non-occupant Loans on < 5 Family Dwellings (A B C & D)
Number
Average Value
Number
Average Value
Number
Average Value
Number
Average Value
Number
Average Value
LOANS ORIGINATED
33
$119,095
531
$207,760
917
$177,605
28
$55,448
37
$110,601
APPLICATIONS APPROVED, NOT ACCEPTED
1
$149,320
60
$148,020
107
$153,611
6
$18,995
4
$96,455
APPLICATIONS DENIED
6
$129,450
84
$139,466
207
$135,677
25
$40,655
7
$109,651
APPLICATIONS WITHDRAWN
3
$148,673
41
$193,180
90
$148,751
1
$70,570
3
$69,597
FILES CLOSED FOR INCOMPLETENESS
0
$0
17
$731,485
35
$185,328
0
$0
0
$0
Aggregated Statistics For Year 2001 (Based on 2 full and 6 partial tracts)
A) FHA, FSA/RHS & VA Home Purchase Loans
B) Conventional Home Purchase Loans
C) Refinancings
D) Home Improvement Loans
F) Non-occupant Loans on < 5 Family Dwellings (A B C & D)
Number
Average Value
Number
Average Value
Number
Average Value
Number
Average Value
Number
Average Value
LOANS ORIGINATED
52
$127,356
542
$188,616
727
$169,707
38
$59,900
28
$155,868
APPLICATIONS APPROVED, NOT ACCEPTED
0
$0
67
$123,860
70
$144,160
6
$34,583
2
$93,460
APPLICATIONS DENIED
3
$107,863
76
$90,049
149
$120,338
17
$14,439
4
$41,085
APPLICATIONS WITHDRAWN
2
$115,630
28
$222,682
110
$169,393
3
$51,890
1
$137,120
FILES CLOSED FOR INCOMPLETENESS
0
$0
3
$160,623
20
$242,029
0
$0
0
$0
Aggregated Statistics For Year 2000 (Based on 2 full and 6 partial tracts)
A) FHA, FSA/RHS & VA Home Purchase Loans
B) Conventional Home Purchase Loans
C) Refinancings
D) Home Improvement Loans
F) Non-occupant Loans on < 5 Family Dwellings (A B C & D)
Number
Average Value
Number
Average Value
Number
Average Value
Number
Average Value
Number
Average Value
LOANS ORIGINATED
38
$130,898
528
$174,716
174
$125,168
34
$24,704
22
$67,041
APPLICATIONS APPROVED, NOT ACCEPTED
9
$82,233
61
$120,911
68
$115,120
21
$21,199
4
$70,412
APPLICATIONS DENIED
5
$83,920
123
$87,276
115
$113,879
44
$34,715
9
$39,236
APPLICATIONS WITHDRAWN
4
$101,898
51
$161,521
58
$119,071
6
$49,817
3
$32,567
FILES CLOSED FOR INCOMPLETENESS
0
$0
14
$262,104
22
$87,057
0
$0
2
$153,280
Aggregated Statistics For Year 1999 (Based on 1 full and 4 partial tracts)
A) FHA, FSA/RHS & VA Home Purchase Loans
B) Conventional Home Purchase Loans
C) Refinancings
D) Home Improvement Loans
F) Non-occupant Loans on < 5 Family Dwellings (A B C & D)
2002 - 2018 National Fire Incident Reporting System (NFIRS) incidents
Based on the data from the years 2002 - 2018 the average number of fire incidents per year is 48. The highest number of fires - 81 took place in 2007, and the least - 10 in 2004. The data has a growing trend.
When looking into fire subcategories, the most reports belonged to: Structure Fires (51.0%), and Outside Fires (38.0%).
Fire incident types reported to NFIRS in Zip Code 27358


 Nearest zip codes: 27455, 27357, 27410, 27310, 27409, 27408.
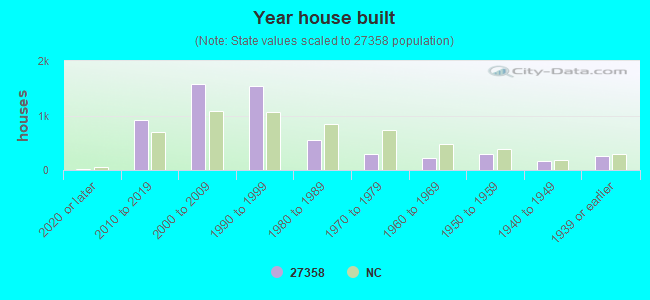


 Based on the data from the years 2002 - 2018 the average number of fire incidents per year is 48. The highest number of fires - 81 took place in 2007, and the least - 10 in 2004. The data has a growing trend.
 When looking into fire subcategories, the most reports belonged to: Structure Fires (51.0%), and Outside Fires (38.0%).