Races in Chicopee, Massachusetts (MA) Detailed Stats
Data:
Races - White alone (%)
Races - White alone (% change since 2000)
Races - Black alone (%)
Races - Black alone (% change since 2000)
Races - American Indian alone (%)
Races - American Indian alone (% change since 2000)
Races - Asian alone (%)
Races - Asian alone (% change since 2000)
Races - Hispanic (%)
Races - Hispanic (% change since 2000)
Races - Native Hawaiian and Other Pacific Islander alone (%)
Races - Native Hawaiian and Other Pacific Islander alone (% change since 2000)
Races - Two or more races(%)
Races - Two or more races(% change since 2000)
Races - Other race alone (%)
Races - Other race alone (% change since 2000)
Racial diversity
Place of birth - Born in state of residence (%)
Place of birth - Born in state of residence (%) - White
Place of birth - Born in state of residence (%) - Black or African American
Place of birth - Born in state of residence (%) - Asian
Place of birth - Born in state of residence (%) - Hispanic or Latino
Place of birth - Born in state of residence (%) - American Indian and Alaska Native
Place of birth - Born in state of residence (%) - Multirace
Place of birth - Born in state of residence (%) - Other Race
Place of birth - Born in other state (%)
Place of birth - Born in other state (%) - White
Place of birth - Born in other state (%) - Black or African American
Place of birth - Born in other state (%) - Asian
Place of birth - Born in other state (%) - Hispanic or Latino
Place of birth - Born in other state (%) - American Indian and Alaska Native
Place of birth - Born in other state (%) - Multirace
Place of birth - Born in other state (%) - Other Race
Place of birth - Native, outside of US (%)
Place of birth - Native, outside of US (%) - White
Place of birth - Native, outside of US (%) - Black or African American
Place of birth - Native, outside of US (%) - Asian
Place of birth - Native, outside of US (%) - Hispanic or Latino
Place of birth - Native, outside of US (%) - American Indian and Alaska Native
Place of birth - Native, outside of US (%) - Multirace
Place of birth - Native, outside of US (%) - Other Race
Place of birth - Foreign born (%)
Place of birth - Foreign born (%) - White
Place of birth - Foreign born (%) - Black or African American
Place of birth - Foreign born (%) - Asian
Place of birth - Foreign born (%) - Hispanic or Latino
Place of birth - Foreign born (%) - American Indian and Alaska Native
Place of birth - Foreign born (%) - Multirace
Place of birth - Foreign born (%) - Other Race
Residents speaking English at home (%)
Residents speaking English at home - Born in the United States (%)
Residents speaking English at home - Native, born elsewhere (%)
Residents speaking English at home - Foreign born (%)
Residents speaking Spanish at home (%)
Residents speaking Spanish at home - Born in the United States (%)
Residents speaking Spanish at home - Native, born elsewhere (%)
Residents speaking Spanish at home - Foreign born (%)
Residents speaking other language at home (%)
Residents speaking other language at home - Born in the United States (%)
Residents speaking other language at home - Native, born elsewhere (%)
Residents speaking other language at home - Foreign born (%)
Marital status - Never married (%)
Marital status - Now married (%)
Marital status - Separated (%)
Marital status - Widowed (%)
Marital status - Divorced (%)
Ancestries Reported - Arab (%)
Ancestries Reported - Czech (%)
Ancestries Reported - Danish (%)
Ancestries Reported - Dutch (%)
Ancestries Reported - English (%)
Ancestries Reported - French (%)
Ancestries Reported - French Canadian (%)
Ancestries Reported - German (%)
Ancestries Reported - Greek (%)
Ancestries Reported - Hungarian (%)
Ancestries Reported - Irish (%)
Ancestries Reported - Italian (%)
Ancestries Reported - Lithuanian (%)
Ancestries Reported - Norwegian (%)
Ancestries Reported - Polish (%)
Ancestries Reported - Portuguese (%)
Ancestries Reported - Russian (%)
Ancestries Reported - Scotch-Irish (%)
Ancestries Reported - Scottish (%)
Ancestries Reported - Slovak (%)
Ancestries Reported - Subsaharan African (%)
Ancestries Reported - Swedish (%)
Ancestries Reported - Swiss (%)
Ancestries Reported - Ukrainian (%)
Ancestries Reported - United States (%)
Ancestries Reported - Welsh (%)
Ancestries Reported - West Indian (%)
Ancestries Reported - Other (%)
Geographical mobility - Same house 1 year ago (%)
Geographical mobility - Same house 1 year ago (%) - White
Geographical mobility - Same house 1 year ago (%) - Black or African American
Geographical mobility - Same house 1 year ago (%) - Asian
Geographical mobility - Same house 1 year ago (%) - Hispanic or Latino
Geographical mobility - Same house 1 year ago (%) - American Indian and Alaska Native
Geographical mobility - Same house 1 year ago (%) - Multirace
Geographical mobility - Same house 1 year ago (%) - Other Race
Geographical mobility - Moved within same county (%)
Geographical mobility - Moved within same county (%) - White
Geographical mobility - Moved within same county (%) - Black or African American
Geographical mobility - Moved within same county (%) - Asian
Geographical mobility - Moved within same county (%) - Hispanic or Latino
Geographical mobility - Moved within same county (%) - American Indian and Alaska Native
Geographical mobility - Moved within same county (%) - Multirace
Geographical mobility - Moved within same county (%) - Other Race
Geographical mobility - Moved from different county within same state (%)
Geographical mobility - Moved from different county within same state (%) - White
Geographical mobility - Moved from different county within same state (%) - Black or African American
Geographical mobility - Moved from different county within same state (%) - Asian
Geographical mobility - Moved from different county within same state (%) - Hispanic or Latino
Geographical mobility - Moved from different county within same state (%) - American Indian and Alaska Native
Geographical mobility - Moved from different county within same state (%) - Multirace
Geographical mobility - Moved from different county within same state (%) - Other Race
Geographical mobility - Moved from different state (%)
Geographical mobility - Moved from different state (%) - White
Geographical mobility - Moved from different state (%) - Black or African American
Geographical mobility - Moved from different state (%) - Asian
Geographical mobility - Moved from different state (%) - Hispanic or Latino
Geographical mobility - Moved from different state (%) - American Indian and Alaska Native
Geographical mobility - Moved from different state (%) - Multirace
Geographical mobility - Moved from different state (%) - Other Race
Geographical mobility - Moved from abroad (%)
Geographical mobility - Moved from abroad (%) - White
Geographical mobility - Moved from abroad (%) - Black or African American
Geographical mobility - Moved from abroad (%) - Asian
Geographical mobility - Moved from abroad (%) - Hispanic or Latino
Geographical mobility - Moved from abroad (%) - American Indian and Alaska Native
Geographical mobility - Moved from abroad (%) - Multirace
Geographical mobility - Moved from abroad (%) - Other Race
Place of birth for the foreign-born population - Ireland (%)
Place of birth for the foreign-born population - Denmark (%)
Place of birth for the foreign-born population - Norway (%)
Place of birth for the foreign-born population - Sweden (%)
Place of birth for the foreign-born population - United Kingdom (%)
Place of birth for the foreign-born population - England (%)
Place of birth for the foreign-born population - Scotland (%)
Place of birth for the foreign-born population - Other Northern Europe (%)
Place of birth for the foreign-born population - Austria (%)
Place of birth for the foreign-born population - Belgium (%)
Place of birth for the foreign-born population - France (%)
Place of birth for the foreign-born population - Germany (%)
Place of birth for the foreign-born population - Netherlands (%)
Place of birth for the foreign-born population - Switzerland (%)
Place of birth for the foreign-born population - Other Western Europe (%)
Place of birth for the foreign-born population - Greece (%)
Place of birth for the foreign-born population - Italy (%)
Place of birth for the foreign-born population - Portugal (%)
Place of birth for the foreign-born population - Spain (%)
Place of birth for the foreign-born population - Other Southern Europe (%)
Place of birth for the foreign-born population - Albania (%)
Place of birth for the foreign-born population - Belarus (%)
Place of birth for the foreign-born population - Bosnia and Herzegovina (%)
Place of birth for the foreign-born population - Bulgaria (%)
Place of birth for the foreign-born population - Croatia (%)
Place of birth for the foreign-born population - Czechoslovakia (%)
Place of birth for the foreign-born population - Hungary (%)
Place of birth for the foreign-born population - Latvia (%)
Place of birth for the foreign-born population - Lithuania (%)
Place of birth for the foreign-born population - North Macedonia (Macedonia) (%)
Place of birth for the foreign-born population - Moldova (%)
Place of birth for the foreign-born population - Poland (%)
Place of birth for the foreign-born population - Romania (%)
Place of birth for the foreign-born population - Russia (%)
Place of birth for the foreign-born population - Serbia (%)
Place of birth for the foreign-born population - Ukraine (%)
Place of birth for the foreign-born population - Other Eastern Europe (%)
Place of birth for the foreign-born population - China (%)
Place of birth for the foreign-born population - Hong Kong (%)
Place of birth for the foreign-born population - Taiwan (%)
Place of birth for the foreign-born population - Japan (%)
Place of birth for the foreign-born population - Korea (%)
Place of birth for the foreign-born population - Other Eastern Asia (%)
Place of birth for the foreign-born population - Afghanistan (%)
Place of birth for the foreign-born population - Bangladesh (%)
Place of birth for the foreign-born population - India (%)
Place of birth for the foreign-born population - Iran (%)
Place of birth for the foreign-born population - Kazakhstan (%)
Place of birth for the foreign-born population - Nepal (%)
Place of birth for the foreign-born population - Pakistan (%)
Place of birth for the foreign-born population - Sri Lanka (%)
Place of birth for the foreign-born population - Uzbekistan (%)
Place of birth for the foreign-born population - Other South Central Asia (%)
Place of birth for the foreign-born population - Burma (%)
Place of birth for the foreign-born population - Cambodia (%)
Place of birth for the foreign-born population - Indonesia (%)
Place of birth for the foreign-born population - Laos (%)
Place of birth for the foreign-born population - Malaysia (%)
Place of birth for the foreign-born population - Philippines (%)
Place of birth for the foreign-born population - Singapore (%)
Place of birth for the foreign-born population - Thailand (%)
Place of birth for the foreign-born population - Vietnam (%)
Place of birth for the foreign-born population - Other South Eastern Asia (%)
Place of birth for the foreign-born population - Armenia (%)
Place of birth for the foreign-born population - Iraq (%)
Place of birth for the foreign-born population - Israel (%)
Place of birth for the foreign-born population - Jordan (%)
Place of birth for the foreign-born population - Kuwait (%)
Place of birth for the foreign-born population - Lebanon (%)
Place of birth for the foreign-born population - Saudi Arabia (%)
Place of birth for the foreign-born population - Syria (%)
Place of birth for the foreign-born population - Turkey (%)
Place of birth for the foreign-born population - Yemen (%)
Place of birth for the foreign-born population - Other Western Asia (%)
Place of birth for the foreign-born population - Eritrea (%)
Place of birth for the foreign-born population - Ethiopia (%)
Place of birth for the foreign-born population - Kenya (%)
Place of birth for the foreign-born population - Somalia (%)
Place of birth for the foreign-born population - Uganda (%)
Place of birth for the foreign-born population - Zimbabwe (%)
Place of birth for the foreign-born population - Other Eastern Africa (%)
Place of birth for the foreign-born population - Cameroon (%)
Place of birth for the foreign-born population - Congo (%)
Place of birth for the foreign-born population - Democratic Republic of Congo (Zaire) (%)
Place of birth for the foreign-born population - Other Middle Africa (%)
Place of birth for the foreign-born population - Egypt (%)
Place of birth for the foreign-born population - Morocco (%)
Place of birth for the foreign-born population - Sudan (%)
Place of birth for the foreign-born population - Other Northern Africa (%)
Place of birth for the foreign-born population - South Africa (%)
Place of birth for the foreign-born population - Other Southern Africa (%)
Place of birth for the foreign-born population - Cabo Verde (%)
Place of birth for the foreign-born population - Ghana (%)
Place of birth for the foreign-born population - Liberia (%)
Place of birth for the foreign-born population - Nigeria (%)
Place of birth for the foreign-born population - Senegal (%)
Place of birth for the foreign-born population - Sierra Leone (%)
Place of birth for the foreign-born population - Other Western Africa (%)
Place of birth for the foreign-born population - Australia (%)
Place of birth for the foreign-born population - New Zealand (%)
Place of birth for the foreign-born population - Fiji (%)
Place of birth for the foreign-born population - Micronesia (%)
Place of birth for the foreign-born population - Bahamas (%)
Place of birth for the foreign-born population - Barbados (%)
Place of birth for the foreign-born population - Cuba (%)
Place of birth for the foreign-born population - Dominica (%)
Place of birth for the foreign-born population - Dominican Republic (%)
Place of birth for the foreign-born population - Grenada (%)
Place of birth for the foreign-born population - Haiti (%)
Place of birth for the foreign-born population - Jamaica (%)
Place of birth for the foreign-born population - St. Vincent and the Grenadines (%)
Place of birth for the foreign-born population - Trinidad and Tobago (%)
Place of birth for the foreign-born population - West Indies (%)
Place of birth for the foreign-born population - Other Caribbean (%)
Place of birth for the foreign-born population - Belize (%)
Place of birth for the foreign-born population - Costa Rica (%)
Place of birth for the foreign-born population - El Salvador (%)
Place of birth for the foreign-born population - Guatemala (%)
Place of birth for the foreign-born population - Honduras (%)
Place of birth for the foreign-born population - Mexico (%)
Place of birth for the foreign-born population - Nicaragua (%)
Place of birth for the foreign-born population - Panama (%)
Place of birth for the foreign-born population - Other Central America (%)
Place of birth for the foreign-born population - Argentina (%)
Place of birth for the foreign-born population - Bolivia (%)
Place of birth for the foreign-born population - Brazil (%)
Place of birth for the foreign-born population - Chile (%)
Place of birth for the foreign-born population - Colombia (%)
Place of birth for the foreign-born population - Ecuador (%)
Place of birth for the foreign-born population - Guyana (%)
Place of birth for the foreign-born population - Peru (%)
Place of birth for the foreign-born population - Uruguay (%)
Place of birth for the foreign-born population - Venezuela (%)
Place of birth for the foreign-born population - Other South America (%)
Place of birth for the foreign-born population - Canada (%)
Place of birth for the foreign-born population - Other Northern America (%)
Place of birth for the foreign-born population - Other (%)
Latest news about races in Chicopee, MA collected exclusively by city-data.com from local newspapers, TV, and radio stations
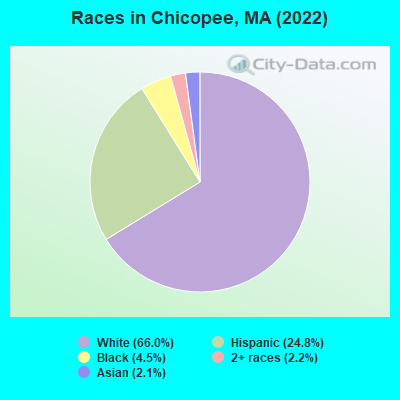
According to 2022 data, the most numerous races in Chicopee, MA are White alone (36,322 residents), Hispanic (13,636 residents), and Asian alone (1,146 residents). 77.0% of Chicopee residents speak English at home. 9.3% of Chicopee, MA residents are foreign-born (3.7% born in Europe, 2.5% born in Asia, 1.4% born in Latin America, 1.0% born in North America), which is 94.6% less than the foreign-born rate of 18.0% across the entire state of Massachusetts.
Race distribution in Chicopee
2000 2022
5,198,359 81.9% White alone 428,729 6.8% Hispanic 318,329 5.0% Black alone 236,786 3.7% Asian alone 110,338 1.7% Two or more races 43,586 0.7% Other race alone 11,264 0.2% American Indian alone 1,706 0.03% Native Hawaiian and Other
4,676,627 67.0% White alone 911,038 13.0% Hispanic 501,463 7.2% Asian alone 459,740 6.6% Black alone 341,889 4.9% Two or more races 84,403 1.2% Other race alone 5,838 0.08% American Indian alone 976 0.01% Native Hawaiian and Other
Income and house value in Chicopee Median household income in 2022 $71,635 White non-Hispanic householders$50,715 Black householders$54,844 Asian householders$55,876 Some other race householders$32,852 Two or more races householders$44,138 Hispanic or Latino race householdersMedian 2022 house value $259,073 White Non-Hispanic householders$271,681 Black or African American householders$312,470 American Indian or Alaska Native householders $293,683 Asian householders$401,712 Native Hawaiian and other Pacific Islander householders$265,254 Some other race householders$232,869 Two or more races householders$250,668 Hispanic or Latino householders
Median age by race in Chicopee
49.3 Median age for White residents48.4 50.1 32.6 Median age for Black or African American residents33.4 29.0 -655,238,094.6 Median age for American Indian / Alaska Native residents-649,474,688.9 -657,223,795.4 37.5 Median age for Asian residents42.3 36.6 -514,227,641.8 Median age for Native Hawaiian / Pacific Islander residents-666,666,666.0 -508,717,948.2 33.5 Median age for Other race residents32.5 35.3 22.7 Median age for Two or more races residents21.7 24.2 50.2 Median age for White alone residents48.7 51.2 28.3 Median age for Hispanic or Latino residents28.6 26.5
Owner/renter occupied households by race in Chicopee
House owners and renters - White residents 12,141 71.4% Owner occupied4,860 28.6% Renter occupiedHouse owners and renters - Black or African American residents 231 16.7% Owner occupied1,156 83.3% Renter occupiedHouse owners and renters - American Indian / Alaska Native residents 3 10.9% Owner occupied28 89.1% Renter occupiedHouse owners and renters - Asian residents 281 49.3% Owner occupied290 50.7% Renter occupiedHouse owners and renters - Other race residents 568 30.6% Owner occupied1,287 69.4% Renter occupiedHouse owners and renters - Two or more races residents 379 17.8% Owner occupied1,757 82.2% Renter occupiedHouse owners and renters - White alone residents 11,900 69.1% Owner occupied5,322 30.9% Renter occupiedHouse owners and renters - Hispanic or Latino residents 1,290 29.2% Owner occupied3,123 70.8% Renter occupied
Language usage in Chicopee
English speakers - Total 77.0% of residents of Chicopee speak English at home.
14.2% of residents speak Spanish at home 5,470 73.4% Speak English very well1,983 26.6% Speak English less than very well9.0% of residents speak other language at home 2,900 61.5% Speak English very well1,818 38.5% Speak English less than very well
English speakers - Born in the United States 83.4% of residents of Chicopee speak English at home.
14.3% of residents speak Spanish at home 1,151 91.9% Speak English very well101 8.1% Speak English less than very well2.3% of residents speak other language at home 189 95.5% Speak English very well9 4.5% Speak English less than very well
English speakers - Native, born elsewhere 24.9% of residents of Chicopee speak English at home.
74.2% of residents speak Spanish at home 1,271 47.2% Speak English very well1,419 52.8% Speak English less than very well1.9% of residents speak other language at home 42 60.9% Speak English very well27 39.1% Speak English less than very well
English speakers - Foreign-born 23.6% of residents of Chicopee speak English at home.
12.4% of residents speak Spanish at home 332 53.5% Speak English very well288 46.5% Speak English less than very well62.5% of residents speak other language at home 1,463 46.7% Speak English very well1,671 53.3% Speak English less than very well
White (Caucasian) - Speak only English Native:
97.2% (32,084)Foreign-born:
27.1% (778)
White (Caucasian) - Speak another language Native:
4.9% (1,610)Foreign-born:
72.4% (2,081)
Black or African American - Speak only English Native:
77.9% (2,222)Foreign-born:
20.2% (75)
Black or African American - Speak another language Native:
19.8% (564)Foreign-born:
79.1% (294)
Asian - Speak only English Native:
81.8% (121)Foreign-born:
13.2% (136)
Asian - Speak another language Native:
25.5% (38)Foreign-born:
86.7% (888)
Other race - Speak only English Native:
33.2% (1,760)Foreign-born:
30.4% (106)
Other race - Speak another language Native:
67.0% (3,550)Foreign-born:
75.2% (261)
Two or more races - Speak only English Native:
49.9% (2,744)Foreign-born:
27.8% (51)
Two or more races - Speak another language Native:
49.7% (2,735)Foreign-born:
72.6% (133)
White alone - Speak only English Native:
95.3% (30,719)Foreign-born:
25.6% (746)
White alone - Speak another language Native:
4.8% (1,545)Foreign-born:
73.9% (2,155)
Hispanic or Latino - Speak only English Native:
45.9% (5,420)Foreign-born:
22.2% (184)
Hispanic or Latino - Speak another language Native:
55.8% (6,584)Foreign-born:
79.6% (658)
Foreign-born residents in Chicopee 5,090 residents are foreign born (3.7% Europe , 2.5% Asia , 1.4% Latin America , 1.0% North America ).
This city:
9.3%Massachusetts:
17.6%
Marital status for residents in Chicopee Marital status - White (Caucasian) population 15 years and over
Males 40.4% Never married42.8% Now married1.1% Separated3.5% Widowed12.1% DivorcedFemales 31.1% Never married41.8% Now married1.4% Separated12.5% Widowed13.2% DivorcedWomen who gave birth in the past 12 months Now married:
67.5% (241)Unmarried:
32.5% (116)
Women who did not give birth in the past 12 months Now married:
37.9% (2,860)Unmarried:
62.1% (4,690)
Marital status - Black or African American population 15 years and over
Males 58.4% Never married16.6% Now married1.8% Separated1.3% Widowed21.9% DivorcedFemales 51.7% Never married22.9% Now married0.0% Separated1.7% Widowed23.7% DivorcedWomen who did not give birth in the past 12 months Now married:
25.9% (251)Unmarried:
74.1% (718)
Marital status - American Indian / Alaska Native population 15 years and over
Males 0.0% Never married100.0% Now married0.0% Separated0.0% Widowed0.0% DivorcedFemales 100.0% Never married0.0% Now married0.0% Separated0.0% Widowed0.0% DivorcedMarital status - Asian population 15 years and over
Males 47.0% Never married47.3% Now married1.5% Separated0.0% Widowed4.2% DivorcedFemales 41.4% Never married46.2% Now married0.0% Separated1.2% Widowed11.2% DivorcedWomen who did not give birth in the past 12 months Now married:
39.4% (176)Unmarried:
60.6% (270)
Marital status - Other race population 15 years and over
Males 55.2% Never married25.6% Now married0.7% Separated1.2% Widowed17.2% DivorcedFemales 55.3% Never married24.7% Now married2.6% Separated2.9% Widowed14.5% DivorcedWomen who gave birth in the past 12 months Now married:
16.5% (24)Unmarried:
83.5% (122)
Women who did not give birth in the past 12 months Now married:
25.3% (461)Unmarried:
74.7% (1,365)
Marital status - Two or more races population 15 years and over
Males 70.6% Never married15.5% Now married1.5% Separated0.0% Widowed12.3% DivorcedFemales 62.4% Never married16.0% Now married0.0% Separated6.2% Widowed15.3% DivorcedWomen who gave birth in the past 12 months Now married:
100.0% (87)Unmarried:
0.0% (0)
Women who did not give birth in the past 12 months Now married:
11.5% (235)Unmarried:
88.5% (1,804)
Marital status - White alone, not Hispanic / Latino population 15 years and over
Males 38.5% Never married44.6% Now married1.2% Separated3.9% Widowed11.7% DivorcedFemales 27.2% Never married44.8% Now married1.2% Separated13.1% Widowed13.8% DivorcedWomen who gave birth in the past 12 months Now married:
75.5% (277)Unmarried:
24.5% (90)
Women who did not give birth in the past 12 months Now married:
42.4% (3,097)Unmarried:
57.6% (4,214)
Marital status - Hispanic or Latino population 15 years and over
Males 57.7% Never married23.1% Now married0.4% Separated0.4% Widowed18.3% DivorcedFemales 62.9% Never married20.5% Now married2.4% Separated4.6% Widowed9.5% DivorcedWomen who gave birth in the past 12 months Now married:
35.4% (74)Unmarried:
64.6% (134)
Women who did not give birth in the past 12 months Now married:
19.9% (815)Unmarried:
80.1% (3,275)
Ancestries in Chicopee
3,672 14.2% Polish2,426 9.4% French Canadian1,972 7.6% French1,321 5.1% Irish1,222 4.7% American876 3.4% English613 2.4% Portuguese585 2.3% Russian532 2.1% Italian350 1.4% Canadian344 1.3% German158 0.6% Greek148 0.6% Scottish109 0.4% African102 0.4% Ukrainian75 0.3% U.S. Virgin Islander72 0.3% Finnish66 0.3% Nigerian63 0.2% European62 0.2% Lebanese61 0.2% Jamaican54 0.2% Arab49 0.2% British44 0.2% Welsh42 0.2% Scotch-Irish38 0.1% Haitian31 0.1% Norwegian26 0.1% Danish24 0.09% Turkish24 0.09% Iraqi22 0.08% British West Indian19 0.07% Yugoslavian13 0.05% Eastern European13 0.05% Ghanaian12 0.05% Romanian11 0.04% Dutch10 0.04% Brazilian9 0.03% Lithuanian8 0.03% Cape Verdean6 0.02% Czech6 0.02% Swedish4 0.02% Hungarian2 0.01% Northern European
Geographical mobility in Chicopee Same house 1 year ago 34,618 93.8% White (Caucasian)2,749 82.8% Black or African American37 100.0% American Indian / Alaska Native1,093 86.2% Asian5,262 91.6% Other race5,847 90.2% Two or more races34,177 94.4% White alone, not Hispanic / Latino11,799 87.6% Hispanic or LatinoMoved within same county 1,183 3.2% White / Caucasian338 10.2% Black or African American22 1.7% Asian170 3.0% Other race327 5.0% Two or more races901 2.5% White alone, not Hispanic / Latino1,356 10.1% Hispanic or LatinoMoved within same state 500 1.4% White / Caucasian41 3.2% Asian176 3.1% Other race106 1.6% Two or more races537 1.5% White alone, not Hispanic / Latino166 1.2% Hispanic or LatinoMoved from different state 343 0.9% White / Caucasian64 1.9% Black or African American51 4.0% Asian27 0.5% Other race5 0.1% Two or more races315 0.9% White alone, not Hispanic / Latino46 0.3% Hispanic or LatinoMoved from abroad 257 0.7% White105 3.2% Black or African American71 5.6% Asian27 0.5% Other race71 1.1% Two or more races100 0.3% White alone, not Hispanic / Latino111 0.8% Hispanic or Latino
Children Nativity (place of birth) in Chicopee
Children under 6 years - Living with two parents Both parents native 935 100.0% NativeBoth parents foreign-born 183 92.0% Native16 8.0% Foreign-bornOne native, one foreign-born parent 119 100.0% NativeChildren under 6 years - Living with one parent Native parent 1,327 100.0% NativeForeign-born parent 72 100.0% NativeChildren 6 to 17 years - Living with two parents Both parents native 2,522 100.0% Native0 0.0% Foreign-bornBoth parents foreign-born 188 71.2% Native76 28.8% Foreign-bornOne native, one foreign-born parent 540 100.0% NativeChildren 6 to 17 years - Living with one parent Native parent 3,020 100.0% NativeForeign-born parent 663 50.6% Native647 49.4% Foreign-born
Grandparents responsible for own grandchildren in Chicopee
Grandparents (30 to 59 years) White / Caucasian 16 21.7% Responsible for grandchildren56 78.3% Not responsible for grandchildrenBlack or African American 8 22.4% Responsible for grandchildren29 77.6% Not responsible for grandchildrenOther race 32 100.0% Not responsible for grandchildrenTwo or more races 10 100.0% Not responsible for grandchildrenWhite alone, not Hispanic / Latino 26 32.1% Responsible for grandchildren54 67.9% Not responsible for grandchildrenHispanic or Latino 13 13.1% Responsible for grandchildren84 86.9% Not responsible for grandchildrenGrandparents (60 years and over) White / Caucasian 85 26.4% Responsible for grandchildren237 73.6% Not responsible for grandchildrenTwo or more races 11 100.0% Responsible for grandchildrenWhite alone, not Hispanic / Latino 80 24.4% Responsible for grandchildren250 75.6% Not responsible for grandchildren