Estimated zip code population in 2022: 2,143 Zip code population in 2010: 2,451 Zip code population in 2000: 2,331
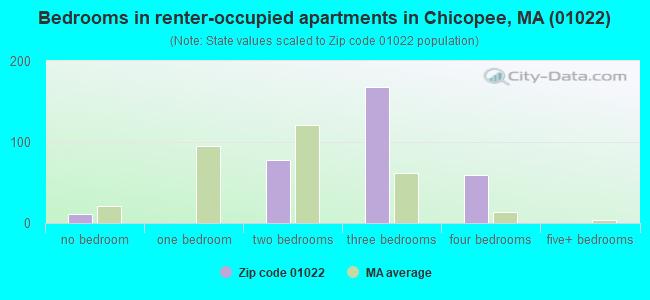
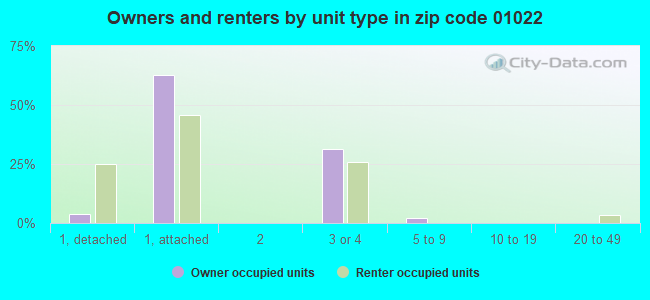
Houses and condos: 1,107 Renter-occupied apartments: 313
% of renters here:
29%
State:
38%
March 2022 cost of living index in zip code 01022: 119.2 (more than average, U.S. average is 100)
Land area: 4.8 sq. mi. Water area: 0.0 sq. mi.
Population density: 450 people per square mile
(low).
OSM Map
Google Map
MSN Map
OSM Map
General Map
Google Map
MSN Map
OSM Map
Google Map
MSN Map
OSM Map
Google Map
MSN Map
Please wait while loading the map...
Real estate property taxes paid for housing units in 2022:
This zip code:
1.6% ($2,502)
Massachusetts:
1.0% ($5,536)
Median real estate property taxes paid for housing units with mortgages in 2022: $2,397 (1.5%) Median real estate property taxes paid for housing units with no mortgage in 2022: $2,706 (1.5%)
Business Search- 14 Million verified businesses
Males: 953
(44.5%)
Females: 1,190
(55.5%)
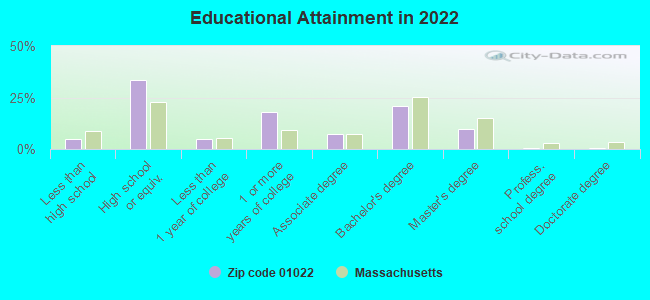
For population 25 years and over in 01022:
High school or higher: 94.3%
Bachelor's degree or higher: 31.1%
Graduate or professional degree: 10.3%
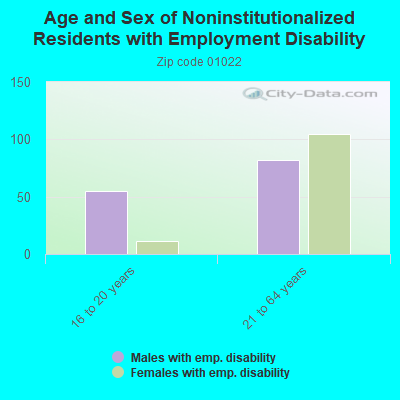
Unemployed: 6.7%
Mean travel time to work (commute): 15.9 minutes
For population 15 years and over in 01022:
Never married: 43.8%
Now married: 23.1%
Separated: 1.9%
Widowed: 9.1%
Divorced: 22.1%
Zip code 01022 compared to state average:
Median household income below state average.
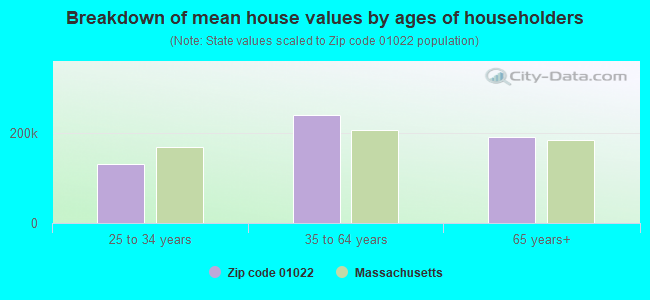
Median house value significantly below state average.
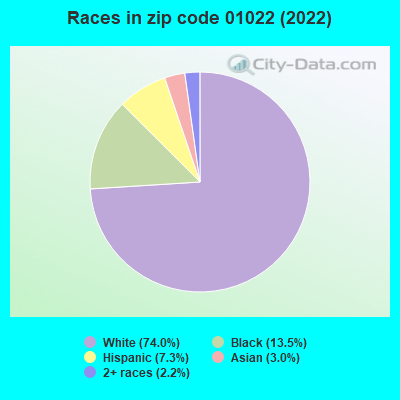
Black race population percentage above state average.
Hispanic race population percentage below state average.
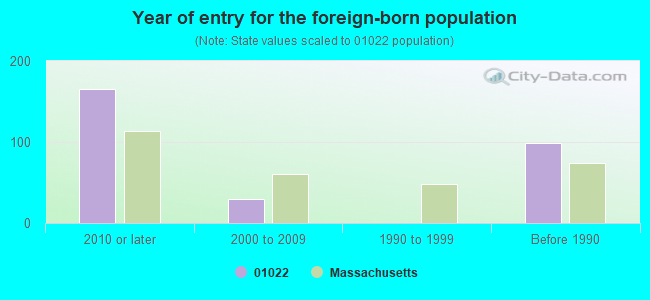
Foreign-born population percentage below state average.
Estimated median house/condo value in 2022: $160,554
01022:
$160,554
Massachusetts:
$534,700
According to our research of Massachusetts and other state lists, there were 2 registered sex offenders living in 01022 zip code as of June 05, 2024. The ratio of all residents to sex offenders in zip code 01022 is 1,282 to 1. The ratio of registered sex offenders to all residents in this zip code is near the state average.
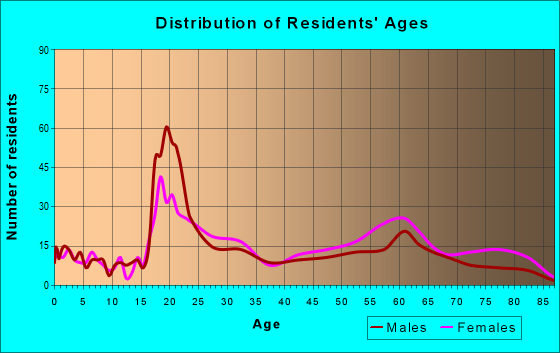
Median resident age:
This zip code:
39.8 years
Massachusetts median age:
40.3 years
Average household size:
This zip code:
1.6 people
Massachusetts:
2.4 people
Averages for the 2020 tax year for zip code 01022, filed in 2021:
Average Adjusted Gross Income (AGI) in 2020: $47,742 (Individual Income Tax Returns)
Here:
$47,742
State:
$105,130
Salary/wage: $43,140 (reported on 72.9% of returns)
Here:
$43,140
State:
$82,951
(% of AGI for various income ranges: 685.4% for AGIs below $25k, 3201.4% for AGIs $25k-50k, 5709.0% for AGIs $50k-75k, 7915.6% for AGIs $75k-100k, 19072.5% for AGIs $100k-200k)
Taxable interest for individuals: $460 (reported on 33.9% of returns)
This zip code:
$460
Massachusetts:
$2,361
(% of AGI for various income ranges: 22.9% for AGIs below $25k, 12.8% for AGIs $25k-50k, 24.5% for AGIs $50k-75k, 37.8% for AGIs $75k-100k, 22.5% for AGIs $100k-200k)
Ordinary dividends: $1,880 (reported on 16.9% of returns)
Here:
$1,880
State:
$10,365
(% of AGI for various income ranges: 22.9% for AGIs below $25k, 22.4% for AGIs $25k-50k, 46.0% for AGIs $50k-75k, 106.7% for AGIs $75k-100k, 170.0% for AGIs $100k-200k)
Net capital gain/loss in AGI: +$4,007 (reported on 12.7% of returns)
Here:
+$4,007
State:
+$48,178
(% of AGI for various income ranges: 22.1% for AGIs $25k-50k, 49.0% for AGIs $50k-75k, 1132.5% for AGIs $100k-200k)
Profit/loss from business: +$4,525 (reported on 6.8% of returns)
Here:
+$4,525
State:
+$20,792
(% of AGI for various income ranges: 65.0% for AGIs below $25k, 5.9% for AGIs $25k-50k, 94.5% for AGIs $50k-75k)
Taxable individual retirement arrangement distribution: $11,284 (reported on 16.1% of returns)
01022:
$11,284
Massachusetts:
$22,790
(% of AGI for various income ranges: 153.8% for AGIs below $25k, 174.5% for AGIs $25k-50k, 255.5% for AGIs $50k-75k, 842.2% for AGIs $75k-100k)
Total itemized deductions: $21,300 (reported on 3.4% of returns)
Here:
$21,300
State:
$36,722
(% of AGI for various income ranges: 171.2% for AGIs below $25k, 490.0% for AGIs $75k-100k)
Charity contributions: $1,600 (reported on 1.7% of returns)
Here:
$1,600
State:
$12,529
(% of AGI for various income ranges: 11.0% for AGIs $25k-50k)
Taxes paid: $6,250 (reported on 3.4% of returns)
01022:
$6,250
State:
$8,782
(% of AGI for various income ranges: 277.8% for AGIs $75k-100k)
Earned income credit: $1,158 (reported on 10.2% of returns)
Here:
$1,158
State:
$1,909
(% of AGI for various income ranges: 28.7% for AGIs below $25k, 24.1% for AGIs $25k-50k)
Percentage of individuals using paid preparers for their 2020 taxes: 90.7%
Here:
91%
State:
92%
(% for various income ranges: 82.9% for AGIs below $25k, 91.9% for AGIs $25k-50k, 92.3% for AGIs $50k-75k, 100.0% for AGIs $75k-100k, 100.0% for AGIs $100k-200k)
Averages for the 2012 tax year for zip code 01022, filed in 2013:
Average Adjusted Gross Income (AGI) in 2012: $45,668 (Individual Income Tax Returns)
Here:
$45,668
State:
$81,425
Salary/wage: $44,376 (reported on 76.5% of returns)
Here:
$44,376
State:
$64,752
(% of AGI for various income ranges: 53.1% for AGIs below $25k, 75.1% for AGIs $25k-50k, 76.6% for AGIs $50k-75k, 77.6% for AGIs $75k-100k, 77.4% for AGIs $100k-200k)
Taxable interest for individuals: $700 (reported on 44.3% of returns)
This zip code:
$700
Massachusetts:
$2,136
(% of AGI for various income ranges: 1.5% for AGIs below $25k, 0.7% for AGIs $25k-50k, 0.4% for AGIs $50k-75k, 1.3% for AGIs $75k-100k, 0.2% for AGIs $100k-200k)
Ordinary dividends: $1,470 (reported on 17.4% of returns)
Here:
$1,470
State:
$9,473
(% of AGI for various income ranges: 1.1% for AGIs below $25k, 0.6% for AGIs $25k-50k, 0.7% for AGIs $50k-75k, 0.5% for AGIs $75k-100k, 0.1% for AGIs $100k-200k)
Net capital gain/loss in AGI: +$925 (reported on 10.4% of returns)
Here:
+$925
State:
+$31,437
(% of AGI for various income ranges: 1.7% for AGIs $75k-100k)
Profit/loss from business: +$3,017 (reported on 5.2% of returns)
Here:
+$3,017
State:
+$20,662
Taxable individual retirement arrangement distribution: $8,989 (reported on 16.5% of returns)
01022:
$8,989
Massachusetts:
$18,892
(% of AGI for various income ranges: 10.1% for AGIs below $25k, 2.3% for AGIs $25k-50k, 3.1% for AGIs $50k-75k, 5.3% for AGIs $75k-100k)
Total itemized deductions: $13,302 (21% of AGI, reported on 34.8% of returns)
Here:
$13,302
State:
$28,907
Here:
21.5% of AGI
State:
18.2% of AGI
(% of AGI for various income ranges: 12.4% for AGIs below $25k, 8.8% for AGIs $25k-50k, 10.2% for AGIs $50k-75k, 11.8% for AGIs $75k-100k, 9.4% for AGIs $100k-200k)
Charity contributions: $1,294 (reported on 27.0% of returns)
Here:
$1,294
State:
$4,208
(% of AGI for various income ranges: 0.9% for AGIs below $25k, 0.7% for AGIs $25k-50k, 1.1% for AGIs $50k-75k, 0.4% for AGIs $75k-100k, 0.5% for AGIs $100k-200k)
Taxes paid: $4,980 (reported on 34.8% of returns)
01022:
$4,980
State:
$13,303
(% of AGI for various income ranges: 2.7% for AGIs below $25k, 3.0% for AGIs $25k-50k, 4.2% for AGIs $50k-75k, 4.1% for AGIs $75k-100k, 4.5% for AGIs $100k-200k)
Earned income credit: $1,540 (reported on 8.7% of returns)
Here:
$1,540
State:
$1,971
(% of AGI for various income ranges: 1.9% for AGIs below $25k, 0.4% for AGIs $25k-50k)
Percentage of individuals using paid preparers for their 2012 taxes: 51.3%
Here:
51%
State:
56%
(% for various income ranges: 47.2% for AGIs below $25k, 51.4% for AGIs $25k-50k, 56.0% for AGIs $50k-75k, 50.0% for AGIs $75k-100k, 57.1% for AGIs $100k-200k)
Averages for the 2004 tax year for zip code 01022, filed in 2005:
Average Adjusted Gross Income (AGI) in 2004: $38,295 (Individual Income Tax Returns)
Here:
$38,295
State:
$62,877
Salary/wage: $36,885 (reported on 81.8% of returns)
Here:
$36,885
State:
$52,969
(% of AGI for various income ranges: 69.1% for AGIs below $10k, 58.8% for AGIs $10k-25k, 82.7% for AGIs $25k-50k, 83.6% for AGIs $50k-75k, 83.5% for AGIs $75k-100k, 57.3% for AGIs over 100k)
Taxable interest for individuals: $675 (reported on 60.7% of returns)
This zip code:
$675
Massachusetts:
$1,945
(% of AGI for various income ranges: 3.9% for AGIs below $10k, 2.2% for AGIs $10k-25k, 1.0% for AGIs $25k-50k, 0.9% for AGIs $50k-75k, 0.6% for AGIs $75k-100k, 0.8% for AGIs over 100k)
Taxable dividends: $893 (reported on 22.4% of returns)
Here:
$893
State:
$5,323
(% of AGI for various income ranges: 2.0% for AGIs below $10k, 1.8% for AGIs $10k-25k, 0.4% for AGIs $25k-50k, 0.4% for AGIs $50k-75k, 0.3% for AGIs $75k-100k)
Net capital gain/loss: +$2,639 (reported on 13.5% of returns)
Here:
+$2,639
State:
+$20,377
(% of AGI for various income ranges: -3.9% for AGIs below $10k, -0.7% for AGIs $10k-25k, 0.2% for AGIs $25k-50k, -0.1% for AGIs $50k-75k, 0.1% for AGIs $75k-100k, 13.9% for AGIs over 100k)
Profit/loss from business: +$5,267 (reported on 6.9% of returns)
Here:
+$5,267
State:
+$17,837
IRA payment deduction: $2,147 (reported on 3.1% of returns)
01022:
$2,147
Massachusetts:
$3,100
Total itemized deductions: $11,056 (22% of AGI, reported on 43.9% of returns)
Here:
$11,056
State:
$22,573
Here:
22.4% of AGI
State:
19.5% of AGI
(% of AGI for various income ranges: 18.4% for AGIs below $10k, 11.6% for AGIs $10k-25k, 12.9% for AGIs $25k-50k, 12.3% for AGIs $50k-75k, 12.9% for AGIs $75k-100k, 13.1% for AGIs over 100k)
Charity contributions deductions: $1,435 (3% of AGI, reported on 38.6% of returns)
Here:
$1,435
State:
$3,295
Here:
2.9% of AGI
State:
2.7% of AGI
(% of AGI for various income ranges: 0.8% for AGIs below $10k, 1.3% for AGIs $10k-25k, 1.3% for AGIs $25k-50k, 1.4% for AGIs $50k-75k, 1.5% for AGIs $75k-100k, 2.1% for AGIs over 100k)
Total tax: $4,279 (reported on 84.9% of returns)
01022:
$4,279
State:
$11,494
(% of AGI for various income ranges: 0.9% for AGIs below $10k, 3.9% for AGIs $10k-25k, 8.3% for AGIs $25k-50k, 11.0% for AGIs $50k-75k, 12.0% for AGIs $75k-100k, 14.6% for AGIs over 100k)
Earned income credit: $1,183 (reported on 7.5% of returns)
Here:
$1,183
State:
$1,518
Percentage of individuals using paid preparers for their 2004 taxes: 55.6%
Here:
56%
State:
58%
(% for various income ranges: 49.2% for AGIs below $10k, 55.0% for AGIs $10k-25k, 56.6% for AGIs $25k-50k, 55.8% for AGIs $50k-75k, 59.4% for AGIs $75k-100k, 62.5% for AGIs over 100k)
Notable locations in zip code 01022: Westover Industrial Park West (A), Westover Arb Fire Department (B), Chicopee Fire Department Station 8 (C). Display/hide their locations on the map
In group quarters: 381 (-1 institutionalized population)
Size of family households: 230 2-persons, 142 3-persons, 9 4-persons, 9 6-persons
Size of nonfamily households: 633 1-person, 88 2-persons
50 married couples with children.
127 single-parent households (127 women).
88.6% of residents of 01022 zip code speak English at home.
4.4% of residents speak Spanish at home (78% very well, 22% well).
6.5% of residents speak other Indo-European language at home (71% very well, 29% well).
0.4% of residents speak Asian or Pacific Island language at home (100% not well).
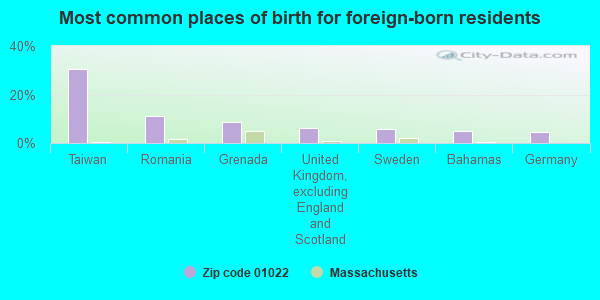
Foreign born population: 205 (9.6%) (37.3% of them are naturalized citizens)
This zip code:
9.6%
Whole state:
18.0%
31%Taiwan
11%Romania
9%Grenada
6%United Kingdom, excluding England and Scotland
6%Sweden
5%Bahamas
4%Germany
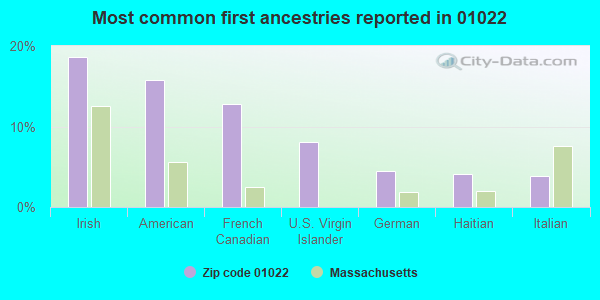
19%Irish
16%American
13%French Canadian
8%U.S. Virgin Islander
4%German
4%Haitian
4%Italian
Year of entry for the foreign-born population
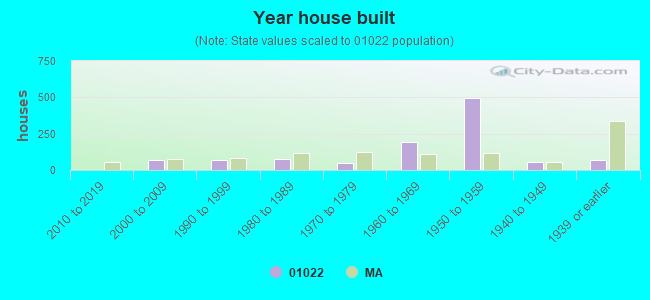
1662010 or later
302000 to 2009
01990 to 1999
99Before 1990
Facilities with environmental interests located in this zip code:
LEONI WIRE INC (301 GRIFFITH DRIVE in CHICOPEE, MA)
STATE MASTER (New Jersey environmental info) - NJEMS-NJX000312223, HAZARDOUS WASTE PROGRAM HAZARDOUS WASTE BIENNIAL REPORTER (Resource Conservation and Recovery Act (tracking hazardous waste)) Large Quantity Generators, more that 1000 kg of hazardous waste/month (Resource Conservation and Recovery Act (tracking hazardous waste)) - notification TRI REPORTER (Tracking of toxic chemicals releasing facilities) Business SIC classification: ROLLING, DRAWING, AND EXTRUDING OF COPPER Business NAICS classification: COPPER ROLLING, DRAWING, AND EXTRUDING.; ELECTROPLATING, PLATING, POLISHING, ANODIZING, AND COLORING. Organizations: LEONISCHE OF AMERICA, LEONI WIRE, INC (CONTACT/OPERATOR)
Alternative names: LEONISCHE OF AMERICA, LEONY WIRE INC
AVERY DENNISON CORP (ONE BETTER WAY in CHICOPEE, MA)
AIR MINOR (AIRS/AFS) CRITERIA AND HAZARDOUS AIR POLLUTANT INVENTORY (Inventory of air pollution sources) Small Quantity Generators, between 100 kg and 1000 kg of hazardous waste/month (Resource Conservation and Recovery Act (tracking hazardous waste)) - notification Business SIC classification: BLANKBOOKS, LOOSELEAF BINDERS AND DEVICES Business NAICS classification: BLANKBOOK, LOOSELEAF BINDERS, AND DEVICES MANUFACTURING. Organizations: AVERY DENNISON OFFICE PRODUCTS (CONTACT/OPERATOR)
, DENNISON STATIONERY PROD CO (CONTACT/OWNER)
Alternative names: AVERY DENNISON OFFICE PRODUCTS
LUDLOW SPECIALTY PAPERS (171 PADGETTE ST in CHICOPEE, MA)
MA NATIONAL GUARD (WESTOVER AFB BLDG 7450 in CHICOPEE, MA)
(Resource Conservation and Recovery Act (tracking hazardous waste)) Organizations: MASSACHUSETTS AIR NATIONAL GUARD (CONTACT/OWNER)
Alternative names: ARMY AVIATION FLIGHT ACTIVITY, MA AIR NATIONAL GUARD
PARISI INC (1380 SHERIDAN ST in CHICOPEE, MA)
Small Quantity Generators, between 100 kg and 1000 kg of hazardous waste/month (Resource Conservation and Recovery Act (tracking hazardous waste)) Business NAICS classification: SHOWCASE, PARTITION, SHELVING, AND LOCKER MANUFACTURING.
MILLS AVIATION INC (WESTOVER METRO ARPT HANGAR 12 in CHICOPEE, MA)
Small Quantity Generators, between 100 kg and 1000 kg of hazardous waste/month (Resource Conservation and Recovery Act (tracking hazardous waste)) - notification Organizations: JOHN MILLS (CONTACT/OWNER)
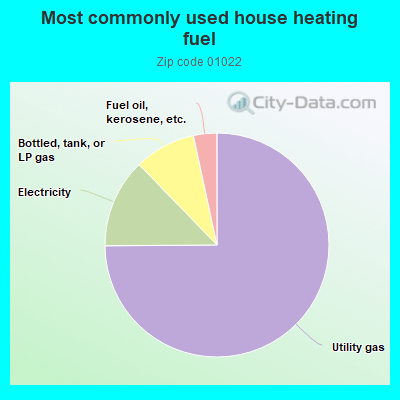
75.2%Utility gas
12.9%Electricity
8.9%Bottled, tank, or LP gas
3.4%Fuel oil, kerosene, etc.
Population in 1990: 1,764. Population change in the 1990s: +567 (+32.1%).
Place of birth for U.S.-born residents:
This state: 1,011
Northeast: 363
Midwest: 85
South: 402
West: 19
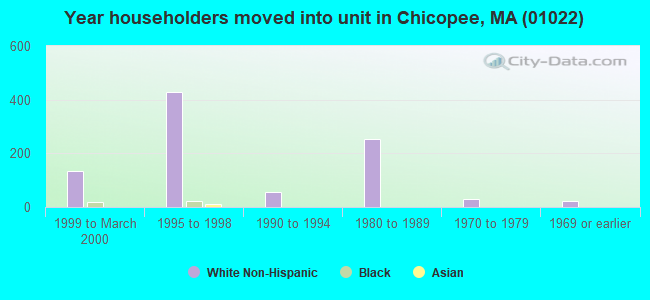
44% of the 01022 zip code residents lived in the same house 5 years ago. Out of people who lived in different houses, 58% lived in this county. Out of people who lived in different counties, 50% lived in Massachusetts.
73% of the 01022 zip code residents lived in the same house 1 year ago. Out of people who lived in different houses, 31% moved from this county. Out of people who lived in different houses, 11% moved from different county within same state. Out of people who lived in different houses, 28% moved from different state. Out of people who lived in different houses, 35% moved from abroad.
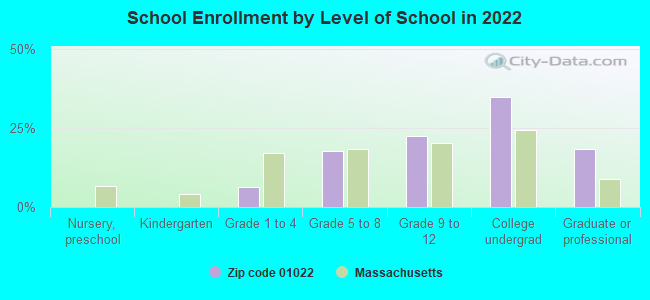
Private vs. public school enrollment:
Students in private schools in grades 1 to 8 (elementary and middle school): 132
Here:
81.5%
Massachusetts:
10.3%
Students in private schools in grades 9 to 12 (high school): 71
Here:
50.4%
Massachusetts:
12.3%
Students in private undergraduate colleges: 79
Here:
36.9%
Massachusetts:
51.2%
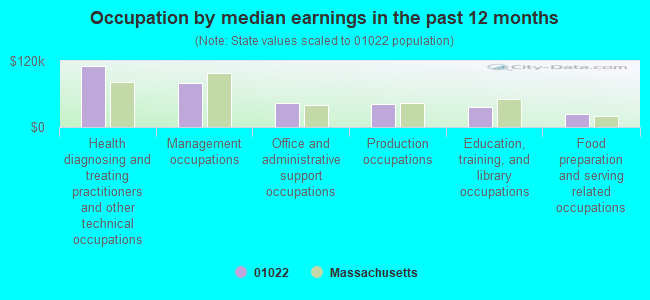
Occupation by median earnings in the past 12 months ($)
110,029Health diagnosing and treating practitioners and other technical occupations
79,747Management occupations
42,851Office and administrative support occupations
42,143Production occupations
36,084Education, training, and library occupations
23,190Food preparation and serving related occupations
Companies with federal contracts located in this zip code (CHICOPEE, MA):
IRON DUCK A DIVISION OF FLEMIN (20 VETERANS DRIVE; small business) : $1,151,238 in 19 contractsfrom 1999 to 2005
Contracts for Surgical Dressing Materials, Medical and Surgical Instruments, Equipment, and Supplies, Contract, Procurement, and Acquisition Support Services, Fire Fighting Equipment, and moreby Navy, Department of Veterans Affairs, Air Force, Defense Logistics Agency, and others Signed by year:2000: $0; 2001: $57,645; 2002: $204,682; 2003: $213,024; 2004: $564,211; 2005: $14,676; 2006: $0.
Biggest contracts:
$160,251 with Navy for Surgical Dressing Materials. Signed on 2002-11-21. Completion date: 2002-12-24.
$151,960 with Department of Veterans Affairs for Medical and Surgical Instruments, Equipment, and Supplies. Signed on 2004-08-04. Completion date: 2004-10-31.
$131,822 with Department of Veterans Affairs for Contract, Procurement, and Acquisition Support Services. Taking place in TX. Signed on 2004-05-12. Completion date: 2004-07-08.
$115,995 with Department of Veterans Affairs for Fire Fighting Equipment. Signed on 2003-03-15. Completion date: 2003-05-15.
SIEMENS DEMAG DELAVAL TURBOMAC (2140 WESTOVER RD) : $241,524 in 3 contractsfrom 2000 to 2003
$96,000 with Tennessee Valley Authority for Steam Turbines and Components. Signed on 2000-02-15. Completion date: 2000-04-15.
$89,746 with Navy for Construction of Structures and Facilities -- Ship Construction and Repair Facilities. Taking place in NJ. Signed on 2003-02-06. Completion date: 2003-02-22.
$55,778, same as above.Signed on 2003-02-02. Completion date: 2003-02-22.
NAFFM OFFICE FUND (650 AIRLIFT DRIVE; small business) : $20,887 in 2 contractsfrom 2004 to 2006
$10,836 with Army for Lodging - Hotel/Motel. Signed on 2006-04-06. Completion date: 2006-07-09.
$10,051, same as above.Signed on 2004-08-11. Completion date: 2004-09-30.
AMERICAN TOOL SUPPLY (904 SHERIDAN STREET)
$3,364 with Air Force for Cutting Tools for Machine Tools. Signed on 2006-01-23. Completion date: 2006-03-23.
Top industries in this zip code by the number of employees in 2005:
Health Care and Social Assistance: Vocational Rehabilitation Services (100-249 employees: 2 establishments)
Administrative and Support and Waste Management and Remediation Services: Temporary Help Services (50-99: 1, 20-49: 1)
People in group quarters in 2010:
470 people in workers' group living quarters and job corps centers
People in group quarters in 2000:
411 people in job corps and vocational training facilities
6 people in homes for the mentally retarded
Home Mortgage Disclosure Act Aggregated Statistics For Year 2009 (Based on 4 partial tracts)
A) FHA, FSA/RHS & VA Home Purchase Loans
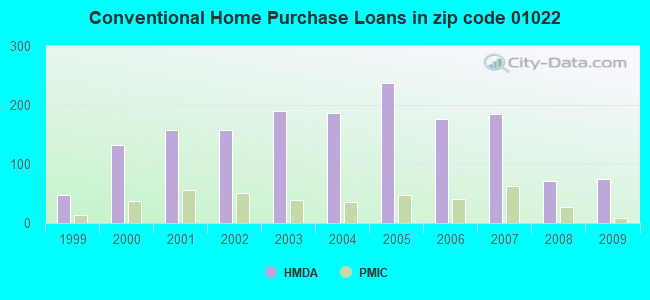
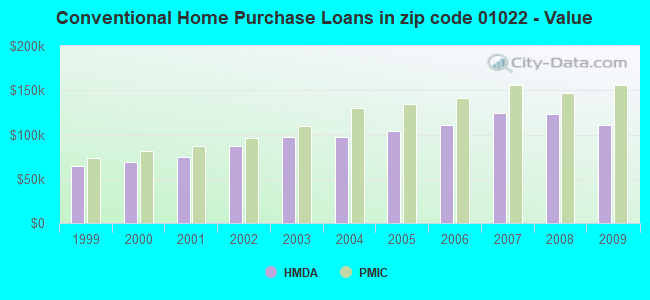
B) Conventional Home Purchase Loans
C) Refinancings
D) Home Improvement Loans
F) Non-occupant Loans on < 5 Family Dwellings (A B C & D)
G) Loans On Manufactured Home Dwelling (A B C & D)
Number
Average Value
Number
Average Value
Number
Average Value
Number
Average Value
Number
Average Value
Number
Average Value
LOANS ORIGINATED
53
$144,378
74
$111,168
203
$132,619
25
$49,260
7
$68,387
7
$30,760
APPLICATIONS APPROVED, NOT ACCEPTED
2
$103,805
3
$91,727
16
$134,768
0
$0
0
$0
1
$99,700
APPLICATIONS DENIED
12
$162,163
16
$72,365
66
$146,977
19
$59,734
4
$40,660
1
$77,290
APPLICATIONS WITHDRAWN
7
$134,320
8
$116,504
58
$124,307
5
$124,168
2
$80,215
0
$0
FILES CLOSED FOR INCOMPLETENESS
0
$0
0
$0
14
$123,693
3
$27,263
0
$0
0
$0
Aggregated Statistics For Year 2008 (Based on 4 partial tracts)
A) FHA, FSA/RHS & VA Home Purchase Loans
B) Conventional Home Purchase Loans
C) Refinancings
D) Home Improvement Loans
F) Non-occupant Loans on < 5 Family Dwellings (A B C & D)
G) Loans On Manufactured Home Dwelling (A B C & D)
Number
Average Value
Number
Average Value
Number
Average Value
Number
Average Value
Number
Average Value
Number
Average Value
LOANS ORIGINATED
46
$148,298
72
$122,665
110
$132,478
26
$68,910
17
$133,328
6
$56,135
APPLICATIONS APPROVED, NOT ACCEPTED
0
$0
8
$126,474
21
$120,720
7
$26,216
2
$68,415
3
$76,547
APPLICATIONS DENIED
3
$179,410
12
$97,412
87
$137,142
35
$18,493
5
$147,500
0
$0
APPLICATIONS WITHDRAWN
5
$135,260
11
$87,588
38
$157,922
2
$16,290
0
$0
0
$0
FILES CLOSED FOR INCOMPLETENESS
0
$0
0
$0
9
$219,248
2
$75,895
0
$0
0
$0
Aggregated Statistics For Year 2007 (Based on 4 partial tracts)
A) FHA, FSA/RHS & VA Home Purchase Loans
B) Conventional Home Purchase Loans
C) Refinancings
D) Home Improvement Loans
E) Loans on Dwellings For 5+ Families
F) Non-occupant Loans on < 5 Family Dwellings (A B C & D)
G) Loans On Manufactured Home Dwelling (A B C & D)
Number
Average Value
Number
Average Value
Number
Average Value
Number
Average Value
Number
Average Value
Number
Average Value
Number
Average Value
LOANS ORIGINATED
8
$166,988
185
$124,036
175
$119,055
62
$47,011
0
$0
9
$123,533
5
$57,578
APPLICATIONS APPROVED, NOT ACCEPTED
3
$190,310
14
$125,259
36
$142,392
4
$83,472
2
$157,280
2
$90,435
2
$58,435
APPLICATIONS DENIED
0
$0
24
$164,173
119
$140,965
35
$47,897
0
$0
4
$138,995
2
$3,930
APPLICATIONS WITHDRAWN
0
$0
18
$114,772
66
$157,653
4
$20,762
2
$157,280
2
$116,975
0
$0
FILES CLOSED FOR INCOMPLETENESS
0
$0
5
$133,566
14
$157,739
0
$0
2
$1,218,920
0
$0
2
$74,505
Aggregated Statistics For Year 2006 (Based on 4 partial tracts)
A) FHA, FSA/RHS & VA Home Purchase Loans
B) Conventional Home Purchase Loans
C) Refinancings
D) Home Improvement Loans
E) Loans on Dwellings For 5+ Families
F) Non-occupant Loans on < 5 Family Dwellings (A B C & D)
G) Loans On Manufactured Home Dwelling (A B C & D)
Number
Average Value
Number
Average Value
Number
Average Value
Number
Average Value
Number
Average Value
Number
Average Value
Number
Average Value
LOANS ORIGINATED
13
$169,994
177
$110,305
229
$113,542
58
$47,309
2
$275,240
18
$111,988
7
$76,009
APPLICATIONS APPROVED, NOT ACCEPTED
0
$0
12
$106,433
31
$85,101
5
$20,618
0
$0
1
$67,210
1
$16,800
APPLICATIONS DENIED
2
$112,455
24
$79,686
181
$126,246
33
$47,810
0
$0
7
$89,601
2
$56,195
APPLICATIONS WITHDRAWN
0
$0
10
$133,851
144
$131,942
9
$103,999
0
$0
3
$160,950
0
$0
FILES CLOSED FOR INCOMPLETENESS
0
$0
5
$79,314
30
$133,205
2
$78,640
0
$0
0
$0
1
$25,390
Aggregated Statistics For Year 2005 (Based on 4 partial tracts)
A) FHA, FSA/RHS & VA Home Purchase Loans
B) Conventional Home Purchase Loans
C) Refinancings
D) Home Improvement Loans
E) Loans on Dwellings For 5+ Families
F) Non-occupant Loans on < 5 Family Dwellings (A B C & D)
G) Loans On Manufactured Home Dwelling (A B C & D)
Number
Average Value
Number
Average Value
Number
Average Value
Number
Average Value
Number
Average Value
Number
Average Value
Number
Average Value
LOANS ORIGINATED
15
$144,226
238
$103,470
288
$110,310
63
$39,617
1
$1,061,950
12
$56,673
11
$63,646
APPLICATIONS APPROVED, NOT ACCEPTED
0
$0
4
$118,742
34
$114,938
7
$27,493
0
$0
2
$97,700
0
$0
APPLICATIONS DENIED
2
$82,730
27
$95,938
129
$116,063
45
$38,249
0
$0
7
$58,933
3
$32,860
APPLICATIONS WITHDRAWN
0
$0
37
$106,575
138
$134,182
3
$144,310
0
$0
11
$142,679
1
$35,850
FILES CLOSED FOR INCOMPLETENESS
0
$0
11
$143,418
33
$116,950
0
$0
0
$0
2
$116,770
0
$0
Aggregated Statistics For Year 2004 (Based on 4 partial tracts)
A) FHA, FSA/RHS & VA Home Purchase Loans
B) Conventional Home Purchase Loans
C) Refinancings
D) Home Improvement Loans
F) Non-occupant Loans on < 5 Family Dwellings (A B C & D)
G) Loans On Manufactured Home Dwelling (A B C & D)
Number
Average Value
Number
Average Value
Number
Average Value
Number
Average Value
Number
Average Value
Number
Average Value
LOANS ORIGINATED
23
$129,717
187
$96,873
284
$98,092
54
$53,327
19
$72,352
7
$46,621
APPLICATIONS APPROVED, NOT ACCEPTED
2
$69,205
24
$76,662
47
$92,355
15
$39,608
3
$63,960
5
$49,288
APPLICATIONS DENIED
2
$107,965
15
$93,415
131
$109,443
43
$29,770
3
$1,147
2
$38,835
APPLICATIONS WITHDRAWN
3
$111,670
7
$63,636
157
$105,089
6
$29,937
1
$133,680
0
$0
FILES CLOSED FOR INCOMPLETENESS
0
$0
6
$93,092
21
$127,917
2
$80,615
0
$0
1
$16,800
Aggregated Statistics For Year 2003 (Based on 4 partial tracts)
A) FHA, FSA/RHS & VA Home Purchase Loans
B) Conventional Home Purchase Loans
C) Refinancings
D) Home Improvement Loans
E) Loans on Dwellings For 5+ Families
F) Non-occupant Loans on < 5 Family Dwellings (A B C & D)
Number
Average Value
Number
Average Value
Number
Average Value
Number
Average Value
Number
Average Value
Number
Average Value
LOANS ORIGINATED
31
$117,574
190
$97,051
556
$85,283
31
$36,817
2
$589,800
19
$64,166
APPLICATIONS APPROVED, NOT ACCEPTED
0
$0
10
$78,665
73
$83,802
4
$51,630
0
$0
2
$62,125
APPLICATIONS DENIED
0
$0
22
$76,080
129
$90,777
33
$28,884
0
$0
2
$82,005
APPLICATIONS WITHDRAWN
2
$148,830
9
$67,093
93
$95,880
5
$17,300
0
$0
2
$106,760
FILES CLOSED FOR INCOMPLETENESS
0
$0
0
$0
1
$84,390
2
$15,730
0
$0
0
$0
Aggregated Statistics For Year 2002 (Based on 4 partial tracts)
A) FHA, FSA/RHS & VA Home Purchase Loans
B) Conventional Home Purchase Loans
C) Refinancings
D) Home Improvement Loans
F) Non-occupant Loans on < 5 Family Dwellings (A B C & D)
Number
Average Value
Number
Average Value
Number
Average Value
Number
Average Value
Number
Average Value
LOANS ORIGINATED
45
$108,798
158
$87,557
334
$82,534
20
$24,702
18
$61,828
APPLICATIONS APPROVED, NOT ACCEPTED
4
$67,362
8
$88,490
21
$81,597
4
$20,592
0
$0
APPLICATIONS DENIED
1
$163,920
19
$76,033
74
$92,933
20
$24,442
3
$51,657
APPLICATIONS WITHDRAWN
0
$0
17
$101,389
44
$91,555
3
$15,727
3
$110,097
FILES CLOSED FOR INCOMPLETENESS
0
$0
2
$115,625
13
$59,162
0
$0
0
$0
Aggregated Statistics For Year 2001 (Based on 4 partial tracts)
A) FHA, FSA/RHS & VA Home Purchase Loans
B) Conventional Home Purchase Loans
C) Refinancings
D) Home Improvement Loans
E) Loans on Dwellings For 5+ Families
F) Non-occupant Loans on < 5 Family Dwellings (A B C & D)
Number
Average Value
Number
Average Value
Number
Average Value
Number
Average Value
Number
Average Value
Number
Average Value
LOANS ORIGINATED
57
$95,655
157
$74,740
197
$78,794
19
$19,198
2
$39,320
7
$58,054
APPLICATIONS APPROVED, NOT ACCEPTED
4
$80,948
10
$64,096
26
$70,593
5
$15,452
0
$0
0
$0
APPLICATIONS DENIED
4
$107,392
11
$76,908
96
$79,894
9
$18,552
0
$0
4
$69,062
APPLICATIONS WITHDRAWN
4
$54,298
10
$72,708
56
$89,008
3
$23,713
0
$0
2
$56,620
FILES CLOSED FOR INCOMPLETENESS
3
$123,727
0
$0
10
$106,415
1
$14,560
0
$0
0
$0
Aggregated Statistics For Year 2000 (Based on 4 partial tracts)
A) FHA, FSA/RHS & VA Home Purchase Loans
B) Conventional Home Purchase Loans
C) Refinancings
D) Home Improvement Loans
F) Non-occupant Loans on < 5 Family Dwellings (A B C & D)
Number
Average Value
Number
Average Value
Number
Average Value
Number
Average Value
Number
Average Value
LOANS ORIGINATED
39
$88,604
133
$68,483
56
$63,508
37
$15,528
8
$84,935
APPLICATIONS APPROVED, NOT ACCEPTED
3
$76,543
7
$77,009
9
$73,681
5
$15,102
0
$0
APPLICATIONS DENIED
0
$0
20
$61,777
75
$64,529
25
$31,578
2
$58,375
APPLICATIONS WITHDRAWN
7
$90,336
14
$69,620
46
$64,533
2
$28,995
0
$0
FILES CLOSED FOR INCOMPLETENESS
0
$0
0
$0
12
$72,318
0
$0
0
$0
Aggregated Statistics For Year 1999 (Based on 1 full and 2 partial tracts)
A) FHA, FSA/RHS & VA Home Purchase Loans
B) Conventional Home Purchase Loans
C) Refinancings
D) Home Improvement Loans
F) Non-occupant Loans on < 5 Family Dwellings (A B C & D)


 Nearest zip codes: 01020, 01151, 01033, 01104, 01075, 01013.