Xenia, Ohio Submit your own pictures of this city and show them to the world
OSM Map
General Map
Google Map
MSN Map
OSM Map
General Map
Google Map
MSN Map
OSM Map
General Map
Google Map
MSN Map
OSM Map
General Map
Google Map
MSN Map
Please wait while loading the map...
Population in 2022: 25,612 (97% urban, 3% rural). Population change since 2000: +6.0%Males: 12,278 Females: 13,334
March 2022 cost of living index in Xenia: 93.9 (less than average, U.S. average is 100) Percentage of residents living in poverty in 2022: 17.4%for White Non-Hispanic residents , 25.8% for Black residents , 22.7% for Hispanic or Latino residents , 14.7% for American Indian residents , 56.7% for other race residents , 22.6% for two or more races residents )
Profiles of local businesses
Business Search - 14 Million verified businesses
Data:
Median household income ($)
Median household income (% change since 2000)
Household income diversity
Ratio of average income to average house value (%)
Ratio of average income to average rent
Median household income ($) - White
Median household income ($) - Black or African American
Median household income ($) - Asian
Median household income ($) - Hispanic or Latino
Median household income ($) - American Indian and Alaska Native
Median household income ($) - Multirace
Median household income ($) - Other Race
Median household income for houses/condos with a mortgage ($)
Median household income for apartments without a mortgage ($)
Races - White alone (%)
Races - White alone (% change since 2000)
Races - Black alone (%)
Races - Black alone (% change since 2000)
Races - American Indian alone (%)
Races - American Indian alone (% change since 2000)
Races - Asian alone (%)
Races - Asian alone (% change since 2000)
Races - Hispanic (%)
Races - Hispanic (% change since 2000)
Races - Native Hawaiian and Other Pacific Islander alone (%)
Races - Native Hawaiian and Other Pacific Islander alone (% change since 2000)
Races - Two or more races (%)
Races - Two or more races (% change since 2000)
Races - Other race alone (%)
Races - Other race alone (% change since 2000)
Racial diversity
Unemployment (%)
Unemployment (% change since 2000)
Unemployment (%) - White
Unemployment (%) - Black or African American
Unemployment (%) - Asian
Unemployment (%) - Hispanic or Latino
Unemployment (%) - American Indian and Alaska Native
Unemployment (%) - Multirace
Unemployment (%) - Other Race
Population density (people per square mile)
Population - Males (%)
Population - Females (%)
Population - Males (%) - White
Population - Males (%) - Black or African American
Population - Males (%) - Asian
Population - Males (%) - Hispanic or Latino
Population - Males (%) - American Indian and Alaska Native
Population - Males (%) - Multirace
Population - Males (%) - Other Race
Population - Females (%) - White
Population - Females (%) - Black or African American
Population - Females (%) - Asian
Population - Females (%) - Hispanic or Latino
Population - Females (%) - American Indian and Alaska Native
Population - Females (%) - Multirace
Population - Females (%) - Other Race
Coronavirus confirmed cases (Jun 05, 2024)
Deaths caused by coronavirus (Jun 05, 2024)
Coronavirus confirmed cases (per 100k population) (Jun 05, 2024)
Deaths caused by coronavirus (per 100k population) (Jun 05, 2024)
Daily increase in number of cases (Jun 05, 2024)
Weekly increase in number of cases (Jun 05, 2024)
Cases doubled (in days) (Jun 05, 2024)
Hospitalized patients (Apr 18, 2022)
Negative test results (Apr 18, 2022)
Total test results (Apr 18, 2022)
COVID Vaccine doses distributed (per 100k population) (Sep 19, 2023)
COVID Vaccine doses administered (per 100k population) (Sep 19, 2023)
COVID Vaccine doses distributed (Sep 19, 2023)
COVID Vaccine doses administered (Sep 19, 2023)
Likely homosexual households (%)
Likely homosexual households (% change since 2000)
Likely homosexual households - Lesbian couples (%)
Likely homosexual households - Lesbian couples (% change since 2000)
Likely homosexual households - Gay men (%)
Likely homosexual households - Gay men (% change since 2000)
Cost of living index
Median gross rent ($)
Median contract rent ($)
Median monthly housing costs ($)
Median house or condo value ($)
Median house or condo value ($ change since 2000)
Mean house or condo value by units in structure - 1, detached ($)
Mean house or condo value by units in structure - 1, attached ($)
Mean house or condo value by units in structure - 2 ($)
Mean house or condo value by units in structure by units in structure - 3 or 4 ($)
Mean house or condo value by units in structure - 5 or more ($)
Mean house or condo value by units in structure - Boat, RV, van, etc. ($)
Mean house or condo value by units in structure - Mobile home ($)
Median house or condo value ($) - White
Median house or condo value ($) - Black or African American
Median house or condo value ($) - Asian
Median house or condo value ($) - Hispanic or Latino
Median house or condo value ($) - American Indian and Alaska Native
Median house or condo value ($) - Multirace
Median house or condo value ($) - Other Race
Median resident age
Resident age diversity
Median resident age - Males
Median resident age - Females
Median resident age - White
Median resident age - Black or African American
Median resident age - Asian
Median resident age - Hispanic or Latino
Median resident age - American Indian and Alaska Native
Median resident age - Multirace
Median resident age - Other Race
Median resident age - Males - White
Median resident age - Males - Black or African American
Median resident age - Males - Asian
Median resident age - Males - Hispanic or Latino
Median resident age - Males - American Indian and Alaska Native
Median resident age - Males - Multirace
Median resident age - Males - Other Race
Median resident age - Females - White
Median resident age - Females - Black or African American
Median resident age - Females - Asian
Median resident age - Females - Hispanic or Latino
Median resident age - Females - American Indian and Alaska Native
Median resident age - Females - Multirace
Median resident age - Females - Other Race
Commute - mean travel time to work (minutes)
Travel time to work - Less than 5 minutes (%)
Travel time to work - Less than 5 minutes (% change since 2000)
Travel time to work - 5 to 9 minutes (%)
Travel time to work - 5 to 9 minutes (% change since 2000)
Travel time to work - 10 to 19 minutes (%)
Travel time to work - 10 to 19 minutes (% change since 2000)
Travel time to work - 20 to 29 minutes (%)
Travel time to work - 20 to 29 minutes (% change since 2000)
Travel time to work - 30 to 39 minutes (%)
Travel time to work - 30 to 39 minutes (% change since 2000)
Travel time to work - 40 to 59 minutes (%)
Travel time to work - 40 to 59 minutes (% change since 2000)
Travel time to work - 60 to 89 minutes (%)
Travel time to work - 60 to 89 minutes (% change since 2000)
Travel time to work - 90 or more minutes (%)
Travel time to work - 90 or more minutes (% change since 2000)
Marital status - Never married (%)
Marital status - Now married (%)
Marital status - Separated (%)
Marital status - Widowed (%)
Marital status - Divorced (%)
Median family income ($)
Median family income (% change since 2000)
Median non-family income ($)
Median non-family income (% change since 2000)
Median per capita income ($)
Median per capita income (% change since 2000)
Median family income ($) - White
Median family income ($) - Black or African American
Median family income ($) - Asian
Median family income ($) - Hispanic or Latino
Median family income ($) - American Indian and Alaska Native
Median family income ($) - Multirace
Median family income ($) - Other Race
Median year house/condo built
Median year apartment built
Year house built - Built 2005 or later (%)
Year house built - Built 2000 to 2004 (%)
Year house built - Built 1990 to 1999 (%)
Year house built - Built 1980 to 1989 (%)
Year house built - Built 1970 to 1979 (%)
Year house built - Built 1960 to 1969 (%)
Year house built - Built 1950 to 1959 (%)
Year house built - Built 1940 to 1949 (%)
Year house built - Built 1939 or earlier (%)
Average household size
Household density (households per square mile)
Average household size - White
Average household size - Black or African American
Average household size - Asian
Average household size - Hispanic or Latino
Average household size - American Indian and Alaska Native
Average household size - Multirace
Average household size - Other Race
Occupied housing units (%)
Vacant housing units (%)
Owner occupied housing units (%)
Renter occupied housing units (%)
Vacancy status - For rent (%)
Vacancy status - For sale only (%)
Vacancy status - Rented or sold, not occupied (%)
Vacancy status - For seasonal, recreational, or occasional use (%)
Vacancy status - For migrant workers (%)
Vacancy status - Other vacant (%)
Residents with income below the poverty level (%)
Residents with income below 50% of the poverty level (%)
Children below poverty level (%)
Poor families by family type - Married-couple family (%)
Poor families by family type - Male, no wife present (%)
Poor families by family type - Female, no husband present (%)
Poverty status for native-born residents (%)
Poverty status for foreign-born residents (%)
Poverty among high school graduates not in families (%)
Poverty among people who did not graduate high school not in families (%)
Residents with income below the poverty level (%) - White
Residents with income below the poverty level (%) - Black or African American
Residents with income below the poverty level (%) - Asian
Residents with income below the poverty level (%) - Hispanic or Latino
Residents with income below the poverty level (%) - American Indian and Alaska Native
Residents with income below the poverty level (%) - Multirace
Residents with income below the poverty level (%) - Other Race
Air pollution - Air Quality Index (AQI)
Air pollution - CO
Air pollution - NO2
Air pollution - SO2
Air pollution - Ozone
Air pollution - PM10
Air pollution - PM25
Air pollution - Pb
Crime - Murders per 100,000 population
Crime - Rapes per 100,000 population
Crime - Robberies per 100,000 population
Crime - Assaults per 100,000 population
Crime - Burglaries per 100,000 population
Crime - Thefts per 100,000 population
Crime - Auto thefts per 100,000 population
Crime - Arson per 100,000 population
Crime - City-data.com crime index
Crime - Violent crime index
Crime - Property crime index
Crime - Murders per 100,000 population (5 year average)
Crime - Rapes per 100,000 population (5 year average)
Crime - Robberies per 100,000 population (5 year average)
Crime - Assaults per 100,000 population (5 year average)
Crime - Burglaries per 100,000 population (5 year average)
Crime - Thefts per 100,000 population (5 year average)
Crime - Auto thefts per 100,000 population (5 year average)
Crime - Arson per 100,000 population (5 year average)
Crime - City-data.com crime index (5 year average)
Crime - Violent crime index (5 year average)
Crime - Property crime index (5 year average)
1996 Presidential Elections Results (%) - Democratic Party (Clinton)
1996 Presidential Elections Results (%) - Republican Party (Dole)
1996 Presidential Elections Results (%) - Other
2000 Presidential Elections Results (%) - Democratic Party (Gore)
2000 Presidential Elections Results (%) - Republican Party (Bush)
2000 Presidential Elections Results (%) - Other
2004 Presidential Elections Results (%) - Democratic Party (Kerry)
2004 Presidential Elections Results (%) - Republican Party (Bush)
2004 Presidential Elections Results (%) - Other
2008 Presidential Elections Results (%) - Democratic Party (Obama)
2008 Presidential Elections Results (%) - Republican Party (McCain)
2008 Presidential Elections Results (%) - Other
2012 Presidential Elections Results (%) - Democratic Party (Obama)
2012 Presidential Elections Results (%) - Republican Party (Romney)
2012 Presidential Elections Results (%) - Other
2016 Presidential Elections Results (%) - Democratic Party (Clinton)
2016 Presidential Elections Results (%) - Republican Party (Trump)
2016 Presidential Elections Results (%) - Other
2020 Presidential Elections Results (%) - Democratic Party (Biden)
2020 Presidential Elections Results (%) - Republican Party (Trump)
2020 Presidential Elections Results (%) - Other
Ancestries Reported - Arab (%)
Ancestries Reported - Czech (%)
Ancestries Reported - Danish (%)
Ancestries Reported - Dutch (%)
Ancestries Reported - English (%)
Ancestries Reported - French (%)
Ancestries Reported - French Canadian (%)
Ancestries Reported - German (%)
Ancestries Reported - Greek (%)
Ancestries Reported - Hungarian (%)
Ancestries Reported - Irish (%)
Ancestries Reported - Italian (%)
Ancestries Reported - Lithuanian (%)
Ancestries Reported - Norwegian (%)
Ancestries Reported - Polish (%)
Ancestries Reported - Portuguese (%)
Ancestries Reported - Russian (%)
Ancestries Reported - Scotch-Irish (%)
Ancestries Reported - Scottish (%)
Ancestries Reported - Slovak (%)
Ancestries Reported - Subsaharan African (%)
Ancestries Reported - Swedish (%)
Ancestries Reported - Swiss (%)
Ancestries Reported - Ukrainian (%)
Ancestries Reported - United States (%)
Ancestries Reported - Welsh (%)
Ancestries Reported - West Indian (%)
Ancestries Reported - Other (%)
Educational Attainment - No schooling completed (%)
Educational Attainment - Less than high school (%)
Educational Attainment - High school or equivalent (%)
Educational Attainment - Less than 1 year of college (%)
Educational Attainment - 1 or more years of college (%)
Educational Attainment - Associate degree (%)
Educational Attainment - Bachelor's degree (%)
Educational Attainment - Master's degree (%)
Educational Attainment - Professional school degree (%)
Educational Attainment - Doctorate degree (%)
School Enrollment - Nursery, preschool (%)
School Enrollment - Kindergarten (%)
School Enrollment - Grade 1 to 4 (%)
School Enrollment - Grade 5 to 8 (%)
School Enrollment - Grade 9 to 12 (%)
School Enrollment - College undergrad (%)
School Enrollment - Graduate or professional (%)
School Enrollment - Not enrolled in school (%)
School enrollment - Public schools (%)
School enrollment - Private schools (%)
School enrollment - Not enrolled (%)
Median number of rooms in houses and condos
Median number of rooms in apartments
Housing units lacking complete plumbing facilities (%)
Housing units lacking complete kitchen facilities (%)
Density of houses
Urban houses (%)
Rural houses (%)
Households with people 60 years and over (%)
Households with people 65 years and over (%)
Households with people 75 years and over (%)
Households with one or more nonrelatives (%)
Households with no nonrelatives (%)
Population in households (%)
Family households (%)
Nonfamily households (%)
Population in families (%)
Family households with own children (%)
Median number of bedrooms in owner occupied houses
Mean number of bedrooms in owner occupied houses
Median number of bedrooms in renter occupied houses
Mean number of bedrooms in renter occupied houses
Median number of vehichles in owner occupied houses
Mean number of vehichles in owner occupied houses
Median number of vehichles in renter occupied houses
Mean number of vehichles in renter occupied houses
Mortgage status - with mortgage (%)
Mortgage status - with second mortgage (%)
Mortgage status - with home equity loan (%)
Mortgage status - with both second mortgage and home equity loan (%)
Mortgage status - without a mortgage (%)
Average family size
Average family size - White
Average family size - Black or African American
Average family size - Asian
Average family size - Hispanic or Latino
Average family size - American Indian and Alaska Native
Average family size - Multirace
Average family size - Other Race
Geographical mobility - Same house 1 year ago (%)
Geographical mobility - Moved within same county (%)
Geographical mobility - Moved from different county within same state (%)
Geographical mobility - Moved from different state (%)
Geographical mobility - Moved from abroad (%)
Place of birth - Born in state of residence (%)
Place of birth - Born in other state (%)
Place of birth - Native, outside of US (%)
Place of birth - Foreign born (%)
Housing units in structures - 1, detached (%)
Housing units in structures - 1, attached (%)
Housing units in structures - 2 (%)
Housing units in structures - 3 or 4 (%)
Housing units in structures - 5 to 9 (%)
Housing units in structures - 10 to 19 (%)
Housing units in structures - 20 to 49 (%)
Housing units in structures - 50 or more (%)
Housing units in structures - Mobile home (%)
Housing units in structures - Boat, RV, van, etc. (%)
House/condo owner moved in on average (years ago)
Renter moved in on average (years ago)
Year householder moved into unit - Moved in 1999 to March 2000 (%)
Year householder moved into unit - Moved in 1995 to 1998 (%)
Year householder moved into unit - Moved in 1990 to 1994 (%)
Year householder moved into unit - Moved in 1980 to 1989 (%)
Year householder moved into unit - Moved in 1970 to 1979 (%)
Year householder moved into unit - Moved in 1969 or earlier (%)
Means of transportation to work - Drove car alone (%)
Means of transportation to work - Carpooled (%)
Means of transportation to work - Public transportation (%)
Means of transportation to work - Bus or trolley bus (%)
Means of transportation to work - Streetcar or trolley car (%)
Means of transportation to work - Subway or elevated (%)
Means of transportation to work - Railroad (%)
Means of transportation to work - Ferryboat (%)
Means of transportation to work - Taxicab (%)
Means of transportation to work - Motorcycle (%)
Means of transportation to work - Bicycle (%)
Means of transportation to work - Walked (%)
Means of transportation to work - Other means (%)
Working at home (%)
Industry diversity
Most Common Industries - Agriculture, forestry, fishing and hunting, and mining (%)
Most Common Industries - Agriculture, forestry, fishing and hunting (%)
Most Common Industries - Mining, quarrying, and oil and gas extraction (%)
Most Common Industries - Construction (%)
Most Common Industries - Manufacturing (%)
Most Common Industries - Wholesale trade (%)
Most Common Industries - Retail trade (%)
Most Common Industries - Transportation and warehousing, and utilities (%)
Most Common Industries - Transportation and warehousing (%)
Most Common Industries - Utilities (%)
Most Common Industries - Information (%)
Most Common Industries - Finance and insurance, and real estate and rental and leasing (%)
Most Common Industries - Finance and insurance (%)
Most Common Industries - Real estate and rental and leasing (%)
Most Common Industries - Professional, scientific, and management, and administrative and waste management services (%)
Most Common Industries - Professional, scientific, and technical services (%)
Most Common Industries - Management of companies and enterprises (%)
Most Common Industries - Administrative and support and waste management services (%)
Most Common Industries - Educational services, and health care and social assistance (%)
Most Common Industries - Educational services (%)
Most Common Industries - Health care and social assistance (%)
Most Common Industries - Arts, entertainment, and recreation, and accommodation and food services (%)
Most Common Industries - Arts, entertainment, and recreation (%)
Most Common Industries - Accommodation and food services (%)
Most Common Industries - Other services, except public administration (%)
Most Common Industries - Public administration (%)
Occupation diversity
Most Common Occupations - Management, business, science, and arts occupations (%)
Most Common Occupations - Management, business, and financial occupations (%)
Most Common Occupations - Management occupations (%)
Most Common Occupations - Business and financial operations occupations (%)
Most Common Occupations - Computer, engineering, and science occupations (%)
Most Common Occupations - Computer and mathematical occupations (%)
Most Common Occupations - Architecture and engineering occupations (%)
Most Common Occupations - Life, physical, and social science occupations (%)
Most Common Occupations - Education, legal, community service, arts, and media occupations (%)
Most Common Occupations - Community and social service occupations (%)
Most Common Occupations - Legal occupations (%)
Most Common Occupations - Education, training, and library occupations (%)
Most Common Occupations - Arts, design, entertainment, sports, and media occupations (%)
Most Common Occupations - Healthcare practitioners and technical occupations (%)
Most Common Occupations - Health diagnosing and treating practitioners and other technical occupations (%)
Most Common Occupations - Health technologists and technicians (%)
Most Common Occupations - Service occupations (%)
Most Common Occupations - Healthcare support occupations (%)
Most Common Occupations - Protective service occupations (%)
Most Common Occupations - Fire fighting and prevention, and other protective service workers including supervisors (%)
Most Common Occupations - Law enforcement workers including supervisors (%)
Most Common Occupations - Food preparation and serving related occupations (%)
Most Common Occupations - Building and grounds cleaning and maintenance occupations (%)
Most Common Occupations - Personal care and service occupations (%)
Most Common Occupations - Sales and office occupations (%)
Most Common Occupations - Sales and related occupations (%)
Most Common Occupations - Office and administrative support occupations (%)
Most Common Occupations - Natural resources, construction, and maintenance occupations (%)
Most Common Occupations - Farming, fishing, and forestry occupations (%)
Most Common Occupations - Construction and extraction occupations (%)
Most Common Occupations - Installation, maintenance, and repair occupations (%)
Most Common Occupations - Production, transportation, and material moving occupations (%)
Most Common Occupations - Production occupations (%)
Most Common Occupations - Transportation occupations (%)
Most Common Occupations - Material moving occupations (%)
People in Group quarters - Institutionalized population (%)
People in Group quarters - Correctional institutions (%)
People in Group quarters - Federal prisons and detention centers (%)
People in Group quarters - Halfway houses (%)
People in Group quarters - Local jails and other confinement facilities (including police lockups) (%)
People in Group quarters - Military disciplinary barracks (%)
People in Group quarters - State prisons (%)
People in Group quarters - Other types of correctional institutions (%)
People in Group quarters - Nursing homes (%)
People in Group quarters - Hospitals/wards, hospices, and schools for the handicapped (%)
People in Group quarters - Hospitals/wards and hospices for chronically ill (%)
People in Group quarters - Hospices or homes for chronically ill (%)
People in Group quarters - Military hospitals or wards for chronically ill (%)
People in Group quarters - Other hospitals or wards for chronically ill (%)
People in Group quarters - Hospitals or wards for drug/alcohol abuse (%)
People in Group quarters - Mental (Psychiatric) hospitals or wards (%)
People in Group quarters - Schools, hospitals, or wards for the mentally retarded (%)
People in Group quarters - Schools, hospitals, or wards for the physically handicapped (%)
People in Group quarters - Institutions for the deaf (%)
People in Group quarters - Institutions for the blind (%)
People in Group quarters - Orthopedic wards and institutions for the physically handicapped (%)
People in Group quarters - Wards in general hospitals for patients who have no usual home elsewhere (%)
People in Group quarters - Wards in military hospitals for patients who have no usual home elsewhere (%)
People in Group quarters - Juvenile institutions (%)
People in Group quarters - Long-term care (%)
People in Group quarters - Homes for abused, dependent, and neglected children (%)
People in Group quarters - Residential treatment centers for emotionally disturbed children (%)
People in Group quarters - Training schools for juvenile delinquents (%)
People in Group quarters - Short-term care, detention or diagnostic centers for delinquent children (%)
People in Group quarters - Type of juvenile institution unknown (%)
People in Group quarters - Noninstitutionalized population (%)
People in Group quarters - College dormitories (includes college quarters off campus) (%)
People in Group quarters - Military quarters (%)
People in Group quarters - On base (%)
People in Group quarters - Barracks, unaccompanied personnel housing (UPH), (Enlisted/Officer), ;and similar group living quarters for military personnel (%)
People in Group quarters - Transient quarters for temporary residents (%)
People in Group quarters - Military ships (%)
People in Group quarters - Group homes (%)
People in Group quarters - Homes or halfway houses for drug/alcohol abuse (%)
People in Group quarters - Homes for the mentally ill (%)
People in Group quarters - Homes for the mentally retarded (%)
People in Group quarters - Homes for the physically handicapped (%)
People in Group quarters - Other group homes (%)
People in Group quarters - Religious group quarters (%)
People in Group quarters - Dormitories (%)
People in Group quarters - Agriculture workers' dormitories on farms (%)
People in Group quarters - Job Corps and vocational training facilities (%)
People in Group quarters - Other workers' dormitories (%)
People in Group quarters - Crews of maritime vessels (%)
People in Group quarters - Other nonhousehold living situations (%)
People in Group quarters - Other noninstitutional group quarters (%)
Residents speaking English at home (%)
Residents speaking English at home - Born in the United States (%)
Residents speaking English at home - Native, born elsewhere (%)
Residents speaking English at home - Foreign born (%)
Residents speaking Spanish at home (%)
Residents speaking Spanish at home - Born in the United States (%)
Residents speaking Spanish at home - Native, born elsewhere (%)
Residents speaking Spanish at home - Foreign born (%)
Residents speaking other language at home (%)
Residents speaking other language at home - Born in the United States (%)
Residents speaking other language at home - Native, born elsewhere (%)
Residents speaking other language at home - Foreign born (%)
Class of Workers - Employee of private company (%)
Class of Workers - Self-employed in own incorporated business (%)
Class of Workers - Private not-for-profit wage and salary workers (%)
Class of Workers - Local government workers (%)
Class of Workers - State government workers (%)
Class of Workers - Federal government workers (%)
Class of Workers - Self-employed workers in own not incorporated business and Unpaid family workers (%)
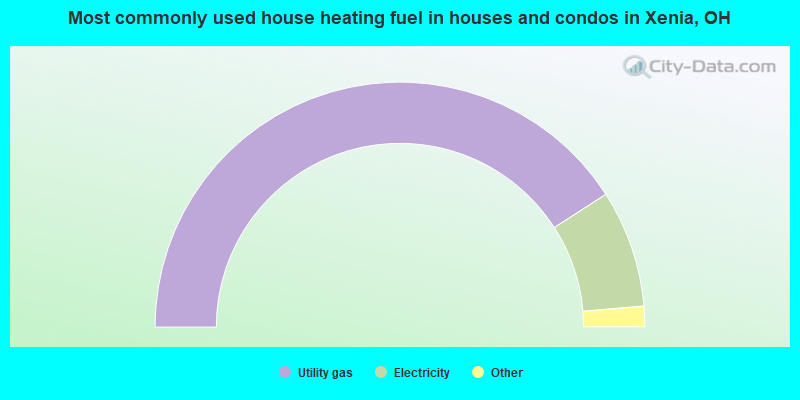
House heating fuel used in houses and condos - Utility gas (%)
House heating fuel used in houses and condos - Bottled, tank, or LP gas (%)
House heating fuel used in houses and condos - Electricity (%)
House heating fuel used in houses and condos - Fuel oil, kerosene, etc. (%)
House heating fuel used in houses and condos - Coal or coke (%)
House heating fuel used in houses and condos - Wood (%)
House heating fuel used in houses and condos - Solar energy (%)
House heating fuel used in houses and condos - Other fuel (%)
House heating fuel used in houses and condos - No fuel used (%)
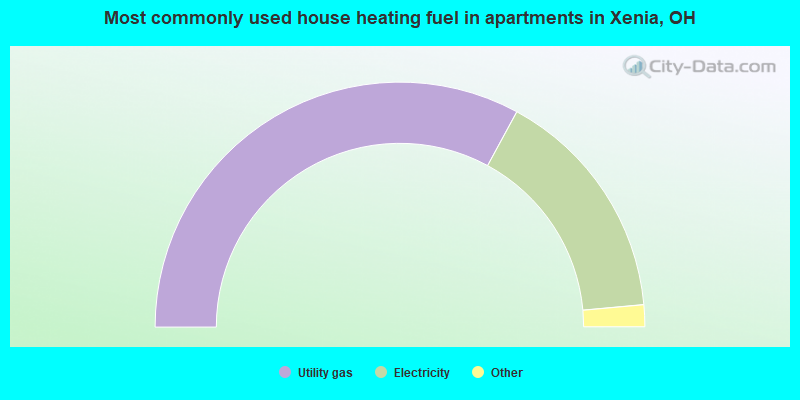
House heating fuel used in apartments - Utility gas (%)
House heating fuel used in apartments - Bottled, tank, or LP gas (%)
House heating fuel used in apartments - Electricity (%)
House heating fuel used in apartments - Fuel oil, kerosene, etc. (%)
House heating fuel used in apartments - Coal or coke (%)
House heating fuel used in apartments - Wood (%)
House heating fuel used in apartments - Solar energy (%)
House heating fuel used in apartments - Other fuel (%)
House heating fuel used in apartments - No fuel used (%)
Armed forces status - In Armed Forces (%)
Armed forces status - Civilian (%)
Armed forces status - Civilian - Veteran (%)
Armed forces status - Civilian - Nonveteran (%)
Fatal accidents locations in years 2005-2021
Fatal accidents locations in 2005
Fatal accidents locations in 2006
Fatal accidents locations in 2007
Fatal accidents locations in 2008
Fatal accidents locations in 2009
Fatal accidents locations in 2010
Fatal accidents locations in 2011
Fatal accidents locations in 2012
Fatal accidents locations in 2013
Fatal accidents locations in 2014
Fatal accidents locations in 2015
Fatal accidents locations in 2016
Fatal accidents locations in 2017
Fatal accidents locations in 2018
Fatal accidents locations in 2019
Fatal accidents locations in 2020
Fatal accidents locations in 2021
Alcohol use - People drinking some alcohol every month (%)
Alcohol use - People not drinking at all (%)
Alcohol use - Average days/month drinking alcohol
Alcohol use - Average drinks/week
Alcohol use - Average days/year people drink much
Audiometry - Average condition of hearing (%)
Audiometry - People that can hear a whisper from across a quiet room (%)
Audiometry - People that can hear normal voice from across a quiet room (%)
Audiometry - Ears ringing, roaring, buzzing (%)
Audiometry - Had a job exposure to loud noise (%)
Audiometry - Had off-work exposure to loud noise (%)
Blood Pressure & Cholesterol - Has high blood pressure (%)
Blood Pressure & Cholesterol - Checking blood pressure at home (%)
Blood Pressure & Cholesterol - Frequently checking blood cholesterol (%)
Blood Pressure & Cholesterol - Has high cholesterol level (%)
Consumer Behavior - Money monthly spent on food at supermarket/grocery store
Consumer Behavior - Money monthly spent on food at other stores
Consumer Behavior - Money monthly spent on eating out
Consumer Behavior - Money monthly spent on carryout/delivered foods
Consumer Behavior - Income spent on food at supermarket/grocery store (%)
Consumer Behavior - Income spent on food at other stores (%)
Consumer Behavior - Income spent on eating out (%)
Consumer Behavior - Income spent on carryout/delivered foods (%)
Current Health Status - General health condition (%)
Current Health Status - Blood donors (%)
Current Health Status - Has blood ever tested for HIV virus (%)
Current Health Status - Left-handed people (%)
Dermatology - People using sunscreen (%)
Diabetes - Diabetics (%)
Diabetes - Had a blood test for high blood sugar (%)
Diabetes - People taking insulin (%)
Diet Behavior & Nutrition - Diet health (%)
Diet Behavior & Nutrition - Milk product consumption (# of products/month)
Diet Behavior & Nutrition - Meals not home prepared (#/week)
Diet Behavior & Nutrition - Meals from fast food or pizza place (#/week)
Diet Behavior & Nutrition - Ready-to-eat foods (#/month)
Diet Behavior & Nutrition - Frozen meals/pizza (#/month)
Drug Use - People that ever used marijuana or hashish (%)
Drug Use - Ever used hard drugs (%)
Drug Use - Ever used any form of cocaine (%)
Drug Use - Ever used heroin (%)
Drug Use - Ever used methamphetamine (%)
Health Insurance - People covered by health insurance (%)
Kidney Conditions-Urology - Avg. # of times urinating at night
Medical Conditions - People with asthma (%)
Medical Conditions - People with anemia (%)
Medical Conditions - People with psoriasis (%)
Medical Conditions - People with overweight (%)
Medical Conditions - Elderly people having difficulties in thinking or remembering (%)
Medical Conditions - People who ever received blood transfusion (%)
Medical Conditions - People having trouble seeing even with glass/contacts (%)
Medical Conditions - People with arthritis (%)
Medical Conditions - People with gout (%)
Medical Conditions - People with congestive heart failure (%)
Medical Conditions - People with coronary heart disease (%)
Medical Conditions - People with angina pectoris (%)
Medical Conditions - People who ever had heart attack (%)
Medical Conditions - People who ever had stroke (%)
Medical Conditions - People with emphysema (%)
Medical Conditions - People with thyroid problem (%)
Medical Conditions - People with chronic bronchitis (%)
Medical Conditions - People with any liver condition (%)
Medical Conditions - People who ever had cancer or malignancy (%)
Mental Health - People who have little interest in doing things (%)
Mental Health - People feeling down, depressed, or hopeless (%)
Mental Health - People who have trouble sleeping or sleeping too much (%)
Mental Health - People feeling tired or having little energy (%)
Mental Health - People with poor appetite or overeating (%)
Mental Health - People feeling bad about themself (%)
Mental Health - People who have trouble concentrating on things (%)
Mental Health - People moving or speaking slowly or too fast (%)
Mental Health - People having thoughts they would be better off dead (%)
Oral Health - Average years since last visit a dentist
Oral Health - People embarrassed because of mouth (%)
Oral Health - People with gum disease (%)
Oral Health - General health of teeth and gums (%)
Oral Health - Average days a week using dental floss/device
Oral Health - Average days a week using mouthwash for dental problem
Oral Health - Average number of teeth
Pesticide Use - Households using pesticides to control insects (%)
Pesticide Use - Households using pesticides to kill weeds (%)
Physical Activity - People doing vigorous-intensity work activities (%)
Physical Activity - People doing moderate-intensity work activities (%)
Physical Activity - People walking or bicycling (%)
Physical Activity - People doing vigorous-intensity recreational activities (%)
Physical Activity - People doing moderate-intensity recreational activities (%)
Physical Activity - Average hours a day doing sedentary activities
Physical Activity - Average hours a day watching TV or videos
Physical Activity - Average hours a day using computer
Physical Functioning - People having limitations keeping them from working (%)
Physical Functioning - People limited in amount of work they can do (%)
Physical Functioning - People that need special equipment to walk (%)
Physical Functioning - People experiencing confusion/memory problems (%)
Physical Functioning - People requiring special healthcare equipment (%)
Prescription Medications - Average number of prescription medicines taking
Preventive Aspirin Use - Adults 40+ taking low-dose aspirin (%)
Reproductive Health - Vaginal deliveries (%)
Reproductive Health - Cesarean deliveries (%)
Reproductive Health - Deliveries resulted in a live birth (%)
Reproductive Health - Pregnancies resulted in a delivery (%)
Reproductive Health - Women breastfeeding newborns (%)
Reproductive Health - Women that had a hysterectomy (%)
Reproductive Health - Women that had both ovaries removed (%)
Reproductive Health - Women that have ever taken birth control pills (%)
Reproductive Health - Women taking birth control pills (%)
Reproductive Health - Women that have ever used Depo-Provera or injectables (%)
Reproductive Health - Women that have ever used female hormones (%)
Sexual Behavior - People 18+ that ever had sex (vaginal, anal, or oral) (%)
Sexual Behavior - Males 18+ that ever had vaginal sex with a woman (%)
Sexual Behavior - Males 18+ that ever performed oral sex on a woman (%)
Sexual Behavior - Males 18+ that ever had anal sex with a woman (%)
Sexual Behavior - Males 18+ that ever had any sex with a man (%)
Sexual Behavior - Females 18+ that ever had vaginal sex with a man (%)
Sexual Behavior - Females 18+ that ever performed oral sex on a man (%)
Sexual Behavior - Females 18+ that ever had anal sex with a man (%)
Sexual Behavior - Females 18+ that ever had any kind of sex with a woman (%)
Sexual Behavior - Average age people first had sex
Sexual Behavior - Average number of female sex partners in lifetime (males 18+)
Sexual Behavior - Average number of female vaginal sex partners in lifetime (males 18+)
Sexual Behavior - Average age people first performed oral sex on a woman (18+)
Sexual Behavior - Average number of woman performed oral sex on in lifetime (18+)
Sexual Behavior - Average number of male sex partners in lifetime (males 18+)
Sexual Behavior - Average number of male anal sex partners in lifetime (males 18+)
Sexual Behavior - Average age people first performed oral sex on a man (18+)
Sexual Behavior - Average number of male oral sex partners in lifetime (18+)
Sexual Behavior - People using protection when performing oral sex (%)
Sexual Behavior - Average number of times people have vaginal or anal sex a year
Sexual Behavior - People having sex without condom (%)
Sexual Behavior - Average number of male sex partners in lifetime (females 18+)
Sexual Behavior - Average number of male vaginal sex partners in lifetime (females 18+)
Sexual Behavior - Average number of female sex partners in lifetime (females 18+)
Sexual Behavior - Circumcised males 18+ (%)
Sleep Disorders - Average hours sleeping at night
Sleep Disorders - People that has trouble sleeping (%)
Smoking-Cigarette Use - People smoking cigarettes (%)
Taste & Smell - People 40+ having problems with smell (%)
Taste & Smell - People 40+ having problems with taste (%)
Taste & Smell - People 40+ that ever had wisdom teeth removed (%)
Taste & Smell - People 40+ that ever had tonsils teeth removed (%)
Taste & Smell - People 40+ that ever had a loss of consciousness because of a head injury (%)
Taste & Smell - People 40+ that ever had a broken nose or other serious injury to face or skull (%)
Taste & Smell - People 40+ that ever had two or more sinus infections (%)
Weight - Average height (inches)
Weight - Average weight (pounds)
Weight - Average BMI
Weight - People that are obese (%)
Weight - People that ever were obese (%)
Weight - People trying to lose weight (%)
Officers per 1,000 residents here:
1.58Ohio average:
2.31
Latest news from Xenia, OH collected exclusively by city-data.com from local newspapers, TV, and radio stations
Ancestries: American (17.3%), German (13.6%), English (12.2%), Irish (9.3%), Italian (2.9%), Scottish (2.5%).
Current Local Time:
Land area: 12.1 square miles.
Population density: 2,108 people per square mile (low).
749 residents are foreign born (0.8% Africa , 0.6% Europe , 0.6% Latin America , 0.5% Asia , 0.3% North America ).
Median real estate property taxes paid for housing units with mortgages in 2022: $1,662 (1.1%)Median real estate property taxes paid for housing units with no mortgage in 2022: $2,063 (1.4%)
Nearest city with pop. 50,000+: Kettering, OH
Nearest city with pop. 200,000+: Cincinnati, OH
Nearest city with pop. 1,000,000+: Chicago, IL
Nearest cities:
Latitude: 39.68 N, Longitude: 83.94 W
Nickname or alias (official or unofficial): Twine City
Daytime population change due to commuting: -2,659 (-10.4%)Workers who live and work in this city: 3,222 (29.0%)
Property values in Xenia, OH
Single-family new house construction building permits:
1999: 79 buildings , average cost: $107,3001998: 73 buildings , average cost: $95,0001997: 96 buildings , average cost: $92,300Unemployment in December 2023:
Most common occupations in Xenia, OH (%)
Both Males Females
Building and grounds cleaning and maintenance occupations (5.3%)
Metal workers and plastic workers (5.1%)
Secretaries and administrative assistants (3.8%)
Other production occupations, including supervisors (3.8%)
Driver/sales workers and truck drivers (3.5%)
Other office and administrative support workers, including supervisors (3.4%)
Other sales and related occupations, including supervisors (3.4%)
Metal workers and plastic workers (7.9%)
Building and grounds cleaning and maintenance occupations (6.5%)
Driver/sales workers and truck drivers (6.5%)
Other production occupations, including supervisors (5.2%)
Construction traders workers except carpenters, electricians, painters, plumbers, and construction laborers (4.3%)
Vehicle and mobile equipment mechanics, installers, and repairers (3.7%)
Electrical equipment mechanics and other installation, maintenance, and repair workers, including supervisors (3.7%)
Secretaries and administrative assistants (7.5%)
Other office and administrative support workers, including supervisors (5.2%)
Nursing, psychiatric, and home health aides (4.4%)
Information and record clerks, except customer service representatives (4.3%)
Cashiers (4.2%)
Other sales and related occupations, including supervisors (4.2%)
Building and grounds cleaning and maintenance occupations (4.0%)
Tornado activity:
Xenia-area historical tornado activity is slightly above Ohio state average. It is 46% greater than the overall U.S. average.
On 4/3/1974, a category F5 (max. wind speeds 261-318 mph) tornado 7.0 miles away from the Xenia city center killed 36 people and injured 1150 people and caused between $50,000,000 and $500,000,000 in damages.
On 9/20/2000, a category F4 (max. wind speeds 207-260 mph) tornado 3.2 miles away from the city center killed one person and injured 100 people and caused $15 million in damages.
Earthquake activity:
Xenia-area historical earthquake activity is significantly above Ohio state average. It is 22% greater than the overall U.S. average. On 7/27/1980 at 18:52:21, a magnitude 5.2 (5.1 MB, 4.7 MS, 5.0 UK, 5.2 UK, Class: Moderate, Intensity: VI - VII) earthquake occurred 102.3 miles away from Xenia center On 4/18/2008 at 09:36:59, a magnitude 5.4 (5.1 MB, 4.8 MS, 5.4 MW, 5.2 MW) earthquake occurred 228.5 miles away from Xenia center On 7/12/1986 at 08:19:37, a magnitude 4.5 (4.5 MB, Class: Light, Intensity: IV - V) earthquake occurred 63.3 miles away from Xenia center On 9/25/1998 at 19:52:52, a magnitude 5.2 (4.8 MB, 4.3 MS, 5.2 LG, 4.5 MW, Depth: 3.1 mi) earthquake occurred 224.1 miles away from Xenia center On 9/7/1988 at 02:28:09, a magnitude 4.6 (4.5 MB, 4.6 LG) earthquake occurred 106.6 miles away from Xenia center On 4/18/2008 at 09:36:59, a magnitude 5.2 (5.2 MW, Depth: 8.9 mi) earthquake occurred 228.5 miles away from the city center Magnitude types: regional Lg-wave magnitude (LG), body-wave magnitude (MB), surface-wave magnitude (MS), moment magnitude (MW) Natural disasters: The number of natural disasters in Greene County (12) is smaller than the US average (15).Major Disasters (Presidential) Declared: 5Emergencies Declared: 5Storms: 4, Floods: 3, Tornadoes: 3, Snows: 2, Snowstorms: 2, Winds: 2, Blizzard: 1, Heavy Rain: 1, Hurricane: 1, Landslide: 1, Mudslide: 1, Tropical Depression: 1, Other: 1 (Note: some incidents may be assigned to more than one category). Hospitals and medical centers in Xenia: GREENE MEMORIAL HOSPITAL (Voluntary non-profit - Private, provides emergency services, 1141 NORTH MONROE DRIVE) TOWARD INDEPENDENCE, INC - MAR (2143 MARYLAND AVENUE) TOWARD INDEPENDENCE, INC - PUE (1841 PUEBLO DRIVE) GREENE OAKS HEALTH CENTER (164 OFFICE PARK DRIVE)
GREENEWOOD MANOR (711 DAYTON-XENIA ROAD)
HOSPITALITY HOME EAST (1301 NORTH MONROE DRIVE)
LIBERTY NURSING CENTER OF XENIA (126 WILSON DRIVE)
DAVITA SOUTHWEST OHIO DIALYSIS (215 SOUTH ALLISON AVENUE)
Airports located in Xenia:
College/University in Xenia: Greene County Vocational School District Full-time enrollment: 96; Location: 2960 West Enon Road; Public; Website: www.greeneccc.com)
Colleges/universities with over 2000 students nearest to Xenia:
Central State University (about 4 miles; Wilberforce, OH ; Full-time enrollment: 2,094)
Cedarville University (about 9 miles; Cedarville, OH ; FT enrollment: 3,396)
Wright State University-Main Campus (about 10 miles; Dayton, OH ; FT enrollment: 14,482)
Fortis College-Centerville (about 12 miles; Centerville, OH ; FT enrollment: 4,527)
University of Dayton (about 14 miles; Dayton, OH ; FT enrollment: 10,392)
Sinclair Community College (about 15 miles; Dayton, OH ; FT enrollment: 13,779)
Clark State Community College (about 17 miles; Springfield, OH ; FT enrollment: 3,689)
Public high schools in Xenia: XENIA HIGH SCHOOL Students: 1,469, Location: 303 KINSEY RD, Grades: 9-12)GREENE COUNTY CAREER CENTER Location: 2960 W ENON RD, Grades: 5-12)
Private high school in Xenia: XENIA CHRISTIAN SCHOOL Students: 374, Location: 1101 JOHN WESLEY AVE, Grades: KG-12)
Public elementary/middle schools in Xenia: WARNER MIDDLE SCHOOL Students: 492, Location: 600 BUCKSKIN TRL, Grades: 6-8)TECUMSEH ELEMENTARY SCHOOL Students: 345, Location: 1058 OLD SPRINGFIELD PIKE, Grades: KG-5)COX ELEMENTARY SCHOOL Students: 305, Location: 506 DAYTON AVE, Grades: KG-5)SHAWNEE ELEMENTARY SCHOOL Students: 268, Location: 92 E ANKENEY MILL RD, Grades: KG-5)ARROWOOD ELEMENTARY Students: 253, Location: 1588 PAWNEE DR, Grades: KG-5)SUMMIT ACADEMY COMMUNITY SCHOOL ALTERNATIVE LEARNE Location: 1694 PAWNEE DR, Grades: KG-8, Charter school )
CENTRAL MIDDLE SCHOOL Location: 425 EDISON BLVD, Grades: PK-6)
MCKINLEY ELEMENTARY SCHOOL Location: 819 COLORADO DR, Grades: KG-5)
TREBEIN ELEMENTARY SCHOOL Location: 1728 DAYTON XENIA RD, Grades: KG-5)
See full list of schools located in Xenia Library in Xenia: GREENE COUNTY PUBLIC LIBRARY Operating income: $9,279,938; Location: 76 E. MARKET; 517,253 books ; 3,270 e-books ; 48,632 audio materials ; 61,149 video materials ; 14 local licensed databases ; 266 state licensed databases ; 1,255 print serial subscriptions )
Notable locations in Xenia: (A) , Greene County Home (B) , Greene County Fairgrounds (C) , Xenia Golf Club (D) , Xenia Industrial and Commercial Park (E) , Xenia Demolition Debris Facility (F) , Greene County Courthouse (G) , Xenia Fire Department Station 1 (H) , Xenia Township Fire Emergency Medical Services Station 2 (I) , Ohio Veterans Childrens Home (J) , Greene County Mental Health Services (K) , Greene County Law Library (L) , Xenia City Hall (M) , Greene County Jail (N) , Greene County District Library (O) . Display/hide their locations on the map
Shopping Centers: (1) , Xenia Towne Square Shopping Center (2) . Display/hide their locations on the map
Churches in Xenia include: (A) , Trinity Methodist Church (B) , Second United Presbyterian Church (C) , Saint Brigids Roman Catholic Church (D) , Nazarene Church (E) , First United Presbyterian Church (F) , First Presbyterian Church (G) , First Pentecostal Church (H) , First Evangelical Lutheran Church (I) . Display/hide their locations on the map
Cemeteries: (1) , Woodland Cemetery (2) , Saint Brigids Cemetery (3) . Display/hide their locations on the map
Streams, rivers, and creeks: (A) . Display/hide its location on the map
Parks in Xenia include: (1) , Sel Arnovitz Park (2) , Spring Hill Park (3) , Shawnee Park (4) , Parnell Park (5) , Waterstreet Historic District (6) , East Second Street Historic District (7) , Franklin Park (8) , Ridgebury Park (9) . Display/hide their locations on the map
Tourist attractions:
Hotels:
Birthplace of: T. B. Walker - Businessperson, Matt Brown (fighter) - Martial artist, Caitlin Halligan - Attorney, Charley Grapewin - Film actor, Daniel J. Myers - Sociologist, James H. Hyslop - Professor of ethics and logic, Jarrod Martin - Politician, Moe Ankney - Football player and coach, Trent Cole - 2005 NFL player (Philadelphia Eagles, born : Oct 5, 1982), James H. Kyle - Politician.
Greene County has a predicted average indoor radon screening level greater than 4 pCi/L (pico curies per liter) - Highest Potential Drinking water stations with addresses in Xenia and their reported violations in the past:
GREENE CO.-NORTHWEST REG WATER (Population served: 36,785, Groundwater):
Past monitoring violations:
Lead Consumer Notice - In DEC-31-2011, Contaminant: Lead and Copper Rule. Follow-up actions: St Violation/Reminder Notice (FEB-09-2012), St Compliance achieved (FEB-14-2012)
Population served: 997, Purch surface water):
Past monitoring violations:
Lead Consumer Notice - In DEC-31-2011, Contaminant: Lead and Copper Rule. Follow-up actions: St Violation/Reminder Notice (FEB-09-2012), St Compliance achieved (FEB-14-2012)
Failure Submit IDSE/Subpart V Plan Rpt - In OCT-01-2011, Contaminant: DBP STAGE 2. Follow-up actions: St Violation/Reminder Notice (NOV-03-2011), St Compliance achieved (NOV-08-2011)
Monitoring and Reporting (DBP) - Between APR-2008 and JUN-2008, Contaminant: Total Haloacetic Acids (HAA5). Follow-up actions: St Public Notif requested (AUG-26-2008), St Violation/Reminder Notice (AUG-26-2008), St Compliance achieved (SEP-19-2008)
Monitoring and Reporting (DBP) - Between APR-2008 and JUN-2008, Contaminant: TTHM. Follow-up actions: St Public Notif requested (AUG-26-2008), St Violation/Reminder Notice (AUG-26-2008), St Compliance achieved (SEP-19-2008)
Monitoring and Reporting (DBP) - Between JAN-2008 and MAR-2008, Contaminant: Total Haloacetic Acids (HAA5). Follow-up actions: St Public Notif requested (AUG-26-2008), St Violation/Reminder Notice (AUG-26-2008), St Compliance achieved (SEP-19-2008)
One other older monitoring violation
Population served: 800, Groundwater):
Past monitoring violations:
7 routine major monitoring violations
Population served: 745, Groundwater):
Past monitoring violations:
One regular monitoring violation
Population served: 580, Purch surface water):
Past monitoring violations:
Lead Consumer Notice - In DEC-31-2011, Contaminant: Lead and Copper Rule. Follow-up actions: St Violation/Reminder Notice (FEB-09-2012), St Compliance achieved (FEB-14-2012)
Failure Submit IDSE/Subpart V Plan Rpt - In OCT-01-2011, Contaminant: DBP STAGE 2. Follow-up actions: St Violation/Reminder Notice (NOV-03-2011), St Compliance achieved (NOV-08-2011)
Population served: 350, Groundwater):
Past monitoring violations:
10 routine major monitoring violations
Population served: 275, Purch surface water):
Past monitoring violations:
Lead Consumer Notice - In DEC-31-2011, Contaminant: Lead and Copper Rule. Follow-up actions: St Violation/Reminder Notice (FEB-09-2012), St Compliance achieved (FEB-14-2012)
Failure Submit IDSE/Subpart V Plan Rpt - In OCT-01-2011, Contaminant: DBP STAGE 2. Follow-up actions: St Violation/Reminder Notice (NOV-03-2011), St Compliance achieved (NOV-08-2011)
Population served: 271, Purch surface water):
Past monitoring violations:
Lead Consumer Notice - In DEC-31-2011, Contaminant: Lead and Copper Rule. Follow-up actions: St Violation/Reminder Notice (FEB-09-2012), St Compliance achieved (FEB-14-2012)
Failure Submit IDSE/Subpart V Plan Rpt - In OCT-01-2011, Contaminant: DBP STAGE 2. Follow-up actions: St Violation/Reminder Notice (NOV-03-2011), St Compliance achieved (NOV-08-2011)
Drinking water stations with addresses in Xenia that have no violations reported:
GREENE COUNTY EASTERN REGIONAL PWS (Population served: 4,800, Primary Water Source Type: Purch groundwater)
Average household size: This city:
2.4 peopleOhio:
2.4 people
Percentage of family households: This city:
63.8%Whole state:
65.0%
Percentage of households with unmarried partners: This city:
6.5%Whole state:
6.8%
Likely homosexual households (counted as self-reported same-sex unmarried-partner households)
Lesbian couples: 0.3% of all households Gay men: 0.1% of all households
People in group quarters in Xenia in 2010:
312 people in nursing facilities/skilled-nursing facilities
270 people in local jails and other municipal confinement facilities
133 people in group homes intended for adults
64 people in correctional facilities intended for juveniles
54 people in hospitals with patients who have no usual home elsewhere
51 people in residential treatment centers for adults
41 people in emergency and transitional shelters (with sleeping facilities) for people experiencing homelessness
People in group quarters in Xenia in 2000:
384 people in nursing homes
133 people in local jails and other confinement facilities (including police lockups)
50 people in other noninstitutional group quarters
23 people in homes or halfway houses for drug/alcohol abuse
15 people in other group homes
11 people in homes for the mentally ill
6 people in short-term care, detention or diagnostic centers for delinquent children
5 people in orthopedic wards and institutions for the physically handicapped
4 people in homes for the mentally retarded
Banks with branches in Xenia (2011 data):
Fifth Third Bank: Xenia Bank Mart at 1700 West Park Square, branch established on 1994/12/13; Xenia Downtown Banking Branch at 100 West Main Street, branch established on 1885/01/01. Info updated 2009/10/05: Bank assets: $114,540.4 mil, Deposits: $89,689.1 mil, headquarters in Cincinnati, OH, positive income , Commercial Lending Specialization, 1378 total offices , Holding Company: Fifth Third Bancorp
The Park National Bank: 2011 Xenia Downtown Branch at 161 East Main Street, branch established on 1980/12/14; 2012 Xenia Plaza Branch at 82 North Allison Avenue, branch established on 1962/10/01. Info updated 2008/09/29: Bank assets: $6,281.7 mil, Deposits: $4,611.6 mil, headquarters in Newark, OH, positive income , Commercial Lending Specialization, 123 total offices , Holding Company: Park National Corporation
U.S. Bank National Association: Xenia Branch at 290 Xenia Towne Square, branch established on 1981/01/07. Info updated 2012/01/30: Bank assets: $330,470.8 mil, Deposits: $236,091.5 mil, headquarters in Cincinnati, OH, positive income , 3121 total offices , Holding Company: U.S. Bancorp
JPMorgan Chase Bank, National Association: Xenia Branch at 306 West Second Street, branch established on 1980/07/18. Info updated 2011/11/10: Bank assets: $1,811,678.0 mil, Deposits: $1,190,738.0 mil, headquarters in Columbus, OH, positive income , International Specialization, 5577 total offices , Holding Company: Jpmorgan Chase & Co.
The Huntington National Bank: Xenia Central Branch at 194 North Detroit St, branch established on 1989/06/30. Info updated 2012/04/02: Bank assets: $54,183.4 mil, Deposits: $44,300.3 mil, headquarters in Columbus, OH, positive income , Commercial Lending Specialization, 878 total offices , Holding Company: Huntington Bancshares Incorporated
PNC Bank, National Association: Xenia Branch at 98 Hospitality Drive, branch established on 2007/07/01. Info updated 2012/03/20: Bank assets: $263,309.6 mil, Deposits: $197,343.0 mil, headquarters in Wilmington, DE, positive income , Commercial Lending Specialization, 3085 total offices , Holding Company: Pnc Financial Services Group, Inc., The
Woodforest National Bank: Xenia Wal-Mart Branch at 70 Hospitality Lane, branch established on 2006/10/02. Info updated 2011/05/10: Bank assets: $3,488.9 mil, Deposits: $3,097.6 mil, headquarters in Houston, TX, positive income , Commercial Lending Specialization, 766 total offices , Holding Company: Woodforest Financial Group Employee Stock Ownership Plan (With 401(K) Provisions)
KeyBank National Association: Xenia Central Branch at 120 North Detroit Street, branch established on 1881/01/01. Info updated 2008/03/03: Bank assets: $86,198.8 mil, Deposits: $64,214.8 mil, headquarters in Cleveland, OH, positive income , Commercial Lending Specialization, 1067 total offices , Holding Company: Keycorp
For population 15 years and over in Xenia:
Never married: 34.2%Now married: 42.6%Separated: 2.4%Widowed: 7.0%Divorced: 13.8% For population 25 years and over in Xenia:
High school or higher: 88.9%Bachelor's degree or higher: 21.5%Graduate or professional degree: 8.4%Unemployed: 5.6%Mean travel time to work (commute): 24.3 minutes
Education Gini index (Inequality in education) Here:
9.9Ohio average:
11.0
Religion statistics for Xenia, OH (based on Greene County data)
Religion Adherents Congregations Evangelical Protestant 23,435 105 Catholic 14,064 5 Mainline Protestant 12,115 49 Other 6,403 15 Black Protestant 1,378 7 None 104,178 -
Source: Clifford Grammich, Kirk Hadaway, Richard Houseal, Dale E.Jones, Alexei Krindatch, Richie Stanley and Richard H.Taylor. 2012. 2010 U.S.Religion Census: Religious Congregations & Membership Study. Association of Statisticians of American Religious Bodies. Jones, Dale E., et al. 2002. Congregations and Membership in the United States 2000. Nashville, TN: Glenmary Research Center. Graphs represent county-level data
Food Environment Statistics: Number of grocery stores : 22Greene County :
1.39 / 10,000 pop.Ohio :
1.89 / 10,000 pop.
Number of supercenters and club stores : 2Greene County :
0.13 / 10,000 pop.Ohio :
0.13 / 10,000 pop.
Number of convenience stores (no gas) : 11Greene County :
0.69 / 10,000 pop.Ohio :
1.25 / 10,000 pop.
Number of convenience stores (with gas) : 32This county :
2.02 / 10,000 pop.Ohio :
2.93 / 10,000 pop.
Number of full-service restaurants : 89Greene County :
5.61 / 10,000 pop.Ohio :
6.25 / 10,000 pop.
Adult diabetes rate : This county :
9.7%State :
10.3%
Low-income preschool obesity rate : Health and Nutrition: Healthy diet rate : This city:
50.0%State:
50.4%
Average overall health of teeth and gums : People feeling badly about themselves : People not drinking alcohol at all : Average hours sleeping at night : General health condition : Average condition of hearing : More about Health and Nutrition of Xenia, OH Residents
Local government employment and payroll (March 2022)
Function
Full-time employees
Monthly full-time payroll
Average yearly full-time wage
Part-time employees
Monthly part-time payroll
Police Protection - Officers
43 $320,321 $89,392 0 $0 Firefighters
40 $331,890 $99,567 0 $0 Police - Other
28 $165,804 $71,059 0 $0 Judicial and Legal
17 $82,383 $58,153 2 $4,539 Financial Administration
14 $84,964 $72,826 0 $0 Water Supply
14 $75,762 $64,939 1 $3,401 Sewerage
14 $83,160 $71,280 0 $0 Streets and Highways
13 $77,531 $71,567 0 $0 Other Government Administration
12 $81,692 $81,692 8 $6,191 Parks and Recreation
6 $25,548 $51,096 0 $0 Correction
4 $19,953 $59,859 0 $0 Other and Unallocable
3 $14,537 $58,148 3 $4,462 Fire - Other
2 $19,838 $119,028 1 $542 Solid Waste Management
1 $4,809 $57,708 0 $0 Housing and Community Development (Local)
1 $6,087 $73,044 0 $0
Totals for Government
212 $1,394,278 $78,921 15 $19,135
Xenia government finances - Expenditure in 2021 (per resident):
Current Operations - General - Other: $23,015,000 ($898.60)
Sewerage: $4,275,000 ($166.91)Water Utilities: $3,956,000 ($154.46)Solid Waste Management: $2,542,000 ($99.25)Regular Highways: $2,429,000 ($94.84)Parks and Recreation: $516,000 ($20.15)Natural Resources - Other: $426,000 ($16.63)Housing and Community Development: $262,000 ($10.23)Parking Facilities: $86,000 ($3.36)General - Interest on Debt: $281,000 ($10.97)
Xenia government finances - Revenue in 2021 (per resident):
Charges - Sewerage: $5,417,000 ($211.50)
Solid Waste Management: $2,092,000 ($81.68)Parking Facilities: $61,000 ($2.38)Miscellaneous - General Revenue - Other: $5,867,000 ($229.07)
Interest Earnings: $141,000 ($5.51)Revenue - Water Utilities: $4,277,000 ($166.99)
State Intergovernmental - Other: $2,872,000 ($112.13)
Highways: $1,557,000 ($60.79)General Local Government Support: $1,142,000 ($44.59)Tax - Individual Income: $12,896,000 ($503.51)
Property: $1,518,000 ($59.27)Other License: $54,000 ($2.11)
Xenia government finances - Debt in 2021 (per resident):
Long Term Debt - Beginning Outstanding - Unspecified Public Purpose: $11,250,000 ($439.25)
Outstanding Unspecified Public Purpose: $9,925,000 ($387.51)Retired Unspecified Public Purpose: $1,325,000 ($51.73)
Xenia government finances - Cash and Securities in 2021 (per resident):
Bond Funds - Cash and Securities: $664,000 ($25.93)
Other Funds - Cash and Securities: $24,666,000 ($963.06)
9.10% of this county's 2021 resident taxpayers lived in other counties in 2020 ($59,043 average adjusted gross income )
Here:
9.10%Ohio average:
5.68%
0.10% of residents moved from foreign countries ($943 average AGI )Greene County:
0.10%Ohio average:
0.01%
Top counties from which taxpayers relocated into this county between 2020 and 2021:
9.30% of this county's 2020 resident taxpayers moved to other counties in 2021 ($61,898 average adjusted gross income )
Here:
9.30%Ohio average:
5.79%
0.09% of residents moved to foreign countries ($726 average AGI )Greene County:
0.09%Ohio average:
0.01%
Top counties to which taxpayers relocated from this county between 2020 and 2021:
Businesses in Xenia, OH
Name Count Name Count
AT&T 1 Lowe's 1 Ace Hardware 1 MasterBrand Cabinets 1 Advance Auto Parts 1 McDonald's 2 Applebee's 1 Nike 1 Arby's 1 Papa John's Pizza 1 AutoZone 1 Pizza Hut 1 Blockbuster 1 RadioShack 1 Burger King 1 Ramada 1 CVS 1 Rite Aid 1 Circle K 1 SONIC Drive-In 1 Cold Stone Creamery 1 T-Mobile 1 Cricket Wireless 2 Taco Bell 1 Domino's Pizza 1 Tim Hortons 1 FedEx 3 U-Haul 4 H&R Block 1 UPS 3 KFC 1 Verizon Wireless 2 Kmart 1 Walgreens 1 Knights Inn 1 Walmart 1 Kroger 1 Wendy's 1 Little Caesars Pizza 1 YMCA 1
Strongest AM radio stations in Xenia:
WGNZ (1110 AM; daytime; 2 kW; FAIRBORN, OH; Owner: L&D BROADCASTORS INC.)
WLW (700 AM; 50 kW; CINCINNATI, OH; Owner: JACOR BROADCASTING CORPORATION)
WBZI (1500 AM; daytime; 0 kW; XENIA, OH; Owner: TOWN AND COUNTRY BROADCASTING, INC.)
WHIO (1290 AM; 5 kW; DAYTON, OH; Owner: CXR HOLDINGS, INC.)
WONE (980 AM; 5 kW; DAYTON, OH; Owner: CITICASTERS LICENSES, L.P.)
WING (1410 AM; 5 kW; DAYTON, OH)
WTVN (610 AM; 50 kW; COLUMBUS, OH; Owner: CITICASTERS LICENSES, L.P.)
WSAI (1530 AM; 50 kW; CINCINNATI, OH; Owner: JACOR BROADCASTING CORPORATION)
WRFD (880 AM; daytime; 23 kW; COLUMBUS-WORTHINGTON, OH; Owner: SALEM MEDIA OF OHIO, INC.)
WDAO (1210 AM; daytime; 1 kW; DAYTON, OH; Owner: JOHNSON COMMUNICATIONS, INC.)
WHAS (840 AM; 50 kW; LOUISVILLE, KY; Owner: CLEAR CHANNEL BROADCASTING LICENSES, INC.)
WOWO (1190 AM; 50 kW; FORT WAYNE, IN; Owner: PATHFINDER COMMUNICATIONS CORPORATION)
WKFI (1090 AM; daytime; 1 kW; WILMINGTON, OH; Owner: SOUTHWEST OHIO BROADCAST SERVICES GENERAL PARTNERSHIP)
Strongest FM radio stations in Xenia:
WCSU-FM (88.9 FM; WILBERFORCE, OH; Owner: CENTRAL STATE UNIVERSITY)
WZLR (95.3 FM; XENIA, OH; Owner: CXR HOLDINGS, INC.)
WYSO (91.3 FM; YELLOW SPRINGS, OH; Owner: ANTIOCH UNIVERSITY)
WCDR-FM (90.3 FM; CEDARVILLE, OH; Owner: THE CEDARVILLE UNIVERSITY)
WHKO (99.1 FM; DAYTON, OH; Owner: CXR HOLDINGS, INC.)
WXEG (103.9 FM; BEAVERCREEK, OH; Owner: CITICASTERS LICENSES, L.P.)
WLQT (99.9 FM; KETTERING, OH; Owner: CITICASTERS LICENSES, L.P.)
WMMX (107.7 FM; DAYTON, OH; Owner: CITICASTERS LICENSES, L.P.)
WTUE (104.7 FM; DAYTON, OH; Owner: CITICASTERS LICENSES, L.P.)
WRVT (88.7 FM; RUTLAND, VT; Owner: VERMONT PUBLIC RADIO)
WRNB (92.1 FM; WEST CARROLLTON, OH; Owner: RADIO ONE OF DAYTON LICENSES, LLC)
WWSU (106.9 FM; FAIRBORN, OH; Owner: WRIGHT STATE UNIVERSITY)
WDHT (102.9 FM; SPRINGFIELD, OH; Owner: BLUE CHIP BROADCASTING LICENSES, LTD)
WFCJ (93.7 FM; MIAMISBURG, OH; Owner: MIAMI VALLEY CHRISTIAN BROADCASTING ASSOCIATION)
WEEC (100.7 FM; SPRINGFIELD, OH; Owner: WORLD EVENGELISTIC ENTERPRISE CORP.)
WYGY (96.5 FM; LEBANON, OH; Owner: WVAE LICO, INC.)
WPFB-FM (105.9 FM; MIDDLETOWN, OH; Owner: RADIO STATIONS WPAY/WPFB, INC.)
WQRP (89.5 FM; DAYTON, OH; Owner: WQRP FAMILY RADIO, INC.)
WMOJ (94.9 FM; FAIRFIELD, OH; Owner: WVAE LICO, INC.)
WCWT-FM (101.5 FM; CENTERVILLE, OH; Owner: CENTERVILLE CITY BOARD OF EDUCATION)
TV broadcast stations around Xenia:
WHIO-TV (Channel 7; DAYTON, OH; Owner: WHIO-TV HOLDINGS, INC.)
WDTN (Channel 2; DAYTON, OH; Owner: WDTN BROADCASTING, LLC)
WBDT (Channel 26; SPRINGFIELD, OH; Owner: ACME TV LICENSES OF OHIO, LLC)
WPTD (Channel 16; DAYTON, OH; Owner: GREATER DAYTON PUBLIC TV, INC.)
WKEF (Channel 22; DAYTON, OH; Owner: WKEF LICENSEE L.P.)
WRGT-TV (Channel 45; DAYTON, OH; Owner: WRGT LICENSEE, LLC)
W61DE (Channel 61; CINCINNATI, OH; Owner: TRINITY BROADCASTING NETWORK)
WWRD-LP (Channel 55; CENTERVILLE, OH; Owner: LIFE BROADCASTING NETWORK)
WRCX-LP (Channel 51; DAYTON, OH; Owner: ROSS COMMUNICATIONS, LTD.)
W47BC (Channel 47; SPRINGFIELD, OH; Owner: TRINITY BROADCASTING NETWORK)
WWHO (Channel 53; CHILLICOTHE, OH; Owner: UPN STATIONS GROUP INC.)
WKOI (Channel 43; RICHMOND, IN; Owner: TRINITY BROADCASTING OF INDIANA, INC.)
WPTO (Channel 14; OXFORD, OH; Owner: GREATER DAYTON PUBLIC TELEVISION, INC.)
National Bridge Inventory (NBI) Statistics 67 Number of bridges636ft / 194m Total length425,043 Total average daily traffic46,956 Total average daily truck traffic
New bridges - historical statistics
1 Before 1900 5 1900-1909 1 1920-1929 4 1940-1949 2 1950-1959 6 1960-1969 22 1970-1979 3 1980-1989 17 1990-1999 5 2000-2009 1 2020-2022
See full National Bridge Inventory statistics for Xenia, OH
Home Mortgage Disclosure Act Aggregated Statistics For Year 2009(Based on 6 partial tracts) A) FHA, FSA/RHS & VA B) Conventional C) Refinancings D) Home Improvement Loans F) Non-occupant Loans on G) Loans On Manufactured Number Average Value Number Average Value Number Average Value Number Average Value Number Average Value Number Average Value
LOANS ORIGINATED 90 $102,878 53 $97,533 254 $108,675 11 $41,600 29 $58,151 0 $0 APPLICATIONS APPROVED, NOT ACCEPTED 6 $117,185 5 $62,042 26 $123,454 2 $10,270 3 $93,067 0 $0 APPLICATIONS DENIED 7 $127,394 6 $99,110 94 $113,274 13 $20,163 7 $55,327 0 $0 APPLICATIONS WITHDRAWN 4 $100,748 4 $131,238 52 $107,837 3 $39,383 4 $84,825 1 $111,550 FILES CLOSED FOR INCOMPLETENESS 1 $63,730 4 $95,520 7 $102,214 0 $0 2 $47,585 0 $0
Aggregated Statistics For Year 2008(Based on 6 partial tracts) A) FHA, FSA/RHS & VA B) Conventional C) Refinancings D) Home Improvement Loans F) Non-occupant Loans on G) Loans On Manufactured Number Average Value Number Average Value Number Average Value Number Average Value Number Average Value Number Average Value
LOANS ORIGINATED 80 $119,313 89 $98,612 170 $103,510 27 $23,741 32 $67,583 0 $0 APPLICATIONS APPROVED, NOT ACCEPTED 4 $107,858 8 $74,962 26 $93,603 4 $25,725 2 $112,135 1 $8,830 APPLICATIONS DENIED 5 $104,674 12 $79,610 132 $98,103 27 $47,378 8 $79,856 1 $11,390 APPLICATIONS WITHDRAWN 6 $138,758 7 $87,493 75 $95,541 5 $82,744 6 $57,568 0 $0 FILES CLOSED FOR INCOMPLETENESS 0 $0 1 $25,680 6 $113,337 0 $0 1 $77,010 0 $0
Aggregated Statistics For Year 2007(Based on 6 partial tracts) A) FHA, FSA/RHS & VA B) Conventional C) Refinancings D) Home Improvement Loans E) Loans on Dwellings For 5+ Families F) Non-occupant Loans on G) Loans On Manufactured Number Average Value Number Average Value Number Average Value Number Average Value Number Average Value Number Average Value Number Average Value
LOANS ORIGINATED 50 $119,438 194 $98,157 183 $91,787 43 $25,554 1 $767,240 35 $71,874 0 $0 APPLICATIONS APPROVED, NOT ACCEPTED 1 $157,960 16 $96,262 45 $108,539 9 $23,281 0 $0 6 $63,637 0 $0 APPLICATIONS DENIED 4 $108,442 23 $120,448 206 $96,544 63 $37,621 0 $0 8 $69,888 2 $9,420 APPLICATIONS WITHDRAWN 7 $124,617 18 $124,276 80 $98,438 9 $32,710 0 $0 5 $82,308 0 $0 FILES CLOSED FOR INCOMPLETENESS 0 $0 2 $163,550 17 $126,740 1 $5,420 0 $0 2 $116,100 0 $0
Aggregated Statistics For Year 2006(Based on 6 partial tracts) A) FHA, FSA/RHS & VA B) Conventional C) Refinancings D) Home Improvement Loans E) Loans on Dwellings For 5+ Families F) Non-occupant Loans on G) Loans On Manufactured Number Average Value Number Average Value Number Average Value Number Average Value Number Average Value Number Average Value Number Average Value
LOANS ORIGINATED 69 $119,892 256 $87,293 246 $82,046 55 $33,060 1 $830,570 56 $67,256 1 $20,350 APPLICATIONS APPROVED, NOT ACCEPTED 5 $123,494 30 $84,075 54 $91,428 11 $34,743 0 $0 8 $57,992 1 $49,760 APPLICATIONS DENIED 7 $110,810 62 $84,049 234 $93,762 62 $29,815 0 $0 16 $72,432 3 $25,563 APPLICATIONS WITHDRAWN 7 $121,986 28 $84,875 120 $91,859 10 $52,768 0 $0 12 $72,032 1 $5,730 FILES CLOSED FOR INCOMPLETENESS 2 $62,565 10 $77,857 33 $94,570 2 $54,395 0 $0 2 $57,280 0 $0
Aggregated Statistics For Year 2005(Based on 6 partial tracts) A) FHA, FSA/RHS & VA B) Conventional C) Refinancings D) Home Improvement Loans E) Loans on Dwellings For 5+ Families F) Non-occupant Loans on G) Loans On Manufactured Number Average Value Number Average Value Number Average Value Number Average Value Number Average Value Number Average Value Number Average Value
LOANS ORIGINATED 47 $104,740 302 $86,185 352 $90,546 45 $32,831 2 $729,345 79 $65,271 0 $0 APPLICATIONS APPROVED, NOT ACCEPTED 2 $197,815 28 $86,737 61 $90,133 8 $41,638 0 $0 10 $65,767 1 $52,930 APPLICATIONS DENIED 8 $102,996 66 $87,178 334 $93,913 72 $24,641 0 $0 16 $64,511 3 $71,360 APPLICATIONS WITHDRAWN 3 $108,137 30 $97,951 138 $107,888 19 $89,279 1 $69,020 9 $57,913 1 $26,130 FILES CLOSED FOR INCOMPLETENESS 1 $109,970 5 $94,346 47 $99,166 6 $29,622 0 $0 2 $45,785 0 $0
Aggregated Statistics For Year 2004(Based on 6 partial tracts) A) FHA, FSA/RHS & VA B) Conventional C) Refinancings D) Home Improvement Loans F) Non-occupant Loans on G) Loans On Manufactured Number Average Value Number Average Value Number Average Value Number Average Value Number Average Value Number Average Value
LOANS ORIGINATED 59 $110,852 275 $87,619 387 $88,296 44 $33,347 78 $66,150 1 $18,270 APPLICATIONS APPROVED, NOT ACCEPTED 6 $109,315 29 $84,429 92 $89,658 10 $28,751 7 $86,191 0 $0 APPLICATIONS DENIED 9 $99,847 73 $87,577 289 $91,232 45 $35,540 14 $69,476 2 $53,735 APPLICATIONS WITHDRAWN 5 $98,158 18 $101,489 191 $94,073 8 $62,692 4 $62,948 1 $98,750 FILES CLOSED FOR INCOMPLETENESS 2 $97,505 10 $87,305 31 $86,163 3 $34,313 4 $77,760 0 $0
Aggregated Statistics For Year 2003(Based on 6 partial tracts) A) FHA, FSA/RHS & VA B) Conventional C) Refinancings D) Home Improvement Loans E) Loans on Dwellings For 5+ Families F) Non-occupant Loans on Number Average Value Number Average Value Number Average Value Number Average Value Number Average Value Number Average Value
LOANS ORIGINATED 81 $106,013 228 $89,744 730 $85,998 44 $17,360 1 $210,990 98 $62,141 APPLICATIONS APPROVED, NOT ACCEPTED 2 $106,870 17 $85,999 111 $83,927 11 $16,006 0 $0 11 $64,957 APPLICATIONS DENIED 8 $95,918 28 $75,584 280 $85,365 48 $13,303 0 $0 15 $62,816 APPLICATIONS WITHDRAWN 3 $84,317 16 $88,259 201 $88,040 6 $23,523 0 $0 4 $77,992 FILES CLOSED FOR INCOMPLETENESS 2 $102,320 7 $96,621 43 $91,821 1 $54,570 0 $0 3 $78,483
Aggregated Statistics For Year 2002(Based on 6 partial tracts) A) FHA, FSA/RHS & VA B) Conventional C) Refinancings D) Home Improvement Loans E) Loans on Dwellings For 5+ Families F) Non-occupant Loans on Number Average Value Number Average Value Number Average Value Number Average Value Number Average Value Number Average Value
LOANS ORIGINATED 82 $97,840 175 $84,215 515 $85,179 57 $15,475 1 $961,500 69 $60,258 APPLICATIONS APPROVED, NOT ACCEPTED 3 $106,737 17 $82,106 120 $81,764 15 $13,287 0 $0 6 $57,525 APPLICATIONS DENIED 14 $101,301 21 $79,763 280 $80,571 32 $9,219 0 $0 6 $55,493 APPLICATIONS WITHDRAWN 5 $99,944 15 $86,436 175 $87,796 6 $25,895 0 $0 4 $60,572 FILES CLOSED FOR INCOMPLETENESS 2 $99,225 3 $89,357 40 $87,771 0 $0 0 $0 2 $69,440
Aggregated Statistics For Year 2001(Based on 6 partial tracts) A) FHA, FSA/RHS & VA B) Conventional C) Refinancings D) Home Improvement Loans F) Non-occupant Loans on Number Average Value Number Average Value Number Average Value Number Average Value Number Average Value
LOANS ORIGINATED 137 $99,525 167 $83,905 476 $78,765 61 $14,136 53 $54,538 APPLICATIONS APPROVED, NOT ACCEPTED 2 $131,905 12 $87,087 123 $80,993 16 $9,562 7 $41,769 APPLICATIONS DENIED 9 $99,676 25 $64,892 283 $73,311 73 $12,096 10 $54,616 APPLICATIONS WITHDRAWN 1 $114,670 17 $82,828 169 $78,833 9 $32,130 5 $66,430 FILES CLOSED FOR INCOMPLETENESS 2 $52,280 1 $51,960 38 $81,641 2 $25,350 2 $50,705
Aggregated Statistics For Year 2000(Based on 6 partial tracts) A) FHA, FSA/RHS & VA B) Conventional C) Refinancings D) Home Improvement Loans F) Non-occupant Loans on Number Average Value Number Average Value Number Average Value Number Average Value Number Average Value
LOANS ORIGINATED 141 $93,233 140 $78,078 195 $59,283 81 $13,951 33 $46,574 APPLICATIONS APPROVED, NOT ACCEPTED 6 $94,578 10 $50,358 75 $72,001 29 $14,268 3 $53,727 APPLICATIONS DENIED 9 $109,978 28 $82,659 185 $71,135 88 $14,605 5 $40,212 APPLICATIONS WITHDRAWN 4 $71,182 13 $67,649 91 $62,171 10 $16,403 2 $66,725 FILES CLOSED FOR INCOMPLETENESS 1 $73,160 5 $65,216 35 $73,133 1 $5,620 2 $54,375
Aggregated Statistics For Year 1999(Based on 6 partial tracts) A) FHA, FSA/RHS & VA B) Conventional C) Refinancings D) Home Improvement Loans F) Non-occupant Loans on Number Average Value Number Average Value Number Average Value Number Average Value Number Average Value
LOANS ORIGINATED 124 $83,398 161 $82,511 317 $63,959 90 $13,659 45 $57,934 APPLICATIONS APPROVED, NOT ACCEPTED 8 $73,831 16 $99,252 120 $69,111 22 $12,822 8 $44,171 APPLICATIONS DENIED 9 $81,588 36 $57,263 218 $62,477 80 $10,005 4 $67,422 APPLICATIONS WITHDRAWN 4 $79,352 15 $86,557 131 $63,462 13 $21,273 3 $56,627 FILES CLOSED FOR INCOMPLETENESS 1 $56,900 5 $60,138 44 $67,638 0 $0 1 $77,110
Detailed HMDA statistics for the following Tracts:
2401.00
, 2402.00 , 2403.01 , 2403.02 , 2405.00 , 2407.00
Private Mortgage Insurance Companies Aggregated Statistics For Year 2009(Based on 6 partial tracts) A) Conventional B) Refinancings C) Non-occupant Loans on Number Average Value Number Average Value Number Average Value
LOANS ORIGINATED 14 $108,280 13 $113,835 1 $50,560 APPLICATIONS APPROVED, NOT ACCEPTED 2 $96,370 5 $106,926 0 $0 APPLICATIONS DENIED 3 $186,960 2 $165,680 0 $0 APPLICATIONS WITHDRAWN 1 $122,180 1 $115,560 0 $0 FILES CLOSED FOR INCOMPLETENESS 0 $0 0 $0 0 $0
Aggregated Statistics For Year 2008(Based on 6 partial tracts) A) Conventional B) Refinancings C) Non-occupant Loans on Number Average Value Number Average Value Number Average Value
LOANS ORIGINATED 39 $101,618 15 $108,001 5 $53,764 APPLICATIONS APPROVED, NOT ACCEPTED 7 $106,350 11 $123,795 1 $63,040 APPLICATIONS DENIED 4 $98,580 1 $69,830 1 $62,170 APPLICATIONS WITHDRAWN 1 $63,140 1 $125,230 1 $35,430 FILES CLOSED FOR INCOMPLETENESS 0 $0 2 $72,075 1 $89,880
Aggregated Statistics For Year 2007(Based on 6 partial tracts) A) Conventional B) Refinancings C) Non-occupant Loans on Number Average Value Number Average Value Number Average Value
LOANS ORIGINATED 91 $104,940 29 $111,099 7 $71,366 APPLICATIONS APPROVED, NOT ACCEPTED 7 $119,750 6 $87,665 3 $49,743 APPLICATIONS DENIED 0 $0 2 $83,460 0 $0 APPLICATIONS WITHDRAWN 4 $118,332 3 $84,943 1 $67,610 FILES CLOSED FOR INCOMPLETENESS 1 $58,800 0 $0 0 $0
Aggregated Statistics For Year 2006(Based on 6 partial tracts) A) Conventional B) Refinancings C) Non-occupant Loans on Number Average Value Number Average Value Number Average Value
LOANS ORIGINATED 61 $94,443 24 $103,700 16 $72,506 APPLICATIONS APPROVED, NOT ACCEPTED 6 $141,087 11 $93,428 4 $60,498 APPLICATIONS DENIED 0 $0 0 $0 0 $0 APPLICATIONS WITHDRAWN 3 $159,543 3 $124,000 1 $63,400 FILES CLOSED FOR INCOMPLETENESS 0 $0 1 $61,060 0 $0
Aggregated Statistics For Year 2005(Based on 6 partial tracts) A) Conventional B) Refinancings C) Non-occupant Loans on Number Average Value Number Average Value Number Average Value
LOANS ORIGINATED 69 $92,632 34 $108,222 23 $72,379 APPLICATIONS APPROVED, NOT ACCEPTED 12 $127,276 17 $95,953 3 $65,690 APPLICATIONS DENIED 3 $79,283 0 $0 3 $79,283 APPLICATIONS WITHDRAWN 5 $119,748 4 $90,800 1 $102,560 FILES CLOSED FOR INCOMPLETENESS 0 $0 2 $124,845 0 $0
Aggregated Statistics For Year 2004(Based on 6 partial tracts) A) Conventional B) Refinancings C) Non-occupant Loans on Number Average Value Number Average Value Number Average Value
LOANS ORIGINATED 58 $100,749 47 $108,081 21 $71,789 APPLICATIONS APPROVED, NOT ACCEPTED 5 $126,912 24 $95,501 2 $150,055 APPLICATIONS DENIED 0 $0 2 $67,250 0 $0 APPLICATIONS WITHDRAWN 1 $317,230 6 $95,852 0 $0 FILES CLOSED FOR INCOMPLETENESS 0 $0 2 $108,360 0 $0
Aggregated Statistics For Year 2003(Based on 6 partial tracts) A) Conventional B) Refinancings C) Non-occupant Loans on Number Average Value Number Average Value Number Average Value
LOANS ORIGINATED 58 $98,929 97 $95,102 22 $64,815 APPLICATIONS APPROVED, NOT ACCEPTED 11 $129,843 33 $111,670 3 $64,470 APPLICATIONS DENIED 2 $39,575 2 $124,460 3 $57,293 APPLICATIONS WITHDRAWN 1 $170,330 7 $98,384 1 $41,460 FILES CLOSED FOR INCOMPLETENESS 0 $0 1 $104,330 0 $0
Aggregated Statistics For Year 2002(Based on 6 partial tracts) A) Conventional B) Refinancings C) Non-occupant Loans on Number Average Value Number Average Value Number Average Value
LOANS ORIGINATED 47 $100,707 81 $103,959 13 $63,713 APPLICATIONS APPROVED, NOT ACCEPTED 11 $87,226 24 $107,002 3 $89,367 APPLICATIONS DENIED 0 $0 3 $104,593 1 $90,680 APPLICATIONS WITHDRAWN 2 $102,900 10 $114,972 2 $67,570 FILES CLOSED FOR INCOMPLETENESS 2 $165,555 0 $0 0 $0
Aggregated Statistics For Year 2001(Based on 6 partial tracts) A) Conventional B) Refinancings C) Non-occupant Loans on Number Average Value Number Average Value Number Average Value
LOANS ORIGINATED 55 $94,958 54 $95,135 13 $63,198 APPLICATIONS APPROVED, NOT ACCEPTED 10 $91,252 13 $109,989 1 $63,660 APPLICATIONS DENIED 1 $87,420 1 $73,670 1 $87,420 APPLICATIONS WITHDRAWN 0 $0 3 $124,370 0 $0 FILES CLOSED FOR INCOMPLETENESS 0 $0 1 $92,250 0 $0
Aggregated Statistics For Year 2000(Based on 6 partial tracts) A) Conventional B) Refinancings C) Non-occupant Loans on Number Average Value Number Average Value Number Average Value
LOANS ORIGINATED 53 $87,551 14 $87,679 7 $58,424 APPLICATIONS APPROVED, NOT ACCEPTED 5 $92,774 3 $74,903 1 $60,170 APPLICATIONS DENIED 0 $0 1 $111,870 0 $0 APPLICATIONS WITHDRAWN 0 $0 0 $0 0 $0 FILES CLOSED FOR INCOMPLETENESS 0 $0 0 $0 0 $0
Aggregated Statistics For Year 1999(Based on 6 partial tracts) A) Conventional B) Refinancings C) Non-occupant Loans on Number Average Value Number Average Value Number Average Value
LOANS ORIGINATED 53 $90,316 33 $86,121 9 $61,602 APPLICATIONS APPROVED, NOT ACCEPTED 6 $102,007 7 $83,936 1 $55,210 APPLICATIONS DENIED 2 $61,000 2 $95,115 1 $79,270 APPLICATIONS WITHDRAWN 1 $64,100 1 $80,100 0 $0 FILES CLOSED FOR INCOMPLETENESS 0 $0 0 $0 0 $0
Detailed PMIC statistics for the following Tracts:
2401.00
, 2402.00 , 2403.01 , 2403.02 , 2405.00 , 2407.00 Fire-safe hotels and motels in Xenia, Ohio:
Allengate, 38 S Allison Ave, Xenia, Ohio 45385 Phone: (513) 435-9905
Ramada Xenia, 300 Xenia Towne Sq, Xenia, Ohio 45385 Phone: (937) 372-9921, Fax: (937) 372-9438
Hampton Inn & Suites Xenia Dayton, 194 S Progress Dr, Xenia, Ohio 45385 Phone: (800) 426-7866
All 3 fire-safe hotels and motels in Xenia, Ohio
Most common first names in Xenia, OH among deceased individuals Name Count Lived (average)
Mary 344 78.3 years John 245 73.3 years William 240 75.0 years Robert 236 70.9 years James 223 70.4 years Charles 194 73.9 years Helen 134 79.3 years Donald 116 67.5 years Ruth 115 79.5 years Dorothy 108 77.5 years
Most common last names in Xenia, OH among deceased individuals Last name Count Lived (average)
Smith 129 74.7 years Johnson 113 75.6 years Jones 78 75.4 years Miller 70 75.2 years Brown 68 71.7 years Davis 63 74.8 years Anderson 62 76.2 years Shaw 52 75.5 years Moore 52 77.8 years Williams 48 70.7 years
Xenia compared to Ohio state average:
Unemployed percentage below state average. Foreign-born population percentage below state average. Length of stay since moving in above state average.
Top Patent Applicants
Brad Smith (15)
David F. Tunmore (8)
Randy Dae Vandagriff (7)
Randy D. Vandagriff (7)
Richard H. Harris (7)
Joel James Everhart (6)
Michael E. Miller (5)
Kerry L. Spiker (4)
Michael W. Goldenbogen (4)
Anil R. Chaudhry (4)
Total of 139 patent applications in 2008-2024.
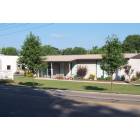
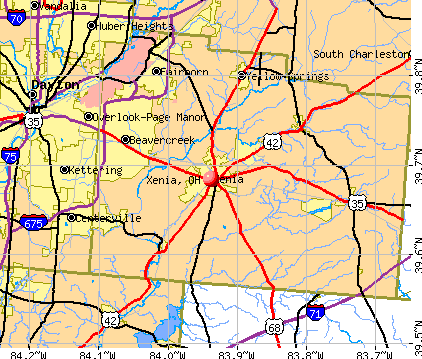


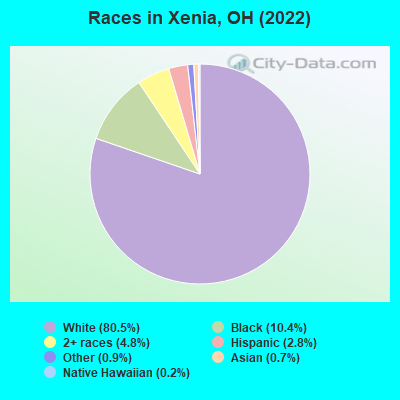
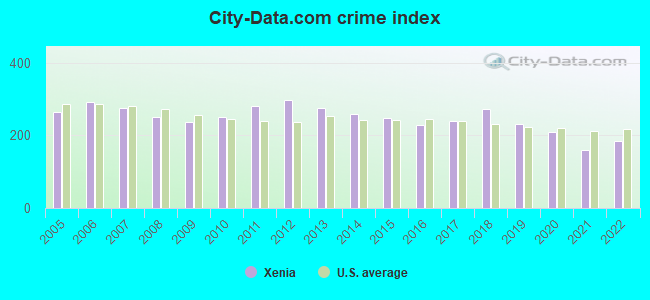
 Recent articles from our blog. Our writers, many of them Ph.D. graduates or candidates, create easy-to-read articles on a wide variety of topics.

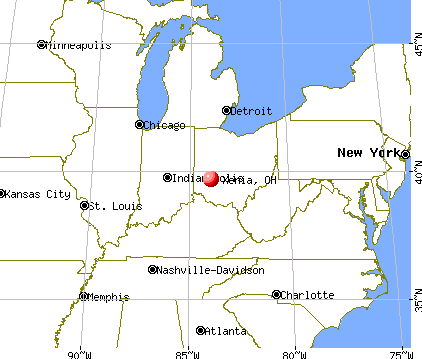
 (11.4 miles
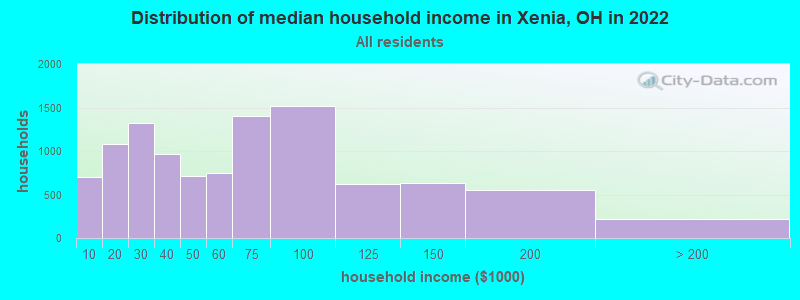
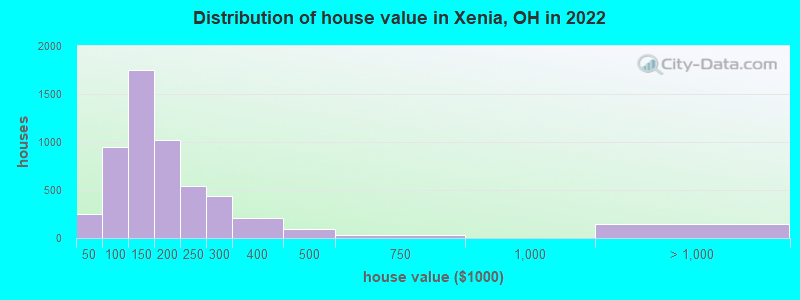
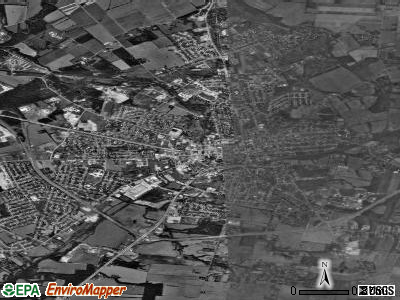
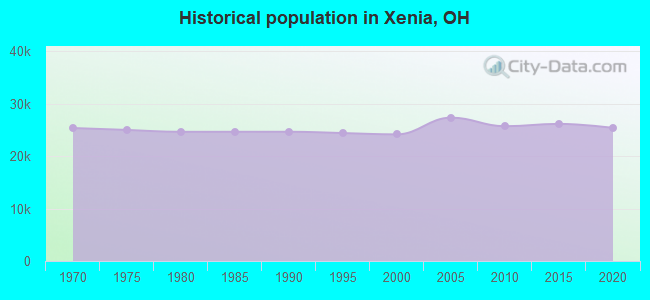
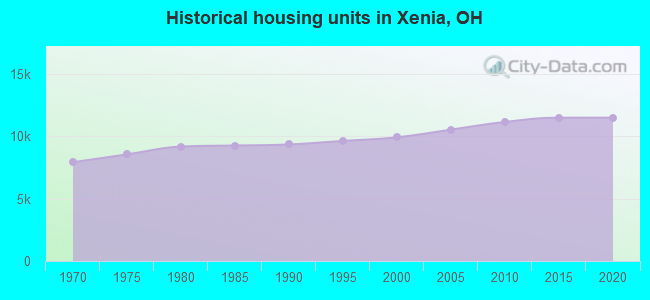
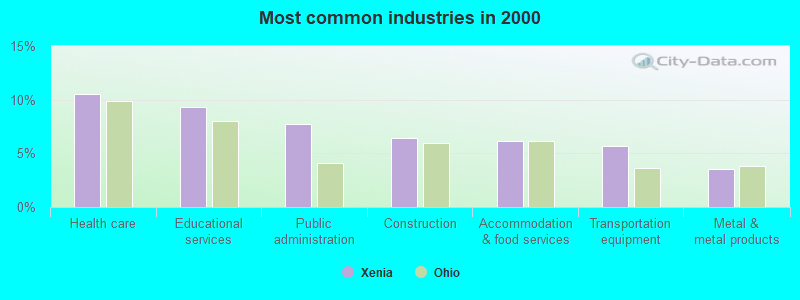
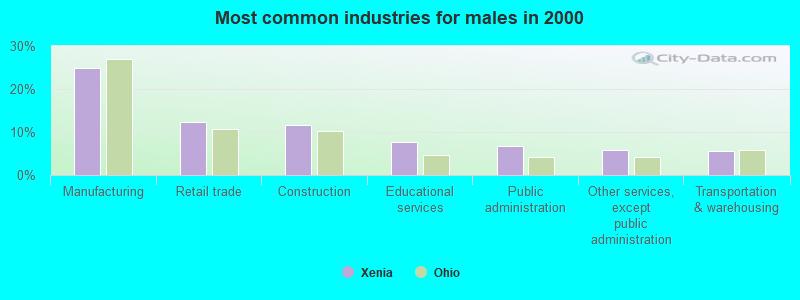
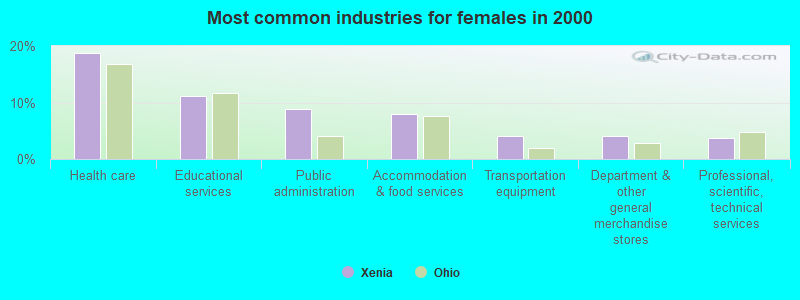
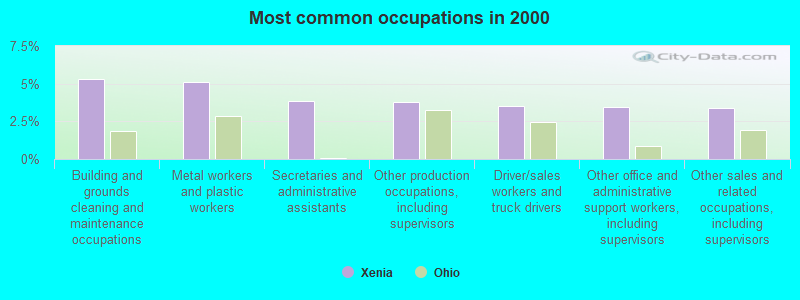
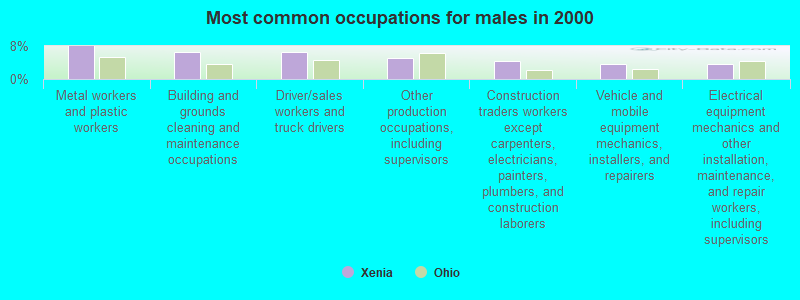
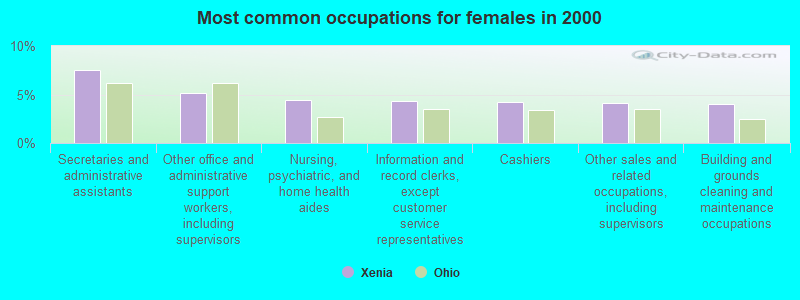


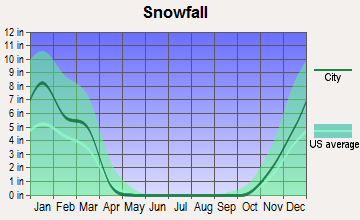


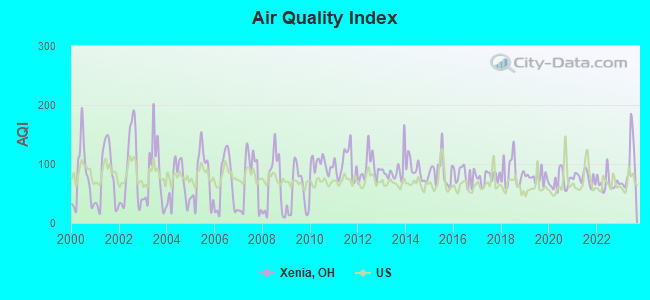
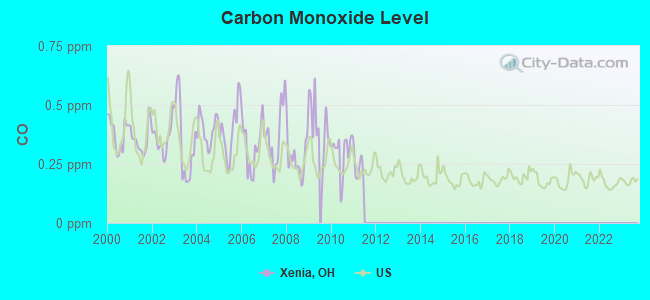
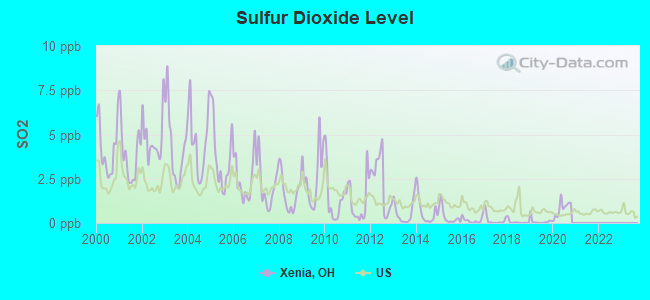
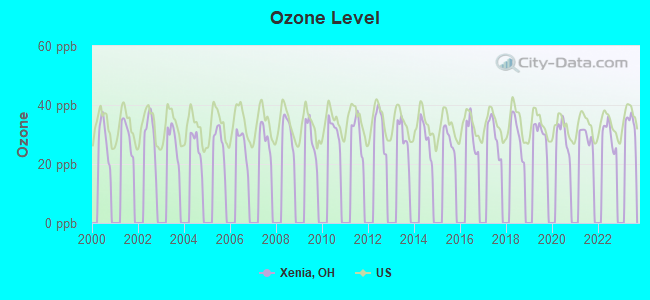
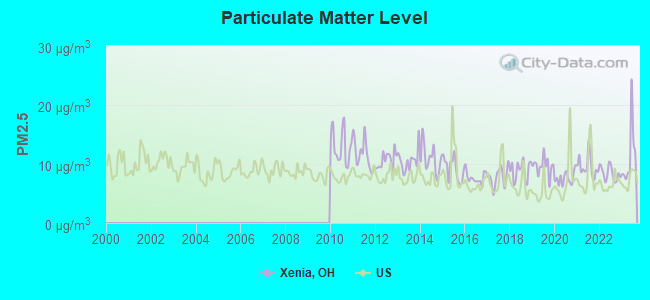

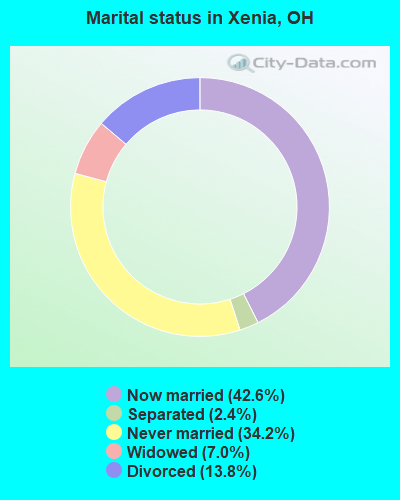
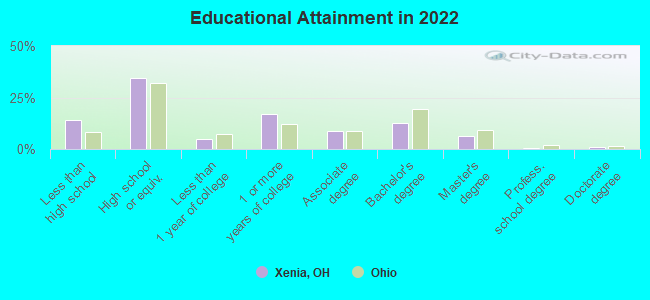
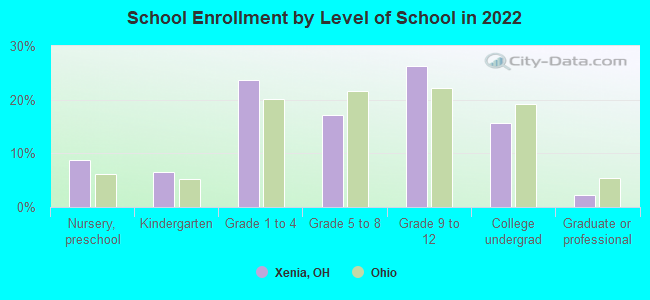
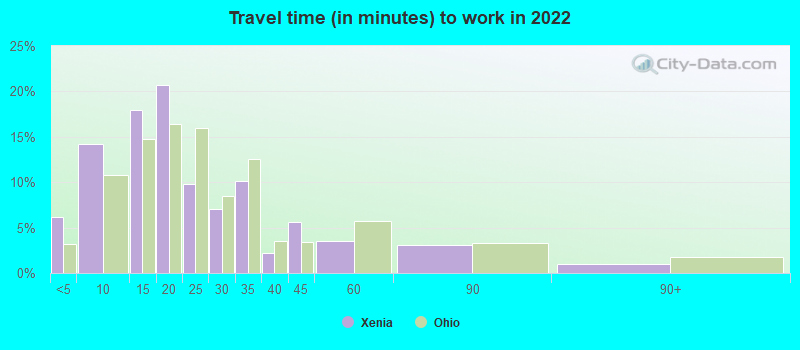
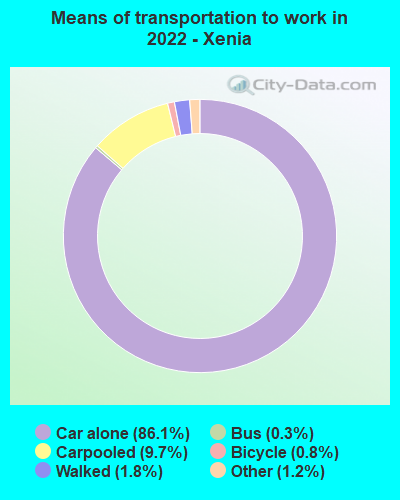
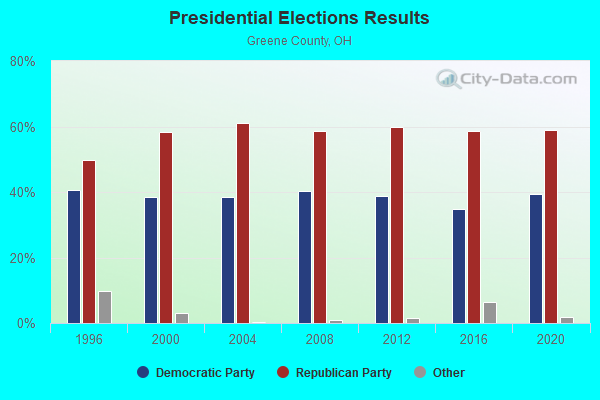
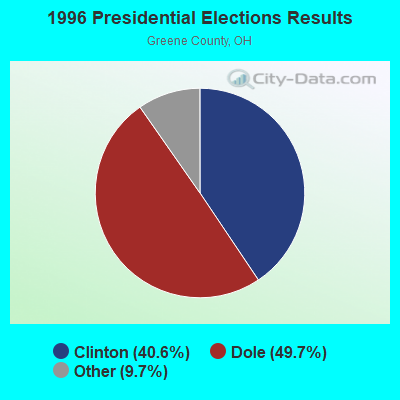
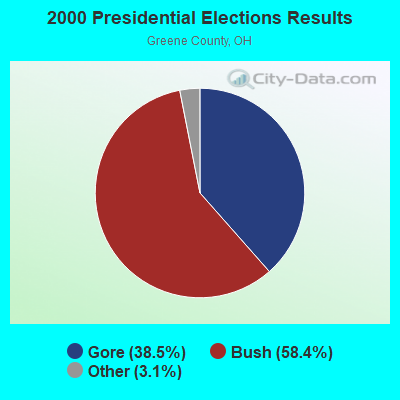
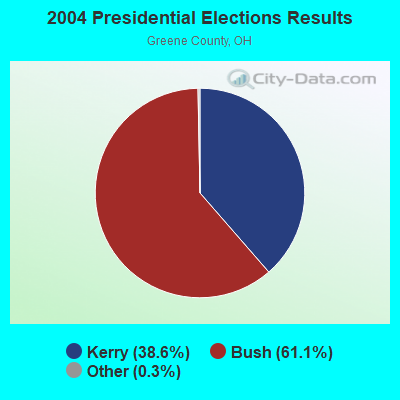
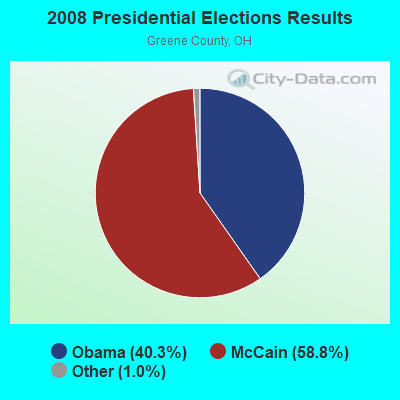
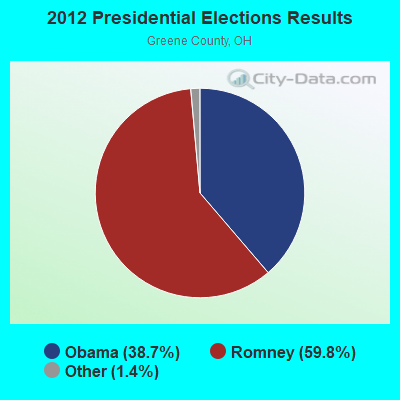
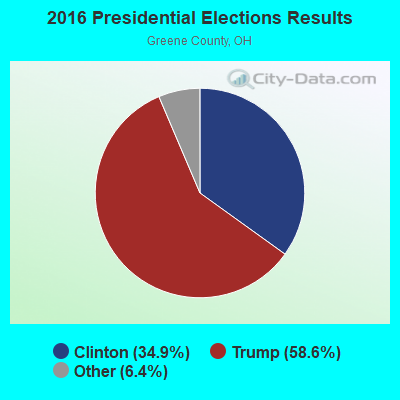
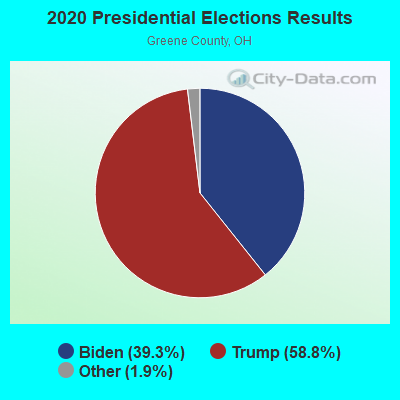
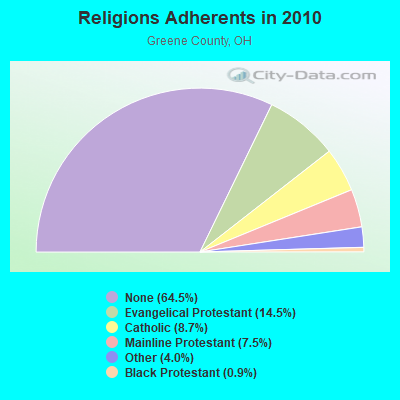
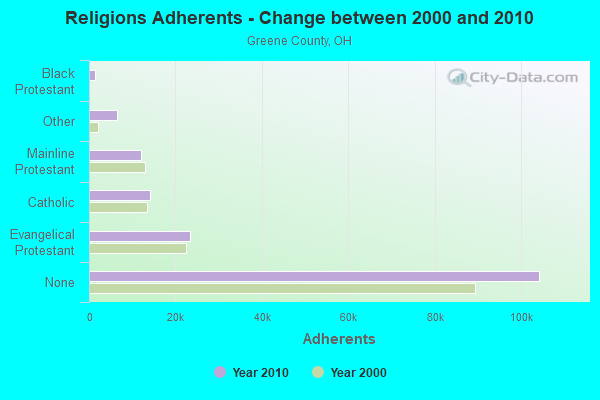
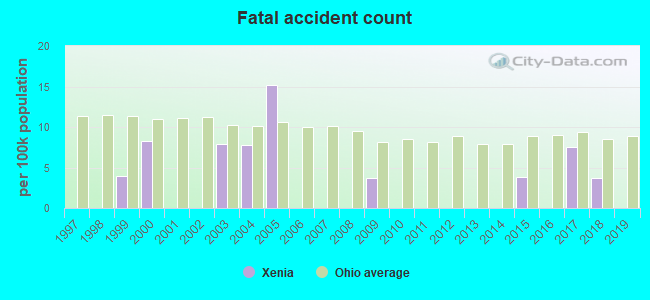
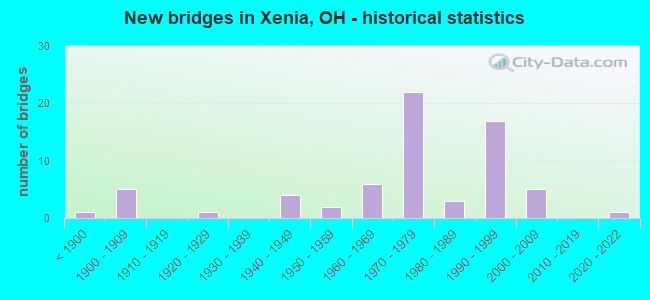
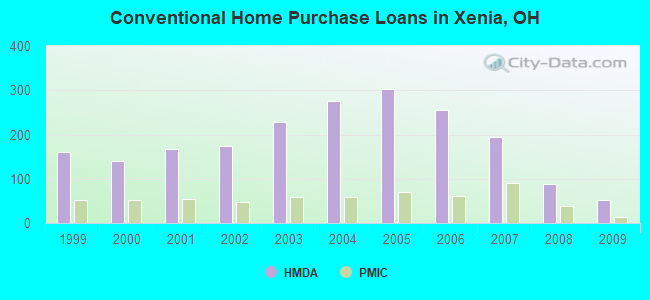
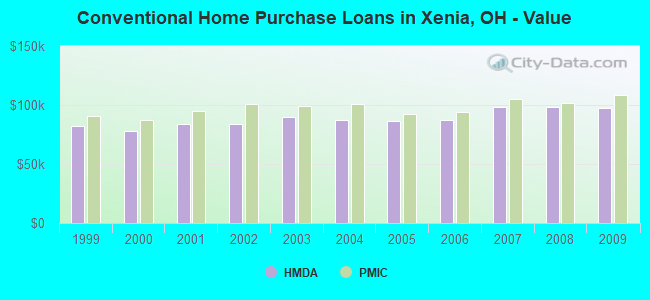
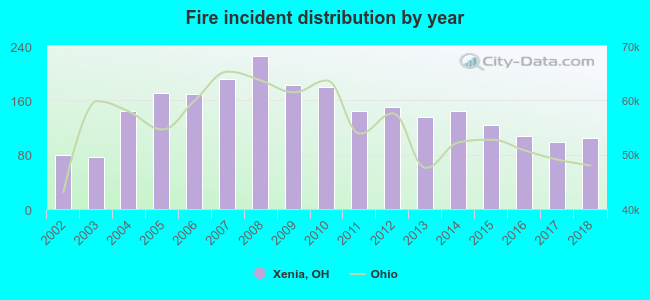 According to the data from the years 2002 - 2018 the average number of fire incidents per year is 143. The highest number of fires - 225 took place in 2008, and the least - 76 in 2003. The data has a rising trend.
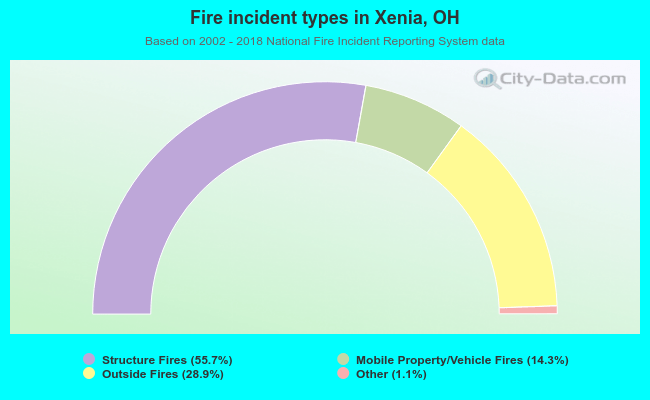 When looking into fire subcategories, the most incidents belonged to: Structure Fires (55.7%), and Outside Fires (28.9%).