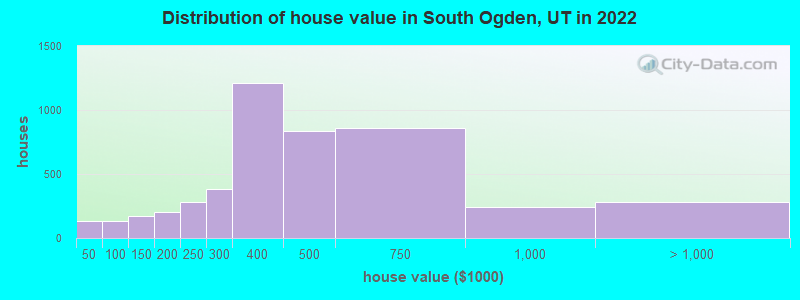
Estimated median house or condo value in 2022: $403,742 (it was $134,300 in 2000)
South Ogden:
$403,742
UT:
$499,500
Mean prices in 2022:all housing units: $489,906; detached houses: $518,555; townhouses or other attached units: $367,378; in 2-unit structures: $372,281; in 3-to-4-unit structures: $252,139; in 5-or-more-unit structures: $197,854; mobile homes: $72,035
Median gross rent in 2022: $1,265.
March 2022 cost of living index in South Ogden: 88.2 (less than average, U.S. average is 100)
Percentage of residents living in poverty in 2022: 7.6%
(8.5% for White Non-Hispanic residents, 18.0% for Black residents, 2.4% for Hispanic or Latino residents, 24.3% for American Indian residents, 1.8% for other race residents, 2.6% for two or more races residents)
According to our research of Utah and other state lists, there were 26 registered sex offenders living in South Ogden, Utah as of June 04, 2024. The ratio of all residents to sex offenders in South Ogden is 667 to 1. The ratio of registered sex offenders to all residents in this city is lower than the state average.
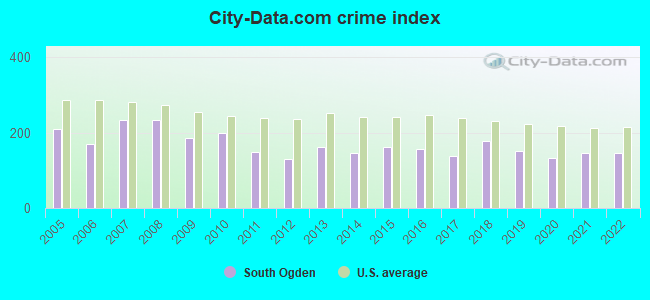
Crime rates in South Ogden by year
Type
2009
2010
2011
2012
2013
2014
2015
2016
2017
2018
2019
2020
2021
2022
Murders (per 100,000)
0 (0.0)
0 (0.0)
0 (0.0)
0 (0.0)
0 (0.0)
0 (0.0)
0 (0.0)
0 (0.0)
0 (0.0)
1 (5.8)
0 (0.0)
0 (0.0)
0 (0.0)
0 (0.0)
Rapes (per 100,000)
5 (31.3)
8 (48.4)
5 (29.7)
5 (29.4)
9 (53.6)
9 (53.4)
12 (70.9)
9 (52.9)
6 (34.9)
12 (69.9)
14 (81.3)
8 (46.3)
9 (52.4)
12 (68.2)
Robberies (per 100,000)
6 (37.5)
5 (30.2)
5 (29.7)
2 (11.8)
3 (17.9)
4 (23.7)
1 (5.9)
4 (23.5)
4 (23.3)
3 (17.5)
1 (5.8)
1 (5.8)
2 (11.6)
7 (39.8)
Assaults (per 100,000)
28 (175.1)
15 (90.7)
8 (47.5)
6 (35.3)
12 (71.5)
11 (65.3)
14 (82.7)
8 (47.0)
9 (52.4)
9 (52.4)
10 (58.1)
15 (86.9)
17 (98.9)
17 (96.7)
Burglaries (per 100,000)
76 (475.3)
105 (635.1)
85 (504.4)
100 (588.7)
78 (464.5)
52 (308.7)
56 (330.9)
65 (381.8)
52 (302.7)
80 (465.8)
30 (174.3)
44 (254.8)
50 (290.9)
35 (199.0)
Thefts (per 100,000)
297 (1,858)
327 (1,978)
268 (1,590)
208 (1,225)
249 (1,483)
221 (1,312)
232 (1,371)
231 (1,357)
235 (1,368)
226 (1,316)
200 (1,162)
190 (1,100)
207 (1,204)
142 (807.5)
Auto thefts (per 100,000)
14 (87.6)
19 (114.9)
14 (83.1)
12 (70.6)
17 (101.2)
22 (130.6)
19 (112.3)
35 (205.6)
36 (209.6)
23 (133.9)
33 (191.7)
31 (179.5)
27 (157.1)
28 (159.2)
Arson (per 100,000)
4 (25.0)
3 (18.1)
1 (5.9)
1 (5.9)
0 (0.0)
0 (0.0)
0 (0.0)
0 (0.0)
1 (5.8)
2 (11.6)
0 (0.0)
0 (0.0)
0 (0.0)
1 (5.7)
City-Data.com crime index
185.9
198.7
147.7
130.0
162.5
147.5
162.0
156.2
138.1
179.2
152.4
132.4
146.3
144.8
The City-Data.com crime index weighs serious crimes and violent crimes more heavily. Higher means more crime, U.S. average is 246.1. It adjusts for the number of visitors and daily workers commuting into cities.
Latest news from South Ogden, UT collected exclusively by city-data.com from local newspapers, TV, and radio stations
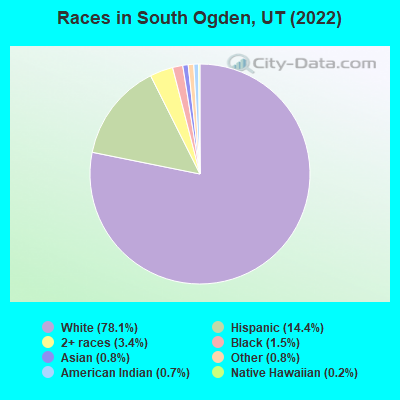
Ancestries: English (17.4%), American (10.0%), European (8.3%), Irish (6.2%), German (5.7%), Danish (3.6%).
Current Local Time: MST time zone
Incorporated on 06/07/1936
Elevation: 4300 feet
Land area: 3.67 square miles.
Population density: 4,827 people per square mile (average).
1,136 residents are foreign born (2.8% Latin America, 1.7% Asia, 1.3% Europe).
This city:
6.3%
Utah:
8.4%
Median real estate property taxes paid for housing units with mortgages in 2022: $2,312 (0.6%) Median real estate property taxes paid for housing units with no mortgage in 2022: $2,697 (0.7%)
Nearest city with pop. 50,000+: Ogden, UT (3.7 miles , pop. 77,226).
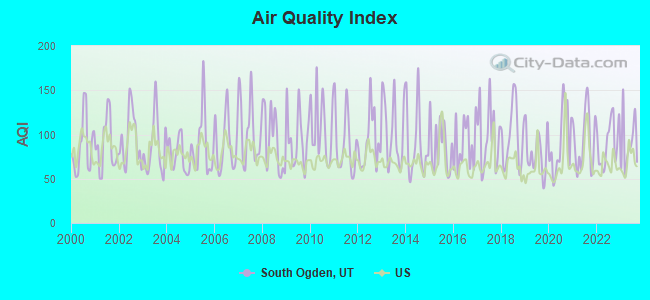
Air Quality Index (AQI) level in 2023 was 89.8. This is worse than average.
City:
89.8
U.S.:
72.6
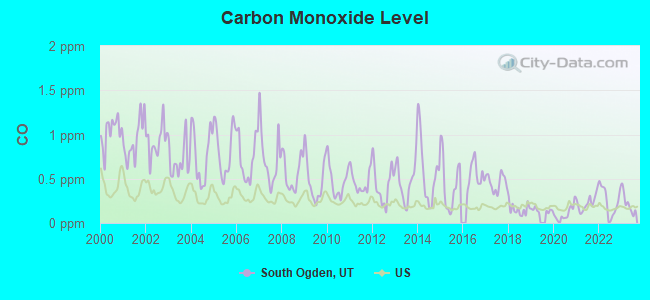
Carbon Monoxide (CO) [ppm] level in 2023 was 0.219. This is about average.Closest monitor was 1.4 miles away from the city center.
City:
0.219
U.S.:
0.251
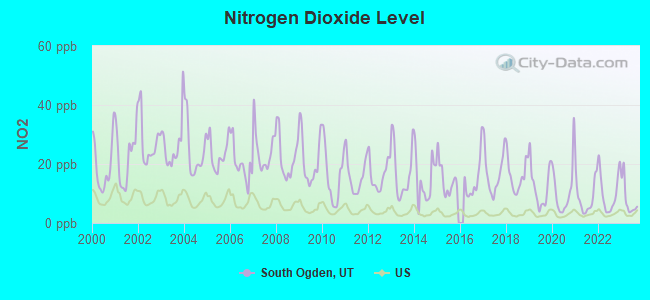
Nitrogen Dioxide (NO2) [ppb] level in 2023 was 7.94. This is significantly worse than average.Closest monitor was 1.7 miles away from the city center.
City:
7.94
U.S.:
5.11
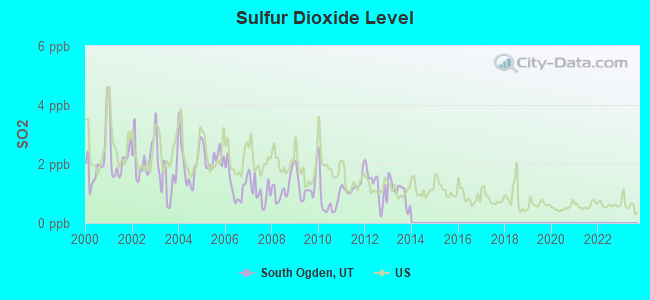
Sulfur Dioxide (SO2) [ppb] level in 2013 was 1.07. This is significantly better than average.Closest monitor was 3.2 miles away from the city center.
City:
1.07
U.S.:
1.51
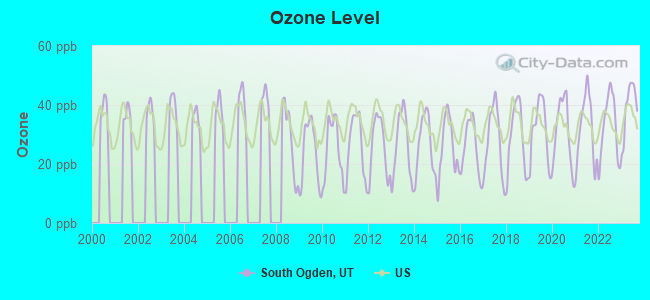
Ozone [ppb] level in 2023 was 39.2. This is about average.Closest monitor was 1.4 miles away from the city center.
City:
39.2
U.S.:
33.3
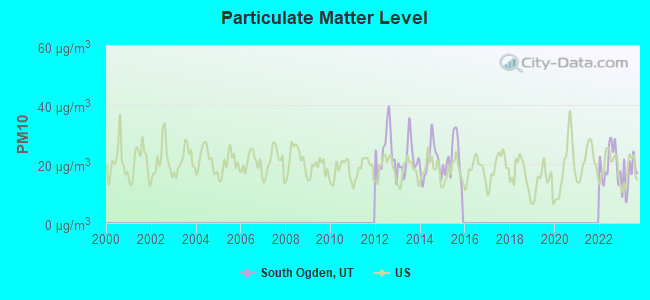
Particulate Matter (PM10) [µg/m3] level in 2023 was 16.2. This is about average.Closest monitor was 1.4 miles away from the city center.
City:
16.2
U.S.:
19.2
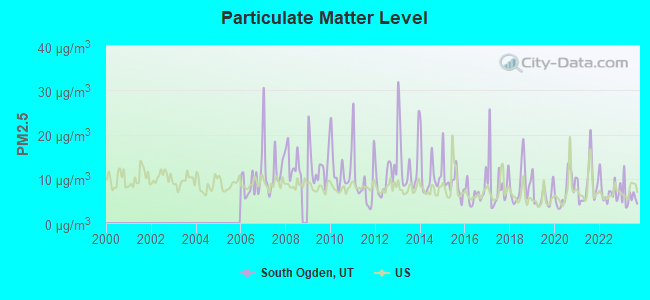
Particulate Matter (PM2.5) [µg/m3] level in 2023 was 6.01. This is better than average.Closest monitor was 1.4 miles away from the city center.
City:
6.01
U.S.:
8.11
Earthquake activity:
South Ogden-area historical earthquake activity is significantly above Utah state average. It is 2108% greater than the overall U.S. average.
On 8/18/1959 at 06:37:13, a magnitude 7.7 (7.7 UK, Class: Major, Intensity: VIII - XII) earthquake occurred 243.7 miles away from South Ogden center, causing $26,000,000 total damage On 10/28/1983 at 14:06:06, a magnitude 7.3 (6.2 MB, 7.3 MS, 7.0 MW) earthquake occurred 221.6 miles away from South Ogden center, causing 2 deaths (2 shaking deaths) and 3 injuries, causing $15,000,000 total damage On 10/3/1915 at 06:52:48, a magnitude 7.6 (7.6 UK) earthquake occurred 293.7 miles away from South Ogden center On 3/28/1975 at 02:31:05, a magnitude 6.2 (6.1 MB, 6.0 MS, 6.2 ML, Class: Strong, Intensity: VII - IX) earthquake occurred 63.8 miles away from the city center On 3/18/2020 at 13:09:31, a magnitude 5.7 (5.7 MW, Depth: 7.4 mi, Class: Moderate, Intensity: VI - VII) earthquake occurred 30.0 miles away from the city center On 12/21/1932 at 06:10:09, a magnitude 7.2 (7.2 UK) earthquake occurred 373.8 miles away from South Ogden center Magnitude types: body-wave magnitude (MB), local magnitude (ML), surface-wave magnitude (MS), moment magnitude (MW)
Natural disasters:
The number of natural disasters in Weber County (8) is smaller than the US average (15). Major Disasters (Presidential) Declared: 4 Emergencies Declared: 2
Causes of natural disasters: Floods: 4, Landslides: 2, Storms: 2, Drought: 1, Fire: 1, Heavy Rain: 1, Hurricane: 1, Mudslide: 1, Snow: 1, Other: 1 (Note: some incidents may be assigned to more than one category).
Hospitals and medical centers in South Ogden:
HEARTS FOR HOME HEALTH (942 CHAMBERS STREET)
PEREGRINE HOME HEALTH (930 CHAMBERS STREET, SUITE 2)
Other hospitals and medical centers near South Ogden:
LIBERTY DIALYSIS - OGDEN (Dialysis Facility, about 1 miles away; OGDEN, UT)
HEARTS FOR HOSPICE - OGDEN (Hospital, about 1 miles away; OGDEN, UT)
MCKAY DEE HOSPITAL CENTER Acute Care Hospitals (about 1 miles away; OGDEN, UT)
MCKAY-DEE HOSPITAL TRANSITIONAL CARE CENTER (Nursing Home, about 1 miles away; OGDEN, UT)
VISTA HOSPICE CARE, INC DBA VISTACARE (Hospital, about 1 miles away; OGDEN, UT)
BURCH CREEK HOMECARE (Home Health Center, about 1 miles away; OGDEN, UT)
WASHINGTON TERRACE CARE AND REHABILITATION CENTER (Nursing Home, about 1 miles away; OGDEN, UT)
Notable locations in South Ogden: Meadows Professional Plaza Condominiums (A), Boy Scouts of America Headquarters (B), South Ogden Fire Department Station 81 (C), South Ogden Fire Department Station 82 (D). Display/hide their locations on the map
Churches in South Ogden include: Greek Orthodox Church of Transfiguration (A), The Church of Jesus Christ of Latter Day Saints (B). Display/hide their locations on the map
Weber County has a predicted average indoor radon screening level between 2 and 4 pCi/L (pico curies per liter) - Moderate Potential
Drinking water stations with addresses in South Ogden and their reported violations in the past:
SUNRIDGE (Population served: 400, Groundwater):
Past health violations:
MCL, Monthly (TCR) - In AUG-2009, Contaminant: Coliform. Follow-up actions: St Public Notif requested (OCT-02-2009), St Formal NOV issued (OCT-02-2009), St Compliance achieved (JUN-30-2010)
MCL, Monthly (TCR) - In JUN-2009, Contaminant: Coliform. Follow-up actions: St Public Notif requested (AUG-09-2009), St Formal NOV issued (AUG-09-2009), St Compliance achieved (JUL-01-2010)
Past monitoring violations:
One routine major monitoring violation
One minor monitoring violation
5 regular monitoring violations
Average household size:
This city:
2.6 people
Utah:
3.1 people
Percentage of family households:
This city:
69.6%
Whole state:
75.2%
Percentage of households with unmarried partners:
This city:
5.1%
Whole state:
4.6%
Likely homosexual households (counted as self-reported same-sex unmarried-partner households)
Lesbian couples: 0.2% of all households
Gay men: 0.3% of all households
152 people in nursing facilities/skilled-nursing facilities in 2010
6 people in other noninstitutional facilities in 2010
169 people in nursing homes in 2000
8 people in religious group quarters in 2000
Banks with branches in South Ogden (2011 data):
JPMorgan Chase Bank, National Association: Skyline & Us Highway 89 Banking Cent at 1698 East Skyline Drive, branch established on 2008/07/29. Info updated 2011/11/10: Bank assets: $1,811,678.0 mil, Deposits: $1,190,738.0 mil, headquarters in Columbus, OH, positive income, International Specialization, 5577 total offices, Holding Company: Jpmorgan Chase & Co.
Wells Fargo Bank, National Association: Fresh Market South Ogden Branch at 5296 South Harrison Boulevard, branch established on 1995/11/01. Info updated 2011/04/05: Bank assets: $1,161,490.0 mil, Deposits: $905,653.0 mil, headquarters in Sioux Falls, SD, positive income, 6395 total offices, Holding Company: Wells Fargo & Company
U.S. Bank National Association: South Ogden Branch at 1840 East Skyline Drive, branch established on 2010/10/25. Info updated 2012/01/30: Bank assets: $330,470.8 mil, Deposits: $236,091.5 mil, headquarters in Cincinnati, OH, positive income, 3121 total offices, Holding Company: U.S. Bancorp
Zions First National Bank: South Ogden Office Branch at 5635 South Harrison Blvd., branch established on 2007/09/17. Info updated 2006/11/03: Bank assets: $17,531.3 mil, Deposits: $14,905.3 mil, headquarters in Salt Lake City, UT, positive income, Commercial Lending Specialization, 151 total offices, Holding Company: Zions Bancorporation
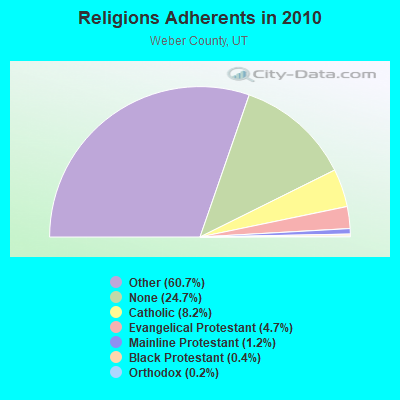
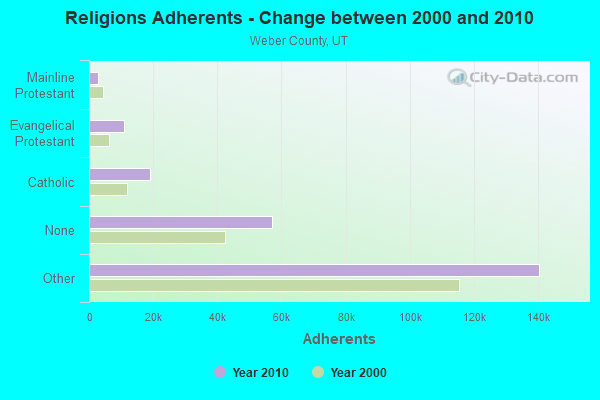
Religion statistics for South Ogden, UT (based on Weber County data)
Religion
Adherents
Congregations
Other
140,427
324
Catholic
18,933
6
Evangelical Protestant
10,761
52
Mainline Protestant
2,761
11
Black Protestant
887
4
Orthodox
350
1
None
57,117
-
Source: Clifford Grammich, Kirk Hadaway, Richard Houseal, Dale E.Jones, Alexei Krindatch, Richie Stanley and Richard H.Taylor. 2012. 2010 U.S.Religion Census: Religious Congregations & Membership Study. Association of Statisticians of American Religious Bodies. Jones, Dale E., et al. 2002. Congregations and Membership in the United States 2000. Nashville, TN: Glenmary Research Center. Graphs represent county-level data
Aircraft: CESSNA 340A (Category: Land, Engines: 2, Seats: 6, Weight: Up to 12,499 Pounds, Speed: 90 mph), Engine: CONT MOTOR TSIO-520 SER (300 HP) (Reciprocating) N-Number: 340BJ, N340BJ, N-340BJ, Serial Number: 340A1532, Year manufactured: 1982, Airworthiness Date: 05/06/1982, Certificate Issue Date: 11/22/2004 Registrant (LLC): Great Western Aviation Leasing LLC, 1068 E 5750 S, South Ogden, UT 84405
Aircraft: PIPER PA-22-135 (Category: Land, Seats: 4, Weight: Up to 12,499 Pounds, Speed: 94 mph), Engine: LYCOMING 0-290 SERIES (140 HP) (Reciprocating) N-Number: 8279C, N8279C, N-8279C, Serial Number: 22-2355, Year manufactured: 1954, Airworthiness Date: 03/02/1956, Certificate Issue Date: 02/23/2016 Registrant (Co-Owned): Edward T Perry, 1641 Shadow Valley Dr, South Ogden, UT 84403, Other Owners: Barry A Neumayer Deregistered:Cancel Date: 06/29/2017, Exported to: Canada
Home Mortgage Disclosure Act Aggregated Statistics For Year 2009 (Based on 2 full and 1 partial tracts)
A) FHA, FSA/RHS & VA Home Purchase Loans
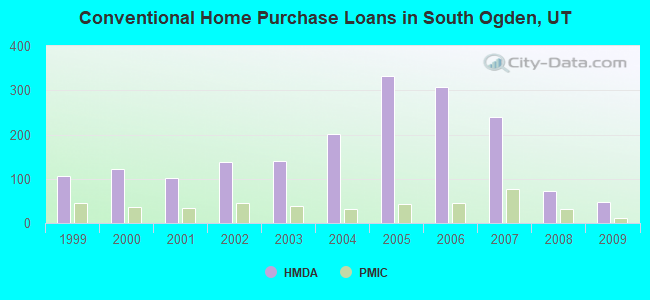
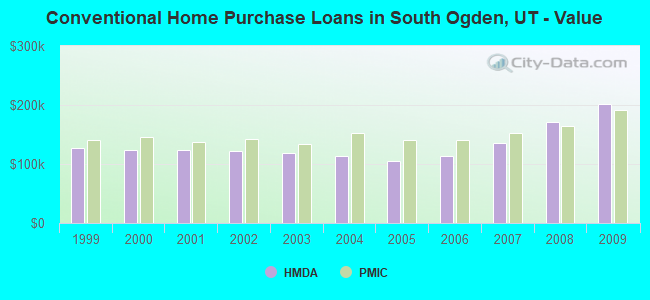
B) Conventional Home Purchase Loans
C) Refinancings
D) Home Improvement Loans
F) Non-occupant Loans on < 5 Family Dwellings (A B C & D)
Number
Average Value
Number
Average Value
Number
Average Value
Number
Average Value
Number
Average Value
LOANS ORIGINATED
86
$152,635
47
$201,708
398
$160,794
17
$97,929
12
$129,642
APPLICATIONS APPROVED, NOT ACCEPTED
4
$143,010
1
$279,880
34
$160,668
4
$11,538
1
$82,700
APPLICATIONS DENIED
6
$128,532
11
$136,602
85
$154,587
3
$18,210
4
$93,498
APPLICATIONS WITHDRAWN
8
$170,401
4
$182,088
60
$166,470
0
$0
2
$102,305
FILES CLOSED FOR INCOMPLETENESS
2
$143,000
0
$0
11
$151,984
2
$179,415
1
$117,740
Aggregated Statistics For Year 2008 (Based on 2 full and 1 partial tracts)
A) FHA, FSA/RHS & VA Home Purchase Loans
B) Conventional Home Purchase Loans
C) Refinancings
D) Home Improvement Loans
F) Non-occupant Loans on < 5 Family Dwellings (A B C & D)
G) Loans On Manufactured Home Dwelling (A B C & D)
Number
Average Value
Number
Average Value
Number
Average Value
Number
Average Value
Number
Average Value
Number
Average Value
LOANS ORIGINATED
82
$156,504
73
$171,383
255
$163,397
22
$74,694
16
$126,064
0
$0
APPLICATIONS APPROVED, NOT ACCEPTED
3
$169,920
5
$279,614
32
$188,577
5
$26,318
1
$179,950
0
$0
APPLICATIONS DENIED
13
$151,847
9
$178,529
90
$172,520
14
$60,209
12
$131,105
1
$25,560
APPLICATIONS WITHDRAWN
7
$168,794
8
$148,231
37
$145,511
5
$147,808
4
$123,208
0
$0
FILES CLOSED FOR INCOMPLETENESS
2
$166,705
6
$212,493
7
$196,704
1
$71,170
3
$197,560
0
$0
Aggregated Statistics For Year 2007 (Based on 2 full and 1 partial tracts)
A) FHA, FSA/RHS & VA Home Purchase Loans
B) Conventional Home Purchase Loans
C) Refinancings
D) Home Improvement Loans
F) Non-occupant Loans on < 5 Family Dwellings (A B C & D)
G) Loans On Manufactured Home Dwelling (A B C & D)
Number
Average Value
Number
Average Value
Number
Average Value
Number
Average Value
Number
Average Value
Number
Average Value
LOANS ORIGINATED
53
$119,540
239
$136,312
235
$147,330
36
$50,397
63
$136,998
2
$17,565
APPLICATIONS APPROVED, NOT ACCEPTED
3
$191,163
32
$132,398
26
$127,970
4
$51,625
8
$98,290
0
$0
APPLICATIONS DENIED
4
$143,738
55
$144,545
117
$135,449
28
$55,288
23
$111,422
0
$0
APPLICATIONS WITHDRAWN
5
$122,614
29
$129,136
48
$129,444
5
$48,048
6
$124,050
0
$0
FILES CLOSED FOR INCOMPLETENESS
0
$0
6
$204,498
7
$109,607
1
$40,110
3
$128,343
0
$0
Aggregated Statistics For Year 2006 (Based on 2 full and 1 partial tracts)
A) FHA, FSA/RHS & VA Home Purchase Loans
B) Conventional Home Purchase Loans
C) Refinancings
D) Home Improvement Loans
E) Loans on Dwellings For 5+ Families
F) Non-occupant Loans on < 5 Family Dwellings (A B C & D)
G) Loans On Manufactured Home Dwelling (A B C & D)
Number
Average Value
Number
Average Value
Number
Average Value
Number
Average Value
Number
Average Value
Number
Average Value
Number
Average Value
LOANS ORIGINATED
50
$132,263
307
$113,403
239
$113,867
28
$40,144
1
$3,217,600
66
$99,803
1
$116,780
APPLICATIONS APPROVED, NOT ACCEPTED
1
$83,280
31
$108,401
37
$139,058
6
$47,788
0
$0
13
$120,436
0
$0
APPLICATIONS DENIED
3
$126,687
69
$104,986
115
$124,263
19
$55,592
0
$0
18
$119,266
0
$0
APPLICATIONS WITHDRAWN
6
$168,333
36
$85,076
47
$118,953
7
$59,261
0
$0
8
$101,681
0
$0
FILES CLOSED FOR INCOMPLETENESS
0
$0
2
$208,070
16
$151,271
0
$0
0
$0
0
$0
0
$0
Aggregated Statistics For Year 2005 (Based on 2 full and 1 partial tracts)
A) FHA, FSA/RHS & VA Home Purchase Loans
B) Conventional Home Purchase Loans
C) Refinancings
D) Home Improvement Loans
F) Non-occupant Loans on < 5 Family Dwellings (A B C & D)
G) Loans On Manufactured Home Dwelling (A B C & D)
Number
Average Value
Number
Average Value
Number
Average Value
Number
Average Value
Number
Average Value
Number
Average Value
LOANS ORIGINATED
46
$117,804
333
$104,897
256
$111,182
25
$45,124
87
$98,576
0
$0
APPLICATIONS APPROVED, NOT ACCEPTED
0
$0
27
$104,470
34
$105,770
9
$26,138
7
$123,586
0
$0
APPLICATIONS DENIED
3
$105,860
74
$107,324
104
$117,979
18
$22,616
27
$166,509
3
$22,050
APPLICATIONS WITHDRAWN
4
$132,532
49
$106,524
74
$124,586
13
$136,132
7
$74,033
0
$0
FILES CLOSED FOR INCOMPLETENESS
0
$0
6
$82,547
33
$151,845
1
$81,520
0
$0
0
$0
Aggregated Statistics For Year 2004 (Based on 2 full and 1 partial tracts)
A) FHA, FSA/RHS & VA Home Purchase Loans
B) Conventional Home Purchase Loans
C) Refinancings
D) Home Improvement Loans
E) Loans on Dwellings For 5+ Families
F) Non-occupant Loans on < 5 Family Dwellings (A B C & D)
G) Loans On Manufactured Home Dwelling (A B C & D)
Number
Average Value
Number
Average Value
Number
Average Value
Number
Average Value
Number
Average Value
Number
Average Value
Number
Average Value
LOANS ORIGINATED
66
$115,782
202
$112,799
282
$121,334
14
$32,656
0
$0
53
$80,659
1
$86,050
APPLICATIONS APPROVED, NOT ACCEPTED
3
$138,450
30
$85,758
56
$117,621
6
$61,650
0
$0
10
$85,642
0
$0
APPLICATIONS DENIED
6
$107,878
42
$95,846
134
$106,439
21
$27,422
1
$116,780
24
$93,181
0
$0
APPLICATIONS WITHDRAWN
2
$111,000
27
$103,243
78
$130,870
3
$32,440
0
$0
8
$112,832
0
$0
FILES CLOSED FOR INCOMPLETENESS
2
$101,695
4
$88,955
27
$125,569
0
$0
0
$0
0
$0
0
$0
Aggregated Statistics For Year 2003 (Based on 2 full and 1 partial tracts)
A) FHA, FSA/RHS & VA Home Purchase Loans
B) Conventional Home Purchase Loans
C) Refinancings
D) Home Improvement Loans
F) Non-occupant Loans on < 5 Family Dwellings (A B C & D)
Number
Average Value
Number
Average Value
Number
Average Value
Number
Average Value
Number
Average Value
LOANS ORIGINATED
73
$121,021
140
$118,670
721
$120,742
19
$27,413
56
$90,620
APPLICATIONS APPROVED, NOT ACCEPTED
0
$0
15
$116,209
79
$135,153
4
$9,785
6
$81,700
APPLICATIONS DENIED
2
$113,775
33
$98,709
128
$115,964
11
$9,442
11
$86,226
APPLICATIONS WITHDRAWN
10
$107,694
16
$141,149
80
$130,427
2
$26,930
6
$126,117
FILES CLOSED FOR INCOMPLETENESS
5
$119,636
7
$104,897
34
$131,599
0
$0
3
$94,720
Aggregated Statistics For Year 2002 (Based on 2 full and 1 partial tracts)
A) FHA, FSA/RHS & VA Home Purchase Loans
B) Conventional Home Purchase Loans
C) Refinancings
D) Home Improvement Loans
F) Non-occupant Loans on < 5 Family Dwellings (A B C & D)
Number
Average Value
Number
Average Value
Number
Average Value
Number
Average Value
Number
Average Value
LOANS ORIGINATED
68
$112,369
137
$122,640
494
$120,827
24
$26,618
35
$99,211
APPLICATIONS APPROVED, NOT ACCEPTED
2
$115,290
12
$171,761
60
$129,731
5
$28,982
7
$93,786
APPLICATIONS DENIED
10
$111,516
24
$98,287
105
$123,648
7
$9,827
10
$88,445
APPLICATIONS WITHDRAWN
1
$148,500
24
$99,827
129
$129,845
2
$20,760
11
$106,197
FILES CLOSED FOR INCOMPLETENESS
0
$0
11
$117,462
37
$132,826
0
$0
4
$94,750
Aggregated Statistics For Year 2001 (Based on 2 full and 1 partial tracts)
A) FHA, FSA/RHS & VA Home Purchase Loans
B) Conventional Home Purchase Loans
C) Refinancings
D) Home Improvement Loans
F) Non-occupant Loans on < 5 Family Dwellings (A B C & D)
Number
Average Value
Number
Average Value
Number
Average Value
Number
Average Value
Number
Average Value
LOANS ORIGINATED
60
$113,312
101
$122,977
408
$113,173
28
$26,437
25
$105,187
APPLICATIONS APPROVED, NOT ACCEPTED
1
$143,100
8
$114,325
35
$109,333
4
$31,602
4
$117,382
APPLICATIONS DENIED
6
$111,268
19
$94,421
103
$107,385
11
$21,025
9
$79,683
APPLICATIONS WITHDRAWN
9
$98,383
14
$120,106
101
$126,011
2
$20,425
4
$143,912
FILES CLOSED FOR INCOMPLETENESS
1
$111,040
3
$93,947
43
$116,550
0
$0
0
$0
Aggregated Statistics For Year 2000 (Based on 2 full and 1 partial tracts)
A) FHA, FSA/RHS & VA Home Purchase Loans
B) Conventional Home Purchase Loans
C) Refinancings
D) Home Improvement Loans
F) Non-occupant Loans on < 5 Family Dwellings (A B C & D)
Number
Average Value
Number
Average Value
Number
Average Value
Number
Average Value
Number
Average Value
LOANS ORIGINATED
63
$113,951
122
$123,211
146
$104,641
24
$17,512
16
$82,019
APPLICATIONS APPROVED, NOT ACCEPTED
2
$126,225
6
$97,132
26
$105,772
8
$30,915
3
$66,577
APPLICATIONS DENIED
10
$106,384
23
$95,978
76
$75,594
18
$25,882
7
$82,347
APPLICATIONS WITHDRAWN
7
$120,986
20
$107,478
53
$97,272
3
$15,033
4
$78,742
FILES CLOSED FOR INCOMPLETENESS
2
$94,500
4
$106,045
35
$98,759
0
$0
0
$0
Aggregated Statistics For Year 1999 (Based on 3 partial tracts)
A) FHA, FSA/RHS & VA Home Purchase Loans
B) Conventional Home Purchase Loans
C) Refinancings
D) Home Improvement Loans
F) Non-occupant Loans on < 5 Family Dwellings (A B C & D)
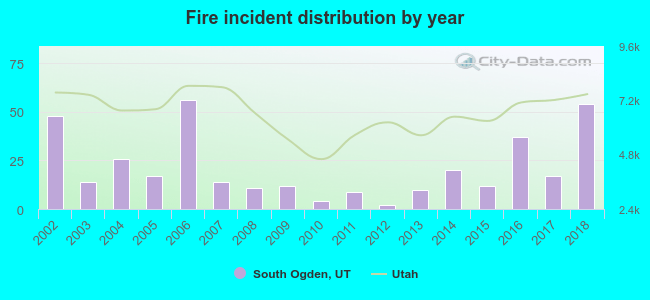
2002 - 2018 National Fire Incident Reporting System (NFIRS) incidents
Based on the data from the years 2002 - 2018 the average number of fire incidents per year is 21. The highest number of fires - 56 took place in 2006, and the least - 2 in 2012. The data has a growing trend.
When looking into fire subcategories, the most reports belonged to: Structure Fires (57.3%), and Outside Fires (20.7%).
Fire incident types reported to NFIRS in South Ogden, UT


 Recent articles from our blog. Our writers, many of them Ph.D. graduates or candidates, create easy-to-read articles on a wide variety of topics.

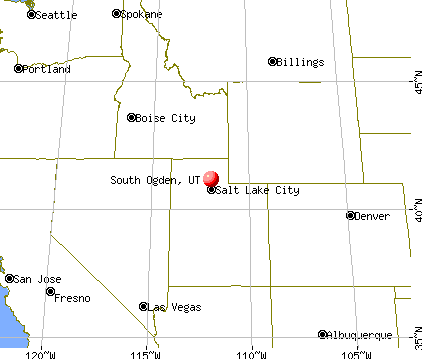
 (3.7 miles


 Based on the data from the years 2002 - 2018 the average number of fire incidents per year is 21. The highest number of fires - 56 took place in 2006, and the least - 2 in 2012. The data has a growing trend.
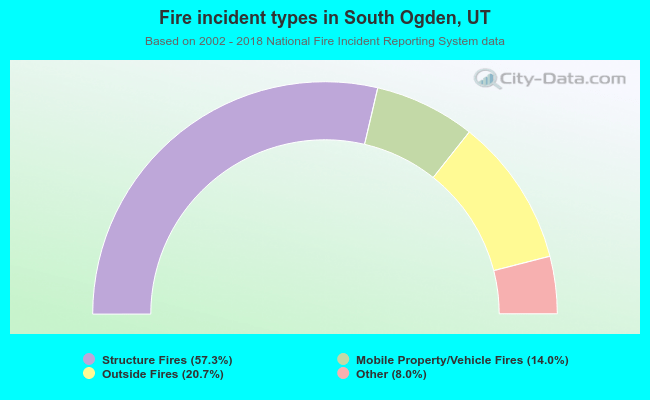 When looking into fire subcategories, the most reports belonged to: Structure Fires (57.3%), and Outside Fires (20.7%).