Riverdale, Georgia

Riverdale: Recycleing
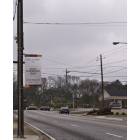
Riverdale: Upper Riverdale Rd.

Riverdale: Riverdale
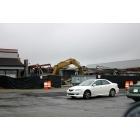
Riverdale: Walmart renovation Hwy 85

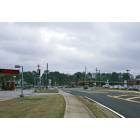
Riverdale: Starting Riverdale New City Hall
Riverdale: Recycleing

Riverdale: Hornor the Military1

Riverdale: riverdale Goverment
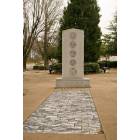
Riverdale: Hornor the Military

Riverdale: riverdale police dpt
- add
your
Submit your own pictures of this city and show them to the world
- OSM Map
- General Map
- Google Map
- MSN Map
Population change since 2000: +17.9%
| Males: 6,932 | |
| Females: 7,783 |
| Median resident age: | 38.8 years |
| Georgia median age: | 37.6 years |
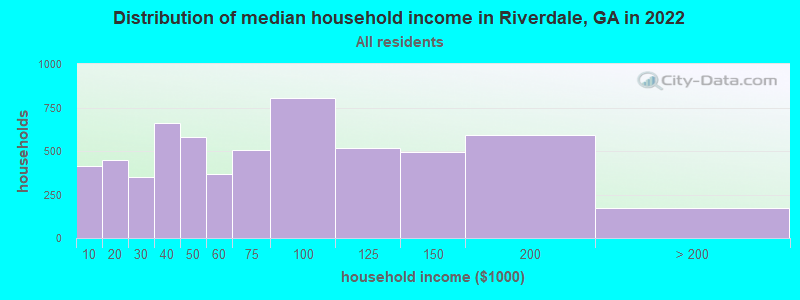
| Riverdale: | $63,944 |
| GA: | $72,837 |
Estimated per capita income in 2022: $31,132 (it was $15,377 in 2000)
Riverdale city income, earnings, and wages data
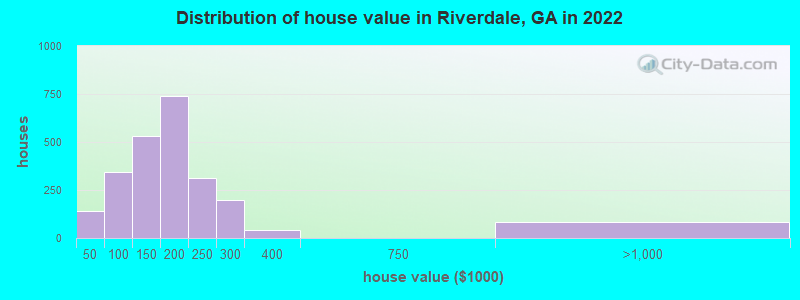
Estimated median house or condo value in 2022: $194,284 (it was $90,200 in 2000)
| Riverdale: | $194,284 |
| GA: | $297,400 |
Mean prices in 2022: all housing units: $179,305; detached houses: $186,802; townhouses or other attached units: $106,660; mobile homes: $115,670
Median gross rent in 2022: $1,259.
(16.7% for White Non-Hispanic residents, 14.0% for Black residents, 38.0% for Hispanic or Latino residents, 26.6% for other race residents, 24.2% for two or more races residents)
Detailed information about poverty and poor residents in Riverdale, GA


Compare current foreclosures in Riverdale, GA:
| Photo | Address | Area | Beds / Baths | Price | Details |
|---|---|---|---|---|---|

|
#1
Hightower Trl
Riverdale, GA 30274
|
2,768 sq. feet
|
3 baths 4 beds |
show details | |

|
#2
Leafwood Ct
Riverdale, GA 30274
|
1,201 sq. feet
|
1 baths 3 beds |
show details | |

|
#3
Eunice Dr
Riverdale, GA 30274
|
1,375 sq. feet
|
2 baths 3 beds |
show details | |

|
#4
Paul Ct
Riverdale, GA 30274
|
1,275 sq. feet
|
2 baths 3 beds |
show details | |

|
#5
Grey Fox Way
Riverdale, GA 30296
|
1,827 sq. feet
|
2 baths 4 beds |
show details | |

|
#6
Homewood Dr
Riverdale, GA 30274
|
- sq. feet
|
1 baths 3 beds |
show details | |

|
#7
Indian Hill Trl
Riverdale, GA 30296
|
1,850 sq. feet
|
1 baths 4 beds |
show details | |

|
#8
Paul Ct
Riverdale, GA 30274
|
1,275 sq. feet
|
2 baths 3 beds |
show details | |

|
#9
Diplomat Dr
Riverdale, GA 30296
|
1,588 sq. feet
|
2 baths 3 beds |
show details | |

|
#10
Stark Ct
Riverdale, GA 30274
|
925 sq. feet
|
1 baths 3 beds |
show details |
| Photo | Address | Area | Beds / Baths | Price | Details |
|---|---|---|---|---|---|

|
#11
Roy Huie Rd
Riverdale, GA 30274
|
1,826 sq. feet
|
1 baths 3 beds |
show details | |

|
#12
Glenwoods Dr
Riverdale, GA 30274
|
1,804 sq. feet
|
2 baths 3 beds |
show details | |

|
#13
Voyles Dr
Riverdale, GA 30274
|
1,050 sq. feet
|
1 baths 3 beds |
show details | |

|
#14
Chippewa Dr
Riverdale, GA 30296
|
1,690 sq. feet
|
2 baths 4 beds |
show details | |

|
#15
Drawbridge Dr
Riverdale, GA 30296
|
2,144 sq. feet
|
2 baths 3 beds |
show details | |

|
#16
Sandy Cir
Riverdale, GA 30296
|
1,372 sq. feet
|
3 baths 4 beds |
show details | |

|
#17
Verde Dr
Riverdale, GA 30274
|
2,203 sq. feet
|
1 baths 3 beds |
show details | |

|
#18
Conkle Ct
Riverdale, GA 30296
|
2,128 sq. feet
|
2 baths 4 beds |
show details | |

|
#19
West Rd
Riverdale, GA 30296
|
1,847 sq. feet
|
2 baths 4 beds |
show details | |

|
#20
Derby Dr
Riverdale, GA 30274
|
2,183 sq. feet
|
2 baths 3 beds |
show details |
| Photo | Address | Area | Beds / Baths | Price | Details |
|---|---|---|---|---|---|

|
#21
Eagles Crossing Ln
Riverdale, GA 30274
|
1,312 sq. feet
|
2 baths 3 beds |
show details | |

|
#22
Patriots Rd
Riverdale, GA 30296
|
1,935 sq. feet
|
2 baths 4 beds |
show details | |

|
#23
Royale Ct
Riverdale, GA 30296
|
1,284 sq. feet
|
2 baths 4 beds |
show details | |

|
#24
Abington Dr
Riverdale, GA 30274
|
2,368 sq. feet
|
2 baths 4 beds |
show details | |

|
#25
Brookview Dr
Riverdale, GA 30274
|
1,488 sq. feet
|
2 baths 3 beds |
show details | |

|
#26
Cedar Creek Rdg
Riverdale, GA 30274
|
1,585 sq. feet
|
2 baths 3 beds |
show details | |

|
#27
Knights Way
Riverdale, GA 30296
|
1,556 sq. feet
|
2 baths 3 beds |
show details | |

|
#28
Bethsaida Rd
Riverdale, GA 30296
|
1,798 sq. feet
|
2 baths 3 beds |
show details | |

|
#29
Creekmoor Ln
Riverdale, GA 30296
|
1,332 sq. feet
|
2 baths 3 beds |
show details | |

|
#30
Sunrise Cir
Riverdale, GA 30274
|
1,025 sq. feet
|
1 baths 3 beds |
show details |
| Photo | Address | Area | Beds / Baths | Price | Details |
|---|---|---|---|---|---|

|
#31
Cedar Hill Ct
Riverdale, GA 30296
|
1,368 sq. feet
|
2 baths 3 beds |
show details | |

|
#32
Fairway Ct
Riverdale, GA 30274
|
1,290 sq. feet
|
2 baths 3 beds |
show details | |

|
#33
White Cedar Ct
Riverdale, GA 30274
|
1,832 sq. feet
|
2 baths 4 beds |
show details | |

|
#34
Glenwoods Dr
Riverdale, GA 30274
|
1,242 sq. feet
|
2 baths 3 beds |
show details | |

|
#35
Avalon Way
Riverdale, GA 30274
|
1,952 sq. feet
|
3 baths 3 beds |
show details | |

|
#36
Fallawater Cir
Riverdale, GA 30274
|
950 sq. feet
|
1 baths 3 beds |
show details | |

|
#37
W Shore Dr
Riverdale, GA 30296
|
2,490 sq. feet
|
2 baths 3 beds |
show details | |

|
#38
Shangrila Cir # 708
Riverdale, GA 30296
|
1,517 sq. feet
|
2 baths 3 beds |
show details | |

|
#39
W Shore Ct
Riverdale, GA 30296
|
2,002 sq. feet
|
2 baths 3 beds |
show details | |

|
#40
Meadows Ct
Riverdale, GA 30274
|
1,248 sq. feet
|
2 baths 3 beds |
show details |
| Photo | Address | Area | Beds / Baths | Price | Details |
|---|---|---|---|---|---|

|
#41
Horseshoe Bnd
Riverdale, GA 30274
|
1,604 sq. feet
|
3 baths 3 beds |
show details | |

|
#42
Sandpiper Ln
Riverdale, GA 30274
|
2,322 sq. feet
|
3 baths 4 beds |
show details | |

|
#43
Collier Way
Riverdale, GA 30296
|
2,516 sq. feet
|
2 baths 4 beds |
show details | |

|
#44
Indian Hill Trl
Riverdale, GA 30296
|
1,482 sq. feet
|
2 baths 3 beds |
show details | |

|
#45
Sutton Dr
Riverdale, GA 30274
|
2,192 sq. feet
|
2 baths 3 beds |
show details | |

|
#46
Bernardo Dr
Riverdale, GA 30296
|
1,556 sq. feet
|
2 baths 3 beds |
show details | |

|
#47
Green Valley Ln
Riverdale, GA 30274
|
1,025 sq. feet
|
1 baths 3 beds |
show details | |

|
#48
Feldspar Way
Riverdale, GA 30296
|
1,467 sq. feet
|
3 baths 4 beds |
show details | |

|
#49
Pine Tree Trl
Atlanta, GA 30349
|
1,466 sq. feet
|
2 baths 3 beds |
show details | |

|
Check over 1 million property listings on Foreclosure.com!
|
browse all offers | |||


- 12,20881.7%Black alone
- 9796.6%Asian alone
- 6544.4%White alone
- 5053.4%Hispanic
- 3752.5%Two or more races
- 670.4%Other race alone
- 70.05%American Indian alone
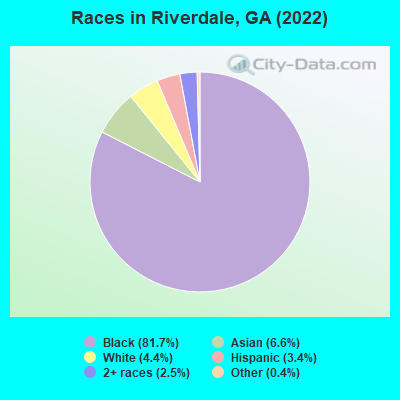
Races in Riverdale detailed stats: ancestries, foreign born residents, place of birth
According to our research of Georgia and other state lists, there were 172 registered sex offenders living in Riverdale, Georgia as of June 04, 2024.
The ratio of all residents to sex offenders in Riverdale is 94 to 1.
Type |
2009 |
2010 |
2011 |
2012 |
2013 |
2014 |
2015 |
2016 |
2017 |
2018 |
2019 |
2020 |
2021 |
2022 |
|---|---|---|---|---|---|---|---|---|---|---|---|---|---|---|
| Murders (per 100,000) | 1 (6.4) | 1 (6.6) | 0 (0.0) | 1 (6.5) | 0 (0.0) | 2 (12.8) | 2 (12.7) | 4 (24.8) | 4 (24.3) | 2 (12.0) | 0 (0.0) | 0 (0.0) | 1 (6.4) | 0 (0.0) |
| Rapes (per 100,000) | 9 (57.6) | 3 (19.8) | 3 (19.6) | 1 (6.5) | 1 (6.4) | 1 (6.4) | 1 (6.3) | 0 (0.0) | 2 (12.2) | 1 (6.0) | 1 (5.9) | 3 (19.1) | 0 (0.0) | 0 (0.0) |
| Robberies (per 100,000) | 49 (313.7) | 59 (389.9) | 44 (287.0) | 45 (291.9) | 40 (256.2) | 43 (275.5) | 37 (234.5) | 31 (192.0) | 31 (188.6) | 21 (126.4) | 1 (5.9) | 6 (38.1) | 3 (19.2) | 0 (0.0) |
| Assaults (per 100,000) | 63 (403.4) | 62 (409.7) | 71 (463.1) | 72 (467.1) | 41 (262.7) | 23 (147.4) | 51 (323.3) | 42 (260.2) | 50 (304.2) | 31 (186.5) | 20 (118.0) | 18 (114.3) | 8 (51.1) | 0 (0.0) |
| Burglaries (per 100,000) | 330 (2,113) | 338 (2,233) | 311 (2,028) | 291 (1,888) | 170 (1,089) | 263 (1,685) | 226 (1,433) | 141 (873.5) | 159 (967.4) | 83 (499.5) | 32 (188.8) | 20 (127.0) | 3 (19.2) | 0 (0.0) |
| Thefts (per 100,000) | 528 (3,380) | 606 (4,004) | 614 (4,004) | 541 (3,510) | 590 (3,780) | 621 (3,979) | 732 (4,640) | 655 (4,058) | 884 (5,379) | 705 (4,242) | 167 (985.3) | 170 (1,080) | 70 (447.5) | 1 (6.8) |
| Auto thefts (per 100,000) | 113 (723.5) | 73 (482.4) | 91 (593.5) | 82 (532.0) | 66 (422.8) | 35 (224.3) | 70 (443.7) | 54 (334.5) | 87 (529.4) | 54 (324.9) | 26 (153.4) | 14 (88.9) | 4 (25.6) | 0 (0.0) |
| Arson (per 100,000) | 1 (6.4) | 0 (0.0) | 0 (0.0) | 0 (0.0) | 0 (0.0) | 0 (0.0) | 0 (0.0) | 0 (0.0) | 0 (0.0) | 0 (0.0) | 0 (0.0) | 0 (0.0) | 1 (6.4) | 0 (0.0) |
| City-Data.com crime index | 574.7 | 583.1 | 544.0 | 514.3 | 395.8 | 437.9 | 486.8 | 409.4 | 501.1 | 334.8 | 95.0 | 108.7 | 50.1 | 0.3 |
The City-Data.com crime index weighs serious crimes and violent crimes more heavily. Higher means more crime, U.S. average is 246.1. It adjusts for the number of visitors and daily workers commuting into cities.
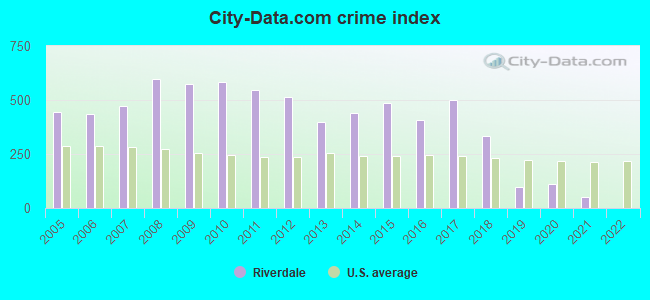
Crime rate in Riverdale detailed stats: murders, rapes, robberies, assaults, burglaries, thefts, arson
Full-time law enforcement employees in 2021, including police officers: 43 (35 officers - 30 male; 5 female).
| Officers per 1,000 residents here: | 2.24 |
| Georgia average: | 2.45 |
 Recent articles from our blog. Our writers, many of them Ph.D. graduates or candidates, create easy-to-read articles on a wide variety of topics.

 | Which Failed Expressway Would Help Traffic Today (81 replies) |
| Songs about the A... (155 replies) |
| Ban the Dollar Store? DeKalb County passed a 45-day moratorium on new dollar stores (106 replies) |
| 6PM commute Riverdale to Marietta now takes 80 minutes, used to take 40 minutes? (37 replies) |
| Considering moving to Riverdale, GA (5 replies) |
| No More Christmas Tree Recycling for Me (11 replies) |
Latest news from Riverdale, GA collected exclusively by city-data.com from local newspapers, TV, and radio stations
Ancestries: Nigerian (5.8%), African (2.9%), American (2.7%), Jamaican (1.6%).
Current Local Time: EST time zone
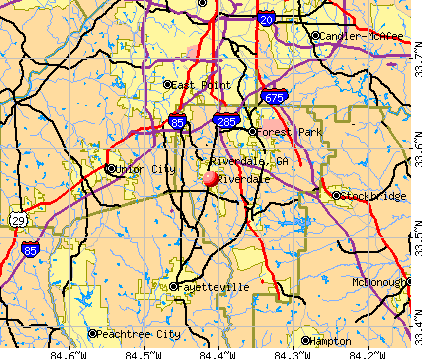
Land area: 4.26 square miles.
Population density: 3,451 people per square mile (average).
2,109 residents are foreign born (5.6% Africa, 5.0% Asia, 2.8% Latin America).
| This city: | 14.1% |
| Georgia: | 10.4% |
Median real estate property taxes paid for housing units with mortgages in 2022: $1,791 (0.9%)
Median real estate property taxes paid for housing units with no mortgage in 2022: $2,258 (1.5%)
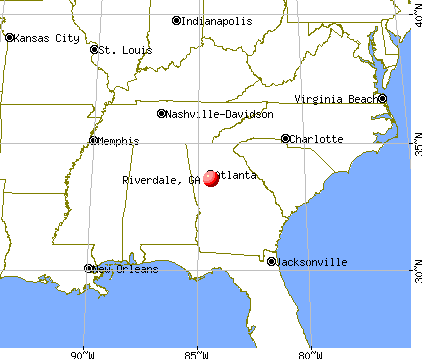
Nearest city with pop. 50,000+: Atlanta, GA  (13.5 miles , pop. 416,474).
Nearest city with pop. 1,000,000+: Chicago, IL (599.6 miles , pop. 2,896,016).
Nearest cities:
), ), ), ), Latitude: 33.56 N, Longitude: 84.41 W
Daytime population change due to commuting: -1,797 (-12.0%)
Workers who live and work in this city: 1,738 (21.8%)

Riverdale, Georgia accommodation & food services, waste management - Economy and Business Data
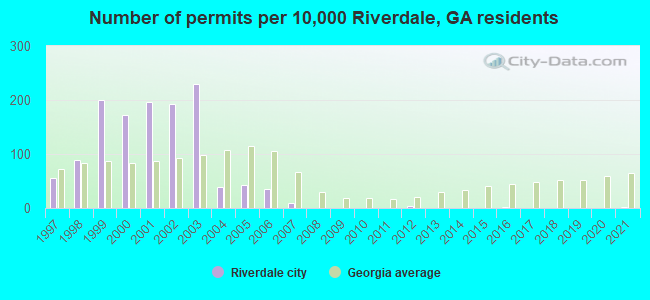
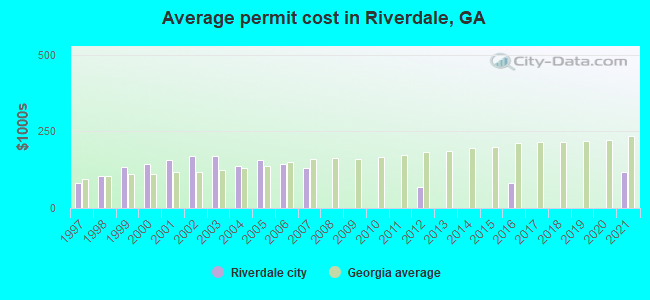
Single-family new house construction building permits:
- 2021: 3 buildings, average cost: $118,300
- 2016: 1 building, cost: $80,000
- 2012: 5 buildings, average cost: $68,800
- 2007: 13 buildings, average cost: $130,100
- 2006: 44 buildings, average cost: $144,700
- 2005: 52 buildings, average cost: $155,800
- 2004: 48 buildings, average cost: $138,000
- 2003: 287 buildings, average cost: $169,500
- 2002: 240 buildings, average cost: $169,100
- 2001: 246 buildings, average cost: $156,200
- 2000: 216 buildings, average cost: $143,100
- 1999: 250 buildings, average cost: $133,800
- 1998: 110 buildings, average cost: $102,500
- 1997: 69 buildings, average cost: $79,600
| Here: | 3.7% |
| Georgia: | 2.9% |
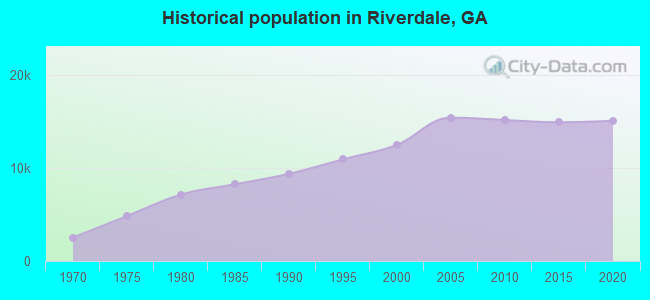
Population change in the 1990s: +2,573 (+26.0%).

- Health care (9.0%)
- Accommodation & food services (9.0%)
- Public administration (7.0%)
- Construction (6.5%)
- Educational services (4.9%)
- Food & beverage stores (4.6%)
- Truck transportation (3.8%)

- Construction (11.2%)
- Accommodation & food services (10.2%)
- Public administration (6.7%)
- Truck transportation (6.6%)
- Food & beverage stores (5.5%)
- Other transportation, support activities, couriers (5.1%)
- Air transportation (3.5%)
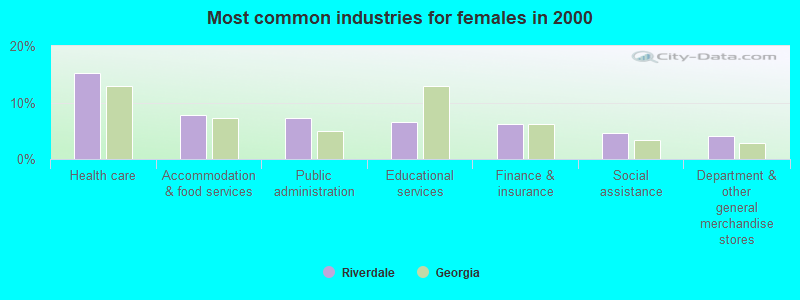
- Health care (15.2%)
- Accommodation & food services (7.8%)
- Public administration (7.3%)
- Educational services (6.6%)
- Finance & insurance (6.2%)
- Social assistance (4.6%)
- Department & other general merchandise stores (4.1%)
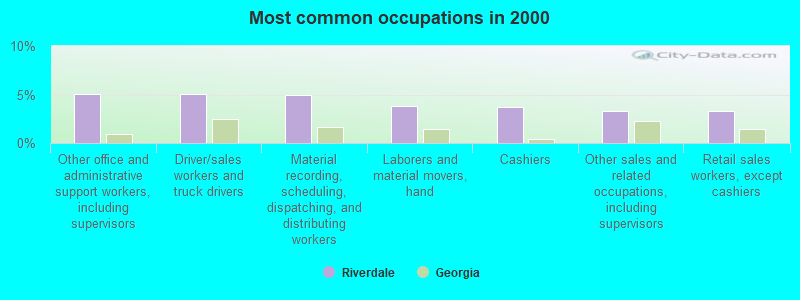
- Other office and administrative support workers, including supervisors (5.1%)
- Driver/sales workers and truck drivers (5.0%)
- Material recording, scheduling, dispatching, and distributing workers (4.9%)
- Laborers and material movers, hand (3.8%)
- Cashiers (3.7%)
- Other sales and related occupations, including supervisors (3.3%)
- Retail sales workers, except cashiers (3.3%)
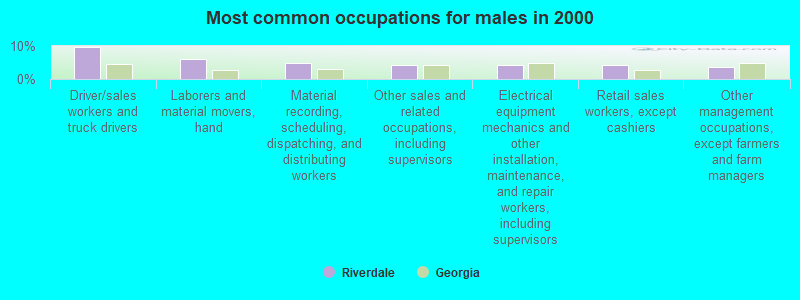
- Driver/sales workers and truck drivers (9.6%)
- Laborers and material movers, hand (6.2%)
- Material recording, scheduling, dispatching, and distributing workers (4.8%)
- Other sales and related occupations, including supervisors (4.3%)
- Electrical equipment mechanics and other installation, maintenance, and repair workers, including supervisors (4.3%)
- Retail sales workers, except cashiers (4.1%)
- Other management occupations, except farmers and farm managers (3.7%)
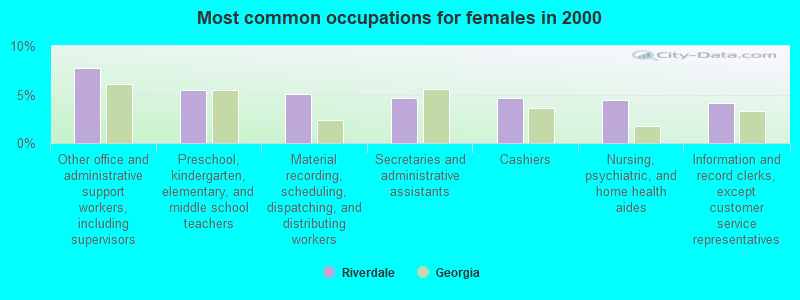
- Other office and administrative support workers, including supervisors (7.8%)
- Preschool, kindergarten, elementary, and middle school teachers (5.5%)
- Material recording, scheduling, dispatching, and distributing workers (5.0%)
- Secretaries and administrative assistants (4.7%)
- Cashiers (4.6%)
- Nursing, psychiatric, and home health aides (4.5%)
- Information and record clerks, except customer service representatives (4.1%)
Average climate in Riverdale, Georgia
Based on data reported by over 4,000 weather stations


(lower is better)
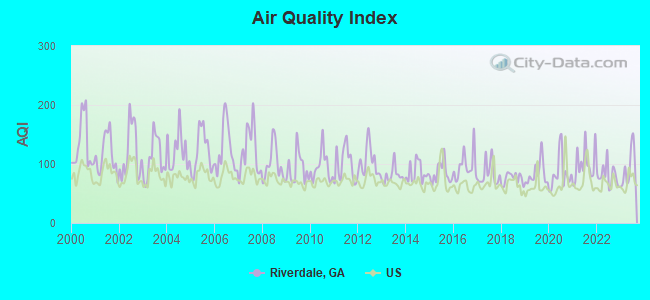
Air Quality Index (AQI) level in 2023 was 93.5. This is worse than average.
| City: | 93.5 |
| U.S.: | 72.6 |
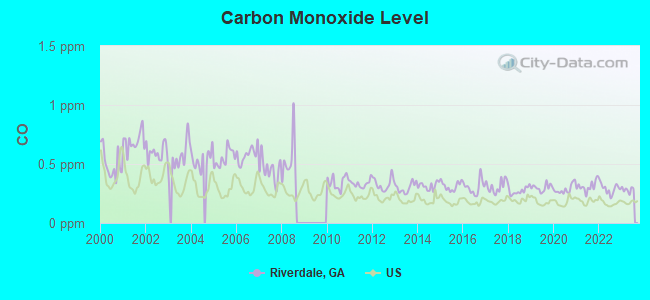
Carbon Monoxide (CO) [ppm] level in 2023 was 0.282. This is about average. Closest monitor was 9.6 miles away from the city center.
| City: | 0.282 |
| U.S.: | 0.251 |
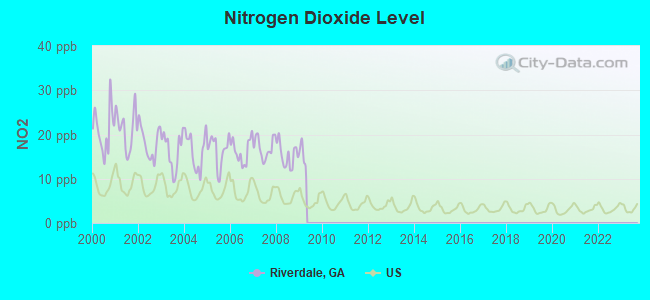
Nitrogen Dioxide (NO2) [ppb] level in 2008 was 15.3. This is significantly worse than average. Closest monitor was 6.3 miles away from the city center.
| City: | 15.3 |
| U.S.: | 5.1 |
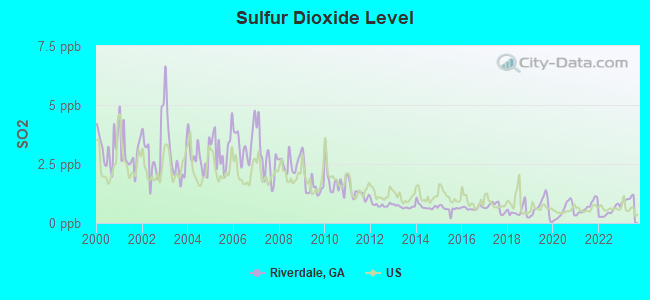
Sulfur Dioxide (SO2) [ppb] level in 2023 was 1.02. This is significantly better than average. Closest monitor was 6.5 miles away from the city center.
| City: | 1.02 |
| U.S.: | 1.51 |
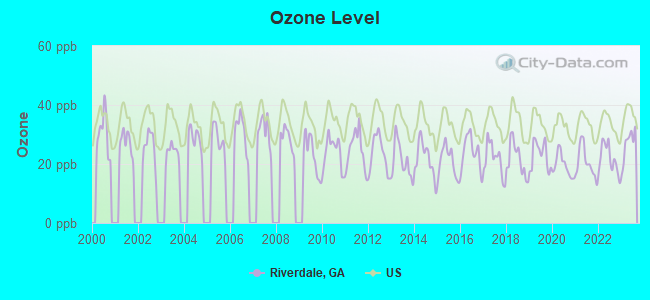
Ozone [ppb] level in 2023 was 26.7. This is better than average. Closest monitor was 7.6 miles away from the city center.
| City: | 26.7 |
| U.S.: | 33.3 |
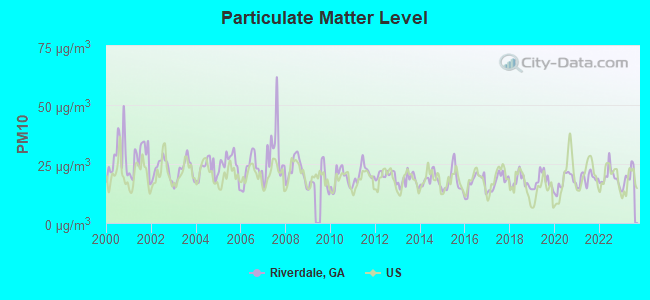
Particulate Matter (PM10) [µg/m3] level in 2023 was 19.7. This is about average. Closest monitor was 11.0 miles away from the city center.
| City: | 19.7 |
| U.S.: | 19.2 |
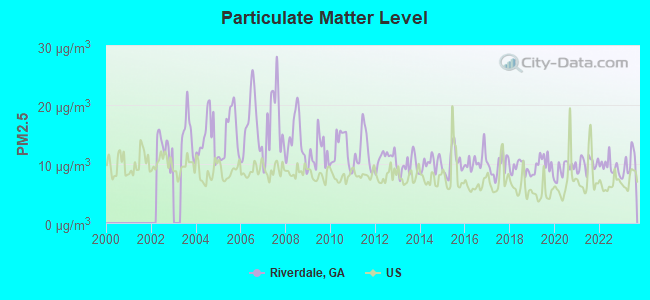
Particulate Matter (PM2.5) [µg/m3] level in 2023 was 10.1. This is worse than average. Closest monitor was 3.4 miles away from the city center.
| City: | 10.1 |
| U.S.: | 8.1 |
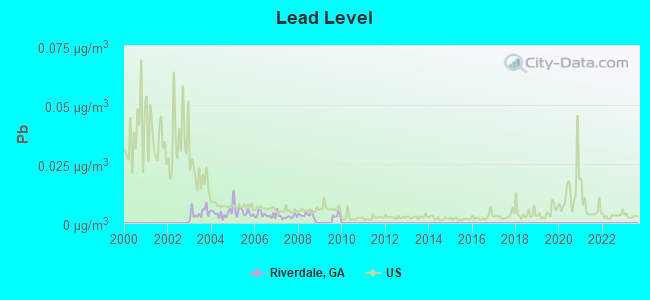
Lead (Pb) [µg/m3] level in 2008 was 0.00340. This is significantly better than average. Closest monitor was 11.0 miles away from the city center.
| City: | 0.00340 |
| U.S.: | 0.00931 |
Tornado activity:
Riverdale-area historical tornado activity is slightly above Georgia state average. It is 56% greater than the overall U.S. average.
On 11/22/1992, a category F4 (max. wind speeds 207-260 mph) tornado 28.7 miles away from the Riverdale city center injured 46 people and caused between $5,000,000 and $50,000,000 in damages.
On 1/10/1972, a category F3 (max. wind speeds 158-206 mph) tornado 7.3 miles away from the city center killed one person and injured 9 people and caused between $50,000 and $500,000 in damages.
Earthquake activity:
Riverdale-area historical earthquake activity is significantly above Georgia state average. It is 48% greater than the overall U.S. average.On 4/29/2003 at 08:59:39, a magnitude 4.9 (4.4 MB, 4.6 MW, 4.9 LG, Class: Light, Intensity: IV - V) earthquake occurred 94.9 miles away from the city center
On 8/2/1974 at 08:52:09, a magnitude 4.9 (4.3 MB, 4.9 LG) earthquake occurred 112.6 miles away from the city center
On 4/29/2003 at 08:59:39, a magnitude 4.6 (4.6 MW, Depth: 12.3 mi) earthquake occurred 94.9 miles away from the city center
On 1/18/1999 at 07:00:53, a magnitude 4.8 (4.8 MB, 4.0 LG, Depth: 0.6 mi) earthquake occurred 164.5 miles away from Riverdale center
On 11/30/1973 at 07:48:41, a magnitude 4.7 (4.7 MB, 4.6 ML) earthquake occurred 156.6 miles away from Riverdale center
On 10/24/1997 at 08:35:17, a magnitude 4.9 (4.8 MB, 4.2 MS, 4.9 LG, Depth: 6.2 mi) earthquake occurred 237.6 miles away from Riverdale center
Magnitude types: regional Lg-wave magnitude (LG), body-wave magnitude (MB), local magnitude (ML), surface-wave magnitude (MS), moment magnitude (MW)
Natural disasters:
The number of natural disasters in Clayton County (10) is smaller than the US average (15).Major Disasters (Presidential) Declared: 5
Emergencies Declared: 4
Causes of natural disasters: Floods: 3, Hurricanes: 3, Tornadoes: 3, Winter Storms: 2, Drought: 1, Heavy Rain: 1, Snowfall: 1, Storm: 1, Tropical Storm: 1, Other: 1 (Note: some incidents may be assigned to more than one category).

Hospitals and medical centers in Riverdale:
- CHRISTIAN MINISTRIES HOSPICE OF RIVERDALE (125 HIGHWAY 138)
- ELYSIUM HOUSE, INC (6490 WEST FAYETTEVILLE ROAD)
- SOUTHERN CRESCENT HOSPITAL FOR SPECIALTY CARE (11 UPPER RIVERDALE ROAD SW 6TH FLOOR)
- SOUTHERN REGIONAL MEDICAL CENTER (Voluntary non-profit - Private, 11 UPPER RIVERDALE ROAD, SW)
- RIVERDALE PLACE CARE AND REHABILITATION CENTER (315 UPPER RIVERDALE ROAD)
- DAVITA SOUTHERN CRESCENT DIALYSIS CENTER (275 UPPER RIVERDALE RD SW STE B)
- SUNCREST HOME HEALTH (29 UPPER RIVERDALE ROAD SUITE 130)
Heliports located in Riverdale:
Colleges/universities with over 2000 students nearest to Riverdale:
- Clayton State University (about 6 miles; Morrow, GA; Full-time enrollment: 5,844)
- Atlanta Metropolitan State College (about 10 miles; Atlanta, GA; FT enrollment: 2,437)
- Atlanta Technical College (about 11 miles; Atlanta, GA; FT enrollment: 4,217)
- Georgia Perimeter College (about 12 miles; Decatur, GA; FT enrollment: 17,138)
- Spelman College (about 13 miles; Atlanta, GA; FT enrollment: 2,383)
- Morehouse College (about 13 miles; Atlanta, GA; FT enrollment: 2,379)
- Clark Atlanta University (about 13 miles; Atlanta, GA; FT enrollment: 3,201)
Public high schools in Riverdale:
- RIVERDALE HIGH SCHOOL (Students: 1,608, Location: 160 ROBERTS DR, Grades: 9-12)
- CHARLES R. DREW HIGH SCHOOL (Location: 6237 GARDEN WALK BLVD, Grades: 9-12)
Private high school in Riverdale:
Public elementary/middle schools in Riverdale:
- CHURCH STREET ELEMENTARY SCHOOL (Students: 864, Location: 7013 CHURCH ST, Grades: PK-5)
- RIVERDALE MIDDLE SCHOOL (Students: 839, Location: 400 ROBERTS DR, Grades: 6-8)
- LAKE RIDGE ELEMENTARY SCHOOL (Students: 754, Location: 7900 LAKE RIDGE CIR, Grades: PK-5)
- OLIVER ELEMENTARY SCHOOL (Students: 751, Location: 1725 CHERYL LEIGH DR, Grades: KG-5)
- SEQUOYAH MIDDLE SCHOOL (Students: 745, Location: 95 VALLEY HILL RD SW, Grades: 6-8)
- HARPER ELEMENTARY SCHOOL (Students: 741, Location: 93 VALLEY HILL RD SW, Grades: PK-5)
- POINTE SOUTH ELEMENTARY SCHOOL (Students: 704, Location: 8482 THOMAS RD, Grades: PK-5)
- RIVERDALE ELEMENTARY SCHOOL (Students: 606, Location: 6253 GARDEN WALK BLVD, Grades: PK-5)
- UTOPIAN ACADEMY FOR THE ARTS CHARTER SCHOOL (Location: 6630 CAMP ST, Grades: 6-7, Charter school)
User-submitted facts and corrections:
- The correct website address for the City of Riverdale is www.riverdalega.gov
Points of interest:
Notable locations in Riverdale: Riverdale Station 2 Fire Station (A), Riverdale Department of Public Safety (B), Riverdale Public Works (C), Riverdale Police Station (D), Riverdale Library (E), Riverdale City Hall (F). Display/hide their locations on the map
Shopping Centers: Riverdale Plaza Shopping Center (1), Chateau Plaza Shopping Center (2), Max Place Shopping Center (3), Shops of Riverdale Shopping Center (4). Display/hide their locations on the map
Church in Riverdale: Riverdale Church of God (A). Display/hide its location on the map
Cemetery: King Cemetery (1). Display/hide its location on the map
Streams, rivers, and creeks: Team Stream (A). Display/hide its location on the map
Hotels: Extended Stayamerica (6231 Highway 85), Budget Inn of Riverdale (709 King Road), Fellymore Cab & Shuttle Service (524 Oak Valley Drive).
Birthplace of: Boni Blackstone - Businessman, Alan Drosky - Track and field coach, Ashley Holcombe - Softball player, Cecil Travis - Baseball player, Chris Hanson - 2005 NFL player (Jacksonville Jaguars, born: Oct 25, 1976), Cordy Glenn - Football player, Kudus Ogbara - College basketball player (Alabama A&M Bulldogs).
| This city: | 2.7 people |
| Georgia: | 2.6 people |
| This city: | 65.4% |
| Whole state: | 68.5% |
| This city: | 8.2% |
| Whole state: | 5.9% |
Likely homosexual households (counted as self-reported same-sex unmarried-partner households)
- Lesbian couples: 0.5% of all households
- Gay men: 0.4% of all households
3 people in workers' group living quarters and job corps centers in 2010
145 people in nursing homes in 2000
25 people in other noninstitutional group quarters in 2000
Banks with branches in Riverdale (2011 data):
- Bank of America, National Association: Tri County Station Branch at 2225 Highway 138, branch established on 1990/02/05; Riverdale Branch at 6656 Church Street, branch established on 1974/10/12. Info updated 2009/11/18: Bank assets: $1,451,969.3 mil, Deposits: $1,077,176.8 mil, headquarters in Charlotte, NC, positive income, 5782 total offices, Holding Company: Bank Of America Corporation
- Synovus Bank: Riverdale Branch at 7384 Highway 85, branch established on 1989/10/04. Info updated 2011/01/25: Bank assets: $26,863.3 mil, Deposits: $22,415.0 mil, headquarters in Columbus, GA, positive income, Commercial Lending Specialization, 296 total offices, Holding Company: Synovus Financial Corp.
- Branch Banking and Trust Company: Riverdale Branch at 6375 Highway 85, branch established on 1984/03/17. Info updated 2010/03/29: Bank assets: $168,867.6 mil, Deposits: $127,549.5 mil, headquarters in Winston Salem, NC, positive income, Commercial Lending Specialization, 1793 total offices, Holding Company: Bb&T Corporation
- Wells Fargo Bank, National Association: Riverdale Branch at 6626 Highway 85, branch established on 1969/06/09. Info updated 2011/04/05: Bank assets: $1,161,490.0 mil, Deposits: $905,653.0 mil, headquarters in Sioux Falls, SD, positive income, 6395 total offices, Holding Company: Wells Fargo & Company
- SunTrust Bank: Riverdale Crossing Branch at 7575 Highway 85, branch established on 1997/03/06. Info updated 2010/05/27: Bank assets: $171,291.7 mil, Deposits: $129,833.2 mil, headquarters in Atlanta, GA, positive income, Commercial Lending Specialization, 1716 total offices, Holding Company: Suntrust Banks, Inc.
- JPMorgan Chase Bank, National Association: Merchants Square Branch at 7145 Highway 85, branch established on 2002/07/15. Info updated 2011/11/10: Bank assets: $1,811,678.0 mil, Deposits: $1,190,738.0 mil, headquarters in Columbus, OH, positive income, International Specialization, 5577 total offices, Holding Company: Jpmorgan Chase & Co.
For population 15 years and over in Riverdale:
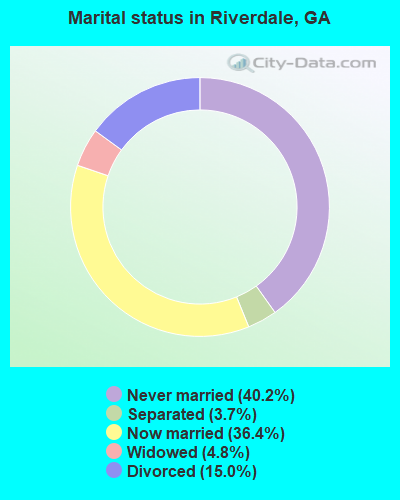
- Never married: 40.2%
- Now married: 36.4%
- Separated: 3.7%
- Widowed: 4.8%
- Divorced: 15.0%
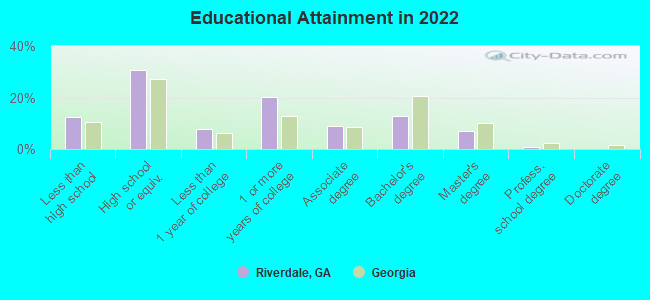
For population 25 years and over in Riverdale:
- High school or higher: 86.9%
- Bachelor's degree or higher: 18.1%
- Graduate or professional degree: 6.5%
- Unemployed: 7.6%
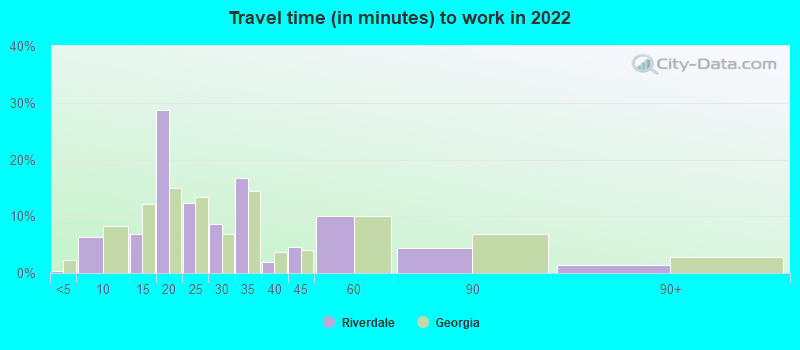
- Mean travel time to work (commute): 28.4 minutes
| Here: | 12.4 |
| Georgia average: | 12.2 |
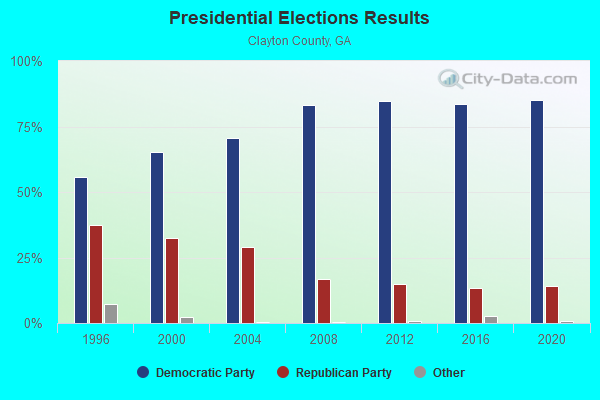
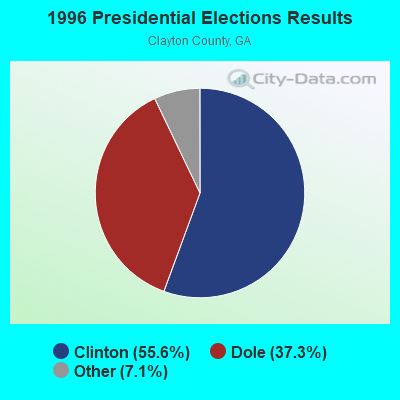
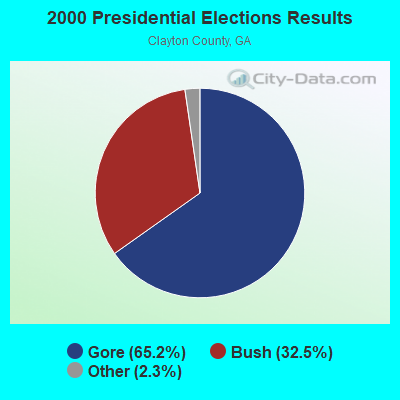

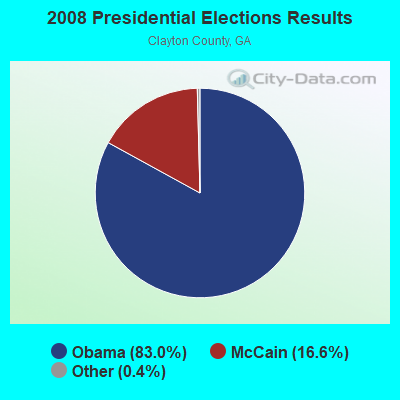
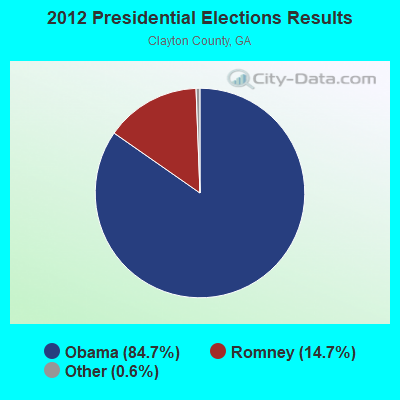

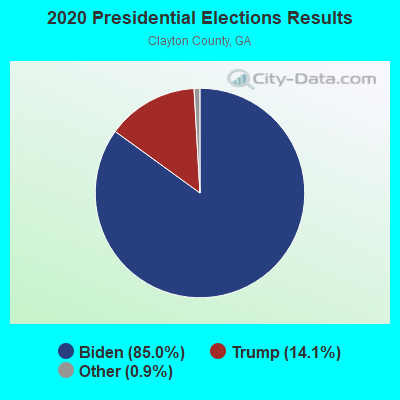
Graphs represent county-level data. Detailed 2008 Election Results
Religion statistics for Riverdale, GA (based on Clayton County data)
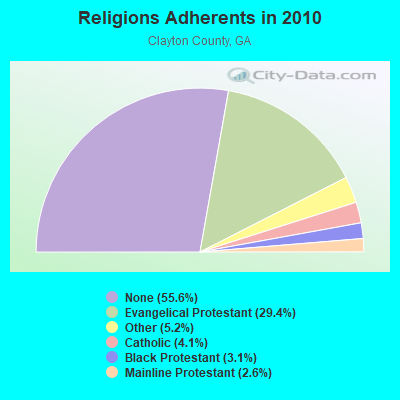
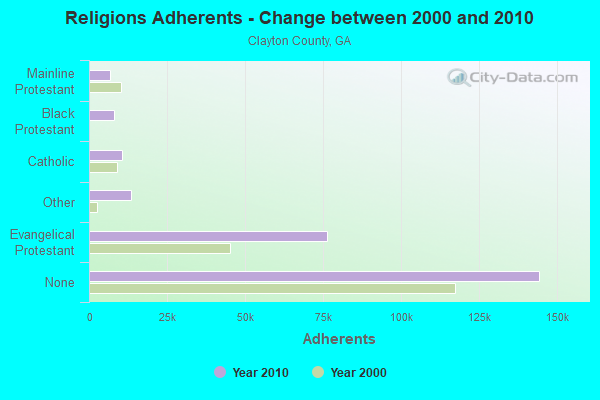
| Religion | Adherents | Congregations |
|---|---|---|
| Evangelical Protestant | 76,232 | 137 |
| Other | 13,503 | 14 |
| Catholic | 10,533 | 3 |
| Black Protestant | 8,125 | 15 |
| Mainline Protestant | 6,695 | 20 |
| None | 144,336 | - |
Food Environment Statistics:
| Clayton County: | 1.81 / 10,000 pop. |
| Georgia: | 1.91 / 10,000 pop. |
| Clayton County: | 0.18 / 10,000 pop. |
| State: | 0.15 / 10,000 pop. |
| Clayton County: | 0.70 / 10,000 pop. |
| State: | 0.86 / 10,000 pop. |
| This county: | 4.72 / 10,000 pop. |
| State: | 5.12 / 10,000 pop. |
| This county: | 4.39 / 10,000 pop. |
| Georgia: | 7.41 / 10,000 pop. |
| This county: | 11.5% |
| Georgia: | 10.4% |
| Clayton County: | 30.7% |
| State: | 27.8% |
Health and Nutrition:
| This city: | 48.4% |
| Georgia: | 48.9% |
| This city: | 47.3% |
| State: | 46.5% |
| Riverdale: | 29.6 |
| Georgia: | 28.9 |
| Riverdale: | 18.3% |
| Georgia: | 20.4% |
| This city: | 13.0% |
| Georgia: | 10.8% |
| This city: | 6.7 |
| Georgia: | 6.7 |
| Riverdale: | 34.0% |
| Georgia: | 33.5% |
| Riverdale: | 55.6% |
| Georgia: | 56.2% |
| Riverdale: | 83.9% |
| Georgia: | 80.8% |
More about Health and Nutrition of Riverdale, GA Residents
| Local government employment and payroll (March 2022) | |||||
| Function | Full-time employees | Monthly full-time payroll | Average yearly full-time wage | Part-time employees | Monthly part-time payroll |
|---|---|---|---|---|---|
| Police Protection - Officers | 39 | $137,480 | $42,302 | 0 | $0 |
| Firefighters | 23 | $76,287 | $39,802 | 0 | $0 |
| Other and Unallocable | 22 | $69,613 | $37,971 | 0 | $0 |
| Parks and Recreation | 13 | $34,329 | $31,688 | 17 | $29,634 |
| Judicial and Legal | 10 | $29,708 | $35,650 | 0 | $0 |
| Financial Administration | 10 | $36,122 | $43,346 | 0 | $0 |
| Fire - Other | 5 | $17,079 | $40,990 | 8 | $7,057 |
| Other Government Administration | 5 | $15,149 | $36,358 | 8 | $6,998 |
| Police - Other | 3 | $8,781 | $35,124 | 0 | $0 |
| Solid Waste Management | 2 | $4,143 | $24,858 | 0 | $0 |
| Totals for Government | 132 | $428,691 | $38,972 | 33 | $43,689 |
Riverdale government finances - Expenditure in 2017 (per resident):
- Construction - General - Other: $1,896,000 ($128.85)
Housing and Community Development: $500,000 ($33.98)
- Current Operations - Police Protection: $4,377,000 ($297.45)
Local Fire Protection: $2,084,000 ($141.62)
Central Staff Services: $1,227,000 ($83.38)
Solid Waste Management: $1,221,000 ($82.98)
General Public Buildings: $1,059,000 ($71.97)
Financial Administration: $1,058,000 ($71.90)
Judicial and Legal Services: $979,000 ($66.53)
Parks and Recreation: $781,000 ($53.08)
Protective Inspection and Regulation - Other: $501,000 ($34.05)
Housing and Community Development: $216,000 ($14.68)
General - Other: $203,000 ($13.80)
Regular Highways: $82,000 ($5.57)
- General - Interest on Debt: $946,000 ($64.29)
- Total Salaries and Wages: $5,811,000 ($394.90)
Riverdale government finances - Revenue in 2017 (per resident):
- Charges - Solid Waste Management: $1,887,000 ($128.24)
Parks and Recreation: $401,000 ($27.25)
Other: $322,000 ($21.88)
- Federal Intergovernmental - Other: $111,000 ($7.54)
- Local Intergovernmental - General Local Government Support: $5,329,000 ($362.15)
Housing and Community Development: $486,000 ($33.03)
Other: $102,000 ($6.93)
- Miscellaneous - Fines and Forfeits: $3,434,000 ($233.37)
Sale of Property: $5,000 ($0.34)
Interest Earnings: $1,000 ($0.07)
- State Intergovernmental - Other: $2,000 ($0.14)
- Tax - Property: $2,642,000 ($179.54)
Public Utilities Sales: $935,000 ($63.54)
Occupation and Business License - Other: $853,000 ($57.97)
Alcoholic Beverage Sales: $438,000 ($29.77)
Other License: $169,000 ($11.48)
Alcoholic Beverage License: $160,000 ($10.87)
Other Selective Sales: $22,000 ($1.50)
Riverdale government finances - Debt in 2017 (per resident):
- Long Term Debt - Beginning Outstanding - Unspecified Public Purpose: $18,470,000 ($1255.18)
Outstanding Unspecified Public Purpose: $16,025,000 ($1089.02)
Retired Unspecified Public Purpose: $2,445,000 ($166.16)
Riverdale government finances - Cash and Securities in 2017 (per resident):
- Other Funds - Cash and Securities: $11,319,000 ($769.22)
12.63% of this county's 2020 resident taxpayers moved to other counties in 2021 ($33,272 average adjusted gross income)
| Here: | 12.63% |
| Georgia average: | 9.60% |
0.02% of residents moved to foreign countries ($53 average AGI)
Clayton County: 0.02% Georgia average: 0.03%
Top counties to which taxpayers relocated from this county between 2020 and 2021:
| to Fulton County, GA | |
| to Henry County, GA | |
| to DeKalb County, GA |
| Businesses in Riverdale, GA | ||||
| Name | Count | Name | Count | |
|---|---|---|---|---|
| AT&T | 1 | Little Caesars Pizza | 1 | |
| Advance Auto Parts | 1 | Lowe's | 1 | |
| AutoZone | 2 | McDonald's | 3 | |
| Baskin-Robbins | 1 | New Balance | 2 | |
| Blockbuster | 1 | Nike | 2 | |
| CVS | 3 | Panda Express | 1 | |
| Chick-Fil-A | 1 | Papa John's Pizza | 1 | |
| Church's Chicken | 1 | Payless | 1 | |
| Circle K | 1 | Penske | 1 | |
| Curves | 1 | Pizza Hut | 2 | |
| Dairy Queen | 1 | Popeyes | 1 | |
| Domino's Pizza | 1 | Publix Super Markets | 1 | |
| Dunkin Donuts | 1 | RadioShack | 1 | |
| FedEx | 2 | Rite Aid | 1 | |
| Firestone Complete Auto Care | 1 | Ryan's Grill | 1 | |
| Foot Locker | 1 | Sleep Inn | 1 | |
| GNC | 1 | Subway | 1 | |
| GameStop | 1 | T-Mobile | 3 | |
| H&R Block | 1 | Taco Bell | 1 | |
| Home Depot | 1 | U-Haul | 3 | |
| Hyundai | 1 | UPS | 1 | |
| IHOP | 1 | Waffle House | 2 | |
| KFC | 1 | Walgreens | 1 | |
| Kroger | 1 | Walmart | 1 | |
Strongest AM radio stations in Riverdale:
- WGST (640 AM; 50 kW; ATLANTA, GA; Owner: CITICASTERS LICENSES, L.P.)
- WGUN (1010 AM; 50 kW; ATLANTA, GA; Owner: WGUN, INC.)
- WAOK (1380 AM; 50 kW; ATLANTA, GA; Owner: INFINITY BROADCASTING OPERATIONS, INC.)
- WSB (750 AM; 50 kW; ATLANTA, GA; Owner: CXR HOLDINGS, INC.)
- WQXI (790 AM; 28 kW; ATLANTA, GA; Owner: JEFFERSON-PILOT COMMUNICATIONS COMPANY OF GEORGIA)
- WMLB (1160 AM; 50 kW; EAST POINT, GA; Owner: ATLANTA AREA BROADCASTING, INC.)
- WCNN (680 AM; 50 kW; NORTH ATLANTA, GA; Owner: DICKEY BROADCASTING COMPANY)
- WSSA (1570 AM; 5 kW; MORROW, GA; Owner: SOUTH ATLANTA BROACASTING, INC.)
- WGKA (1190 AM; 25 kW; ATLANTA, GA; Owner: SALEM MEDIA OF GEORGIA, INC.)
- WAZX (1550 AM; 50 kW; SMYRNA, GA; Owner: GA-MEX BROADCASTING, INC.)
- WTJH (1260 AM; 5 kW; EAST POINT, GA; Owner: WILLIS BROADCASTING CORPORATION)
- WFTD (1080 AM; daytime; 50 kW; MARIETTA, GA; Owner: PRIETO ENTERPRISES, INC.)
- WAEC (860 AM; 5 kW; ATLANTA, GA; Owner: WAEC LICENSE LIMITED PARTNERSHIP)
Strongest FM radio stations in Riverdale:
- WRFG (89.3 FM; ATLANTA, GA; Owner: RADIO FREE GEORGIA BROADCASTING FOUNDATION INC)
- WWWQ (100.5 FM; ANNISTON, AL; Owner: WNNX LICO, INC.)
- WNNX (99.7 FM; ATLANTA, GA; Owner: WNNX LICO, INC.)
- WHTA (107.9 FM; HAMPTON, GA; Owner: RADIO ONE LICENSES, LLC)
- WSB-FM (98.5 FM; ATLANTA, GA; Owner: CXR HOLDINGS, INC.)
- WSTR (94.1 FM; SMYRNA, GA; Owner: JEFFERSON-PILOT COMMUNICATIONS COMPANY OF GEORGIA)
- WVEE (103.3 FM; ATLANTA, GA; Owner: INFINITY BROADCASTING OPERATIONS, INC.)
- WZGC (92.9 FM; ATLANTA, GA; Owner: INFINITY BROADCASTING CORP. OF ATLANTA)
- WPZE (97.5 FM; FAYETTEVILLE, GA; Owner: ROA LICENSES, LLC)
- WKHX-FM (101.5 FM; MARIETTA, GA; Owner: ABC, INC.)
- WKLS (96.1 FM; ATLANTA, GA; Owner: CITICASTERS LICENSES, L.P.)
- WLTM (94.9 FM; ATLANTA, GA; Owner: CITICASTERS LICENSES, L.P.)
- WAMJ (102.5 FM; MABLETON, GA; Owner: NEW MABLETON BROADCASTING CORPORATION)
- WRAS (88.5 FM; ATLANTA, GA; Owner: GEORGIA STATE UNIVERSITY)
- WABE (90.1 FM; ATLANTA, GA; Owner: BOARD OF EDUCATION, CITY OF ATLANTA)
- WALR-FM (104.1 FM; LA GRANGE, GA; Owner: CXR HOLDINGS, INC.)
- WCLK (91.9 FM; ATLANTA, GA; Owner: CLARK ATLANTA UNIVERSITY)
- WBZY-FM (96.7 FM; PEACHTREE CITY, GA; Owner: CITICASTERS LICENSES, L.P.)
- WFSH-FM (104.7 FM; ATHENS, GA; Owner: SOUTH TEXAS BROADCASTING, INC.)
- WREK (91.1 FM; ATLANTA, GA; Owner: RADIO COMMNS. BD, GEORGIA INST. TECH)
TV broadcast stations around Riverdale:
- WSB-TV (Channel 2; ATLANTA, GA; Owner: WSB-TV HOLDINGS, INC.)
- WXIA-TV (Channel 11; ATLANTA, GA; Owner: GANNETT GEORGIA, L.P.)
- WHSG (Channel 63; MONROE, GA; Owner: TRINITY BROADCASTING NETWORK)
- WUVG (Channel 34; ATHENS, GA; Owner: UNIVISION ATLANTA LLC)
- WUPA (Channel 69; ATLANTA, GA; Owner: VIACOM STATIONS GROUP OF ATLANTA INC.)
- WAGA (Channel 5; ATLANTA, GA; Owner: FOX TELEVISION STATIONS, INC.)
- WPBA (Channel 30; ATLANTA, GA; Owner: BOARD OF EDUCATION OF THE CITY OF ATLANTA)
- WANN-LP (Channel 32; ATLANTA, GA; Owner: PRISM BROADCASTING NETWORK, INC.)
- WDTA-LP (Channel 53; FAYETTEVILLE, GA; Owner: WORD OF GOD FELLOWSHIP, INC.)
- WTBS (Channel 17; ATLANTA, GA; Owner: SUPERSTATION, INC.)
- WATL (Channel 36; ATLANTA, GA; Owner: WATL, LLC)
- WGCL-TV (Channel 46; ATLANTA, GA; Owner: MEREDITH CORPORATION)
- WANX-LP (Channel 26; ATLANTA, GA; Owner: PRISM BROADCASTING NETWORK, INC.)
- WTHC-LP (Channel 42; ATLANTA, GA; Owner: THE ATLANTA CHANNEL, INC.)
- WIRE-CA (Channel 40; ATLANTA, GA; Owner: COMMERCIAL BROADCASTING CORP.)
- W04DB (Channel 4; ATLANTA, GA; Owner: VVILPTV, INC.)
- W24AL (Channel 24; ATLANTA, GA; Owner: VENTANA TELEVISION, INC.)
- WATC (Channel 57; ATLANTA, GA; Owner: COMMUNITY TELEVISION, INC.)
- W52CL (Channel 52; MACON, GA; Owner: TRINITY BROADCASTING NETWORK)
- WSKC-LP (Channel 59; ATLANTA, GA; Owner: KM LPTV OF ATLANTA, L.L.C.)
- WGTV (Channel 8; ATHENS, GA; Owner: GEORGIA PUBLIC TELECOMMUNICATIONS COMMISSION)
- National Bridge Inventory (NBI) Statistics
- 19Number of bridges
- 190ft / 57.7mTotal length
- $55,664,000Total costs
- 254,980Total average daily traffic
- 2,734Total average daily truck traffic

- New bridges - historical statistics
- 31950-1959
- 51960-1969
- 21970-1979
- 11980-1989
- 31990-1999
- 12010-2019
- 22020-2022
FCC Registered Antenna Towers:
171 (See the full list of FCC Registered Antenna Towers in Riverdale)FCC Registered Private Land Mobile Towers:
7 (See the full list of FCC Registered Private Land Mobile Towers in Riverdale, GA)FCC Registered Broadcast Land Mobile Towers:
12 (See the full list of FCC Registered Broadcast Land Mobile Towers)FCC Registered Microwave Towers:
35 (See the full list of FCC Registered Microwave Towers in this town)FCC Registered Paging Towers:
3 (See the full list of FCC Registered Paging Towers)FCC Registered Amateur Radio Licenses:
61 (See the full list of FCC Registered Amateur Radio Licenses in Riverdale)FAA Registered Aircraft:
3- Aircraft: CESSNA 177 (Category: Land, Seats: 4, Weight: Up to 12,499 Pounds, Speed: 108 mph), Engine: LYCOMING 0-320 SERIES (180 HP) (Reciprocating)
N-Number: 2809X, N2809X, N-2809X, Serial Number: 17700209, Year manufactured: 1967, Airworthiness Date: 10/26/1967, Certificate Issue Date: 01/12/1996
Registrant (Individual): Jim J Guckian, 6264 Willowbrook Drive, Riverdale, GA 30296 - Aircraft: STINSON 108-3 (Category: Land, Seats: 4, Weight: Up to 12,499 Pounds, Speed: 94 mph), Engine: FRANKLIN 6A4165 SERIES (165 HP) (Reciprocating)
N-Number: 3965C, N3965C, N-3965C, Serial Number: 108-4849, Year manufactured: 1949, Airworthiness Date: 11/18/1955, Certificate Issue Date: 09/13/1984
Registrant (Co-Owned): Kent W Beneigh, 1791 Cherokee Way, Riverdale, GA 30296, Other Owners: Karen J Beneigh - Aircraft: DJI PHANTOM 2 (Category: Land, Engines: 4), Engine: Electric
N-Number: 108FD, N108FD, N-108FD, Serial Number: PH645135769, Certificate Issue Date: 08/31/2016
Registrant (Government): Clayton County Fire & Emergency Service, 7810 Highway 85, Riverdale, GA 30274
Deregistered: Cancel Date: 11/29/2019
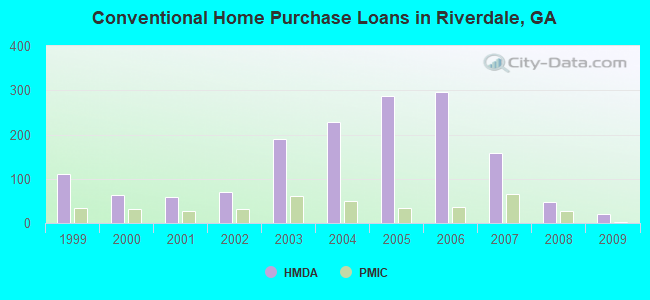
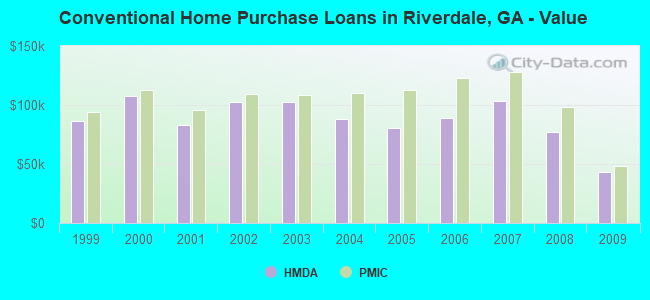
| Home Mortgage Disclosure Act Aggregated Statistics For Year 2009 (Based on 6 partial tracts) | ||||||||||||
| A) FHA, FSA/RHS & VA Home Purchase Loans | B) Conventional Home Purchase Loans | C) Refinancings | D) Home Improvement Loans | E) Loans on Dwellings For 5+ Families | F) Non-occupant Loans on < 5 Family Dwellings (A B C & D) | |||||||
|---|---|---|---|---|---|---|---|---|---|---|---|---|
| Number | Average Value | Number | Average Value | Number | Average Value | Number | Average Value | Number | Average Value | Number | Average Value | |
| LOANS ORIGINATED | 34 | $77,116 | 21 | $43,260 | 70 | $117,195 | 3 | $22,957 | 1 | $570,410 | 20 | $52,179 |
| APPLICATIONS APPROVED, NOT ACCEPTED | 4 | $113,045 | 2 | $79,265 | 15 | $123,735 | 1 | $69,050 | 0 | $0 | 1 | $90,180 |
| APPLICATIONS DENIED | 12 | $84,266 | 13 | $57,322 | 90 | $102,644 | 13 | $21,505 | 0 | $0 | 16 | $57,489 |
| APPLICATIONS WITHDRAWN | 8 | $98,808 | 10 | $60,062 | 51 | $112,439 | 3 | $29,837 | 0 | $0 | 7 | $68,691 |
| FILES CLOSED FOR INCOMPLETENESS | 3 | $79,020 | 2 | $57,670 | 12 | $111,877 | 1 | $54,380 | 0 | $0 | 2 | $43,765 |
Detailed HMDA statistics for the following Tracts: 0405.03 , 0405.06, 0405.10, 0405.12, 0405.16
| Private Mortgage Insurance Companies Aggregated Statistics For Year 2009 (Based on 6 partial tracts) | ||||||
| A) Conventional Home Purchase Loans | B) Refinancings | C) Non-occupant Loans on < 5 Family Dwellings (A & B) | ||||
|---|---|---|---|---|---|---|
| Number | Average Value | Number | Average Value | Number | Average Value | |
| LOANS ORIGINATED | 3 | $48,500 | 1 | $50,670 | 0 | $0 |
| APPLICATIONS APPROVED, NOT ACCEPTED | 1 | $152,270 | 2 | $95,745 | 0 | $0 |
| APPLICATIONS DENIED | 0 | $0 | 1 | $103,240 | 0 | $0 |
| APPLICATIONS WITHDRAWN | 1 | $56,090 | 0 | $0 | 0 | $0 |
| FILES CLOSED FOR INCOMPLETENESS | 1 | $164,550 | 0 | $0 | 1 | $164,550 |
Detailed PMIC statistics for the following Tracts: 0405.03 , 0405.06, 0405.10, 0405.12, 0405.16
2005 - 2018 National Fire Incident Reporting System (NFIRS) incidents
- Fire incident types reported to NFIRS in Riverdale, GA
- 1,28942.8%Outside Fires
- 1,22040.5%Structure Fires
- 46415.4%Mobile Property/Vehicle Fires
- 371.2%Other
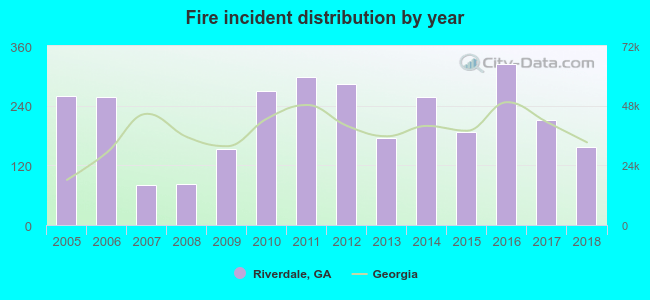 Based on the data from the years 2005 - 2018 the average number of fire incidents per year is 214. The highest number of reported fire incidents - 324 took place in 2016, and the least - 80 in 2007. The data has a declining trend.
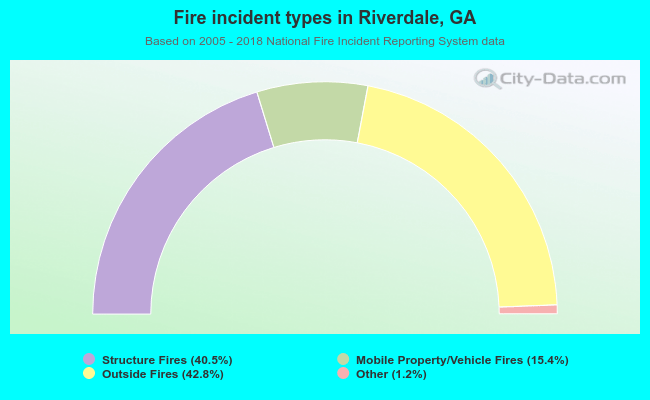 When looking into fire subcategories, the most incidents belonged to: Outside Fires (42.8%), and Structure Fires (40.5%).
Fire-safe hotels and motels in Riverdale, Georgia:
- Extended Stay America, 6231 Hwy 85, Riverdale, Georgia 30274 , Phone: (770) 997-0100, Fax: (770) 997-1685
- Sleep Inn, 6286 Ga Hwy 85, Riverdale, Georgia 30274 , Phone: (678) 612-1300
| Most common first names in Riverdale, GA among deceased individuals | ||
| Name | Count | Lived (average) |
|---|---|---|
| James | 172 | 68.3 years |
| William | 135 | 70.5 years |
| John | 127 | 71.4 years |
| Mary | 125 | 76.6 years |
| Robert | 109 | 66.1 years |
| Charles | 72 | 67.9 years |
| Thomas | 50 | 70.7 years |
| George | 50 | 69.3 years |
| Willie | 50 | 73.6 years |
| Annie | 48 | 79.0 years |
| Most common last names in Riverdale, GA among deceased individuals | ||
| Last name | Count | Lived (average) |
|---|---|---|
| Smith | 79 | 72.0 years |
| Williams | 58 | 67.6 years |
| Brown | 55 | 68.7 years |
| Jones | 50 | 71.2 years |
| Johnson | 48 | 68.4 years |
| Davis | 39 | 65.8 years |
| Harris | 37 | 71.4 years |
| Jackson | 32 | 65.6 years |
| Thompson | 31 | 68.9 years |
| Martin | 27 | 69.1 years |
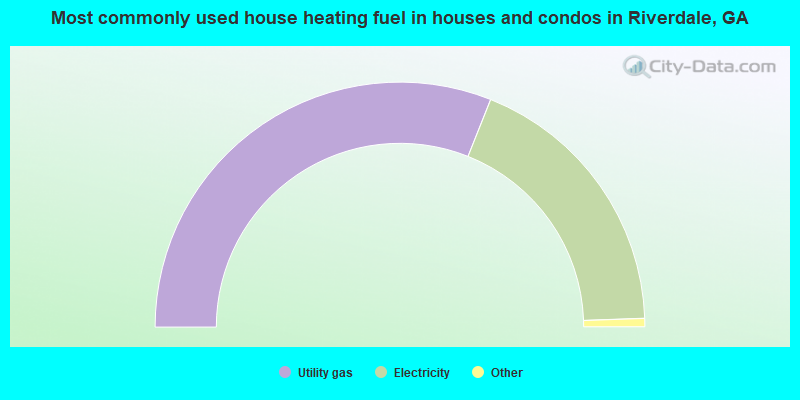
- 62.1%Utility gas
- 36.8%Electricity
- 0.7%Wood
- 0.2%Fuel oil, kerosene, etc.
- 0.2%No fuel used
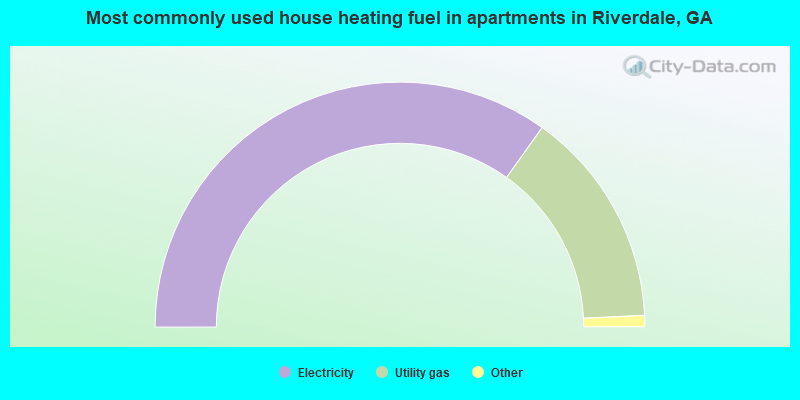
- 69.8%Electricity
- 28.8%Utility gas
- 1.3%No fuel used
- 0.2%Bottled, tank, or LP gas
Riverdale compared to Georgia state average:
- Median house value below state average.
- Unemployed percentage below state average.
- Black race population percentage significantly above state average.
- Hispanic race population percentage below state average.
- Median age below state average.
- Foreign-born population percentage above state average.
- Length of stay since moving in significantly above state average.
Riverdale on our top lists:
- #29 on the list of "Top 101 cities with largest percentage of males in occupations: material moving occupations (population 5,000+)"
- #31 on the list of "Top 101 cities with largest percentage of females in industries: transportation and warehousing (population 5,000+)"
- #41 on the list of "Top 101 cities with the most residents born in Nigeria (population 500+)"
- #45 on the list of "Top 101 cities with the most residents born in Cambodia (population 500+)"
- #50 on the list of "Top 101 cities with the most residents born in Other Caribbean (population 500+)"
- #37 (30274) on the list of "Top 101 zip codes with the lowest 2012 average reported profit/loss from business (pop 5,000+)"
- #78 (30296) on the list of "Top 101 zip codes with the largest percentage of Subsaharan African first ancestries"
- #6 on the list of "Top 101 counties with the smallest number of people without health insurance coverage in 2000 (pop. 50,000+)"
- #9 on the list of "Top 101 counties with highest percentage of residents voting for Obama (Democrat) in the 2012 Presidential Election (pop. 50,000+)"
- #11 on the list of "Top 101 counties with the highest percentage of residents relocating to other counties in 2011 (pop. 50,000+)"
- #11 on the list of "Top 101 counties with the lowest ground withdrawal of fresh water for public supply"
- #12 on the list of "Top 101 counties with the highest percentage of residents relocating from other counties between 2010 and 2011 (pop. 50,000+)"

|
|
Total of 22 patent applications in 2008-2024.