Rio Rancho, New Mexico Submit your own pictures of this city and show them to the world
OSM Map
General Map
Google Map
MSN Map
OSM Map
General Map
Google Map
MSN Map
OSM Map
General Map
Google Map
MSN Map
OSM Map
General Map
Google Map
MSN Map
Please wait while loading the map...
Population in 2022: 108,082 (99% urban, 1% rural). Population change since 2000: +108.8%Males: 53,734 Females: 54,348
March 2022 cost of living index in Rio Rancho: 95.2 (less than average, U.S. average is 100) Percentage of residents living in poverty in 2022: 7.7%for White Non-Hispanic residents , 8.5% for Black residents , 9.3% for Hispanic or Latino residents , 2.7% for American Indian residents , 14.1% for other race residents , 9.3% for two or more races residents )
Profiles of local businesses
Business Search - 14 Million verified businesses
Data:
Median household income ($)
Median household income (% change since 2000)
Household income diversity
Ratio of average income to average house value (%)
Ratio of average income to average rent
Median household income ($) - White
Median household income ($) - Black or African American
Median household income ($) - Asian
Median household income ($) - Hispanic or Latino
Median household income ($) - American Indian and Alaska Native
Median household income ($) - Multirace
Median household income ($) - Other Race
Median household income for houses/condos with a mortgage ($)
Median household income for apartments without a mortgage ($)
Races - White alone (%)
Races - White alone (% change since 2000)
Races - Black alone (%)
Races - Black alone (% change since 2000)
Races - American Indian alone (%)
Races - American Indian alone (% change since 2000)
Races - Asian alone (%)
Races - Asian alone (% change since 2000)
Races - Hispanic (%)
Races - Hispanic (% change since 2000)
Races - Native Hawaiian and Other Pacific Islander alone (%)
Races - Native Hawaiian and Other Pacific Islander alone (% change since 2000)
Races - Two or more races (%)
Races - Two or more races (% change since 2000)
Races - Other race alone (%)
Races - Other race alone (% change since 2000)
Racial diversity
Unemployment (%)
Unemployment (% change since 2000)
Unemployment (%) - White
Unemployment (%) - Black or African American
Unemployment (%) - Asian
Unemployment (%) - Hispanic or Latino
Unemployment (%) - American Indian and Alaska Native
Unemployment (%) - Multirace
Unemployment (%) - Other Race
Population density (people per square mile)
Population - Males (%)
Population - Females (%)
Population - Males (%) - White
Population - Males (%) - Black or African American
Population - Males (%) - Asian
Population - Males (%) - Hispanic or Latino
Population - Males (%) - American Indian and Alaska Native
Population - Males (%) - Multirace
Population - Males (%) - Other Race
Population - Females (%) - White
Population - Females (%) - Black or African American
Population - Females (%) - Asian
Population - Females (%) - Hispanic or Latino
Population - Females (%) - American Indian and Alaska Native
Population - Females (%) - Multirace
Population - Females (%) - Other Race
Coronavirus confirmed cases (Jun 05, 2024)
Deaths caused by coronavirus (Jun 05, 2024)
Coronavirus confirmed cases (per 100k population) (Jun 05, 2024)
Deaths caused by coronavirus (per 100k population) (Jun 05, 2024)
Daily increase in number of cases (Jun 05, 2024)
Weekly increase in number of cases (Jun 05, 2024)
Cases doubled (in days) (Jun 05, 2024)
Hospitalized patients (Apr 18, 2022)
Negative test results (Apr 18, 2022)
Total test results (Apr 18, 2022)
COVID Vaccine doses distributed (per 100k population) (Sep 19, 2023)
COVID Vaccine doses administered (per 100k population) (Sep 19, 2023)
COVID Vaccine doses distributed (Sep 19, 2023)
COVID Vaccine doses administered (Sep 19, 2023)
Likely homosexual households (%)
Likely homosexual households (% change since 2000)
Likely homosexual households - Lesbian couples (%)
Likely homosexual households - Lesbian couples (% change since 2000)
Likely homosexual households - Gay men (%)
Likely homosexual households - Gay men (% change since 2000)
Cost of living index
Median gross rent ($)
Median contract rent ($)
Median monthly housing costs ($)
Median house or condo value ($)
Median house or condo value ($ change since 2000)
Mean house or condo value by units in structure - 1, detached ($)
Mean house or condo value by units in structure - 1, attached ($)
Mean house or condo value by units in structure - 2 ($)
Mean house or condo value by units in structure by units in structure - 3 or 4 ($)
Mean house or condo value by units in structure - 5 or more ($)
Mean house or condo value by units in structure - Boat, RV, van, etc. ($)
Mean house or condo value by units in structure - Mobile home ($)
Median house or condo value ($) - White
Median house or condo value ($) - Black or African American
Median house or condo value ($) - Asian
Median house or condo value ($) - Hispanic or Latino
Median house or condo value ($) - American Indian and Alaska Native
Median house or condo value ($) - Multirace
Median house or condo value ($) - Other Race
Median resident age
Resident age diversity
Median resident age - Males
Median resident age - Females
Median resident age - White
Median resident age - Black or African American
Median resident age - Asian
Median resident age - Hispanic or Latino
Median resident age - American Indian and Alaska Native
Median resident age - Multirace
Median resident age - Other Race
Median resident age - Males - White
Median resident age - Males - Black or African American
Median resident age - Males - Asian
Median resident age - Males - Hispanic or Latino
Median resident age - Males - American Indian and Alaska Native
Median resident age - Males - Multirace
Median resident age - Males - Other Race
Median resident age - Females - White
Median resident age - Females - Black or African American
Median resident age - Females - Asian
Median resident age - Females - Hispanic or Latino
Median resident age - Females - American Indian and Alaska Native
Median resident age - Females - Multirace
Median resident age - Females - Other Race
Commute - mean travel time to work (minutes)
Travel time to work - Less than 5 minutes (%)
Travel time to work - Less than 5 minutes (% change since 2000)
Travel time to work - 5 to 9 minutes (%)
Travel time to work - 5 to 9 minutes (% change since 2000)
Travel time to work - 10 to 19 minutes (%)
Travel time to work - 10 to 19 minutes (% change since 2000)
Travel time to work - 20 to 29 minutes (%)
Travel time to work - 20 to 29 minutes (% change since 2000)
Travel time to work - 30 to 39 minutes (%)
Travel time to work - 30 to 39 minutes (% change since 2000)
Travel time to work - 40 to 59 minutes (%)
Travel time to work - 40 to 59 minutes (% change since 2000)
Travel time to work - 60 to 89 minutes (%)
Travel time to work - 60 to 89 minutes (% change since 2000)
Travel time to work - 90 or more minutes (%)
Travel time to work - 90 or more minutes (% change since 2000)
Marital status - Never married (%)
Marital status - Now married (%)
Marital status - Separated (%)
Marital status - Widowed (%)
Marital status - Divorced (%)
Median family income ($)
Median family income (% change since 2000)
Median non-family income ($)
Median non-family income (% change since 2000)
Median per capita income ($)
Median per capita income (% change since 2000)
Median family income ($) - White
Median family income ($) - Black or African American
Median family income ($) - Asian
Median family income ($) - Hispanic or Latino
Median family income ($) - American Indian and Alaska Native
Median family income ($) - Multirace
Median family income ($) - Other Race
Median year house/condo built
Median year apartment built
Year house built - Built 2005 or later (%)
Year house built - Built 2000 to 2004 (%)
Year house built - Built 1990 to 1999 (%)
Year house built - Built 1980 to 1989 (%)
Year house built - Built 1970 to 1979 (%)
Year house built - Built 1960 to 1969 (%)
Year house built - Built 1950 to 1959 (%)
Year house built - Built 1940 to 1949 (%)
Year house built - Built 1939 or earlier (%)
Average household size
Household density (households per square mile)
Average household size - White
Average household size - Black or African American
Average household size - Asian
Average household size - Hispanic or Latino
Average household size - American Indian and Alaska Native
Average household size - Multirace
Average household size - Other Race
Occupied housing units (%)
Vacant housing units (%)
Owner occupied housing units (%)
Renter occupied housing units (%)
Vacancy status - For rent (%)
Vacancy status - For sale only (%)
Vacancy status - Rented or sold, not occupied (%)
Vacancy status - For seasonal, recreational, or occasional use (%)
Vacancy status - For migrant workers (%)
Vacancy status - Other vacant (%)
Residents with income below the poverty level (%)
Residents with income below 50% of the poverty level (%)
Children below poverty level (%)
Poor families by family type - Married-couple family (%)
Poor families by family type - Male, no wife present (%)
Poor families by family type - Female, no husband present (%)
Poverty status for native-born residents (%)
Poverty status for foreign-born residents (%)
Poverty among high school graduates not in families (%)
Poverty among people who did not graduate high school not in families (%)
Residents with income below the poverty level (%) - White
Residents with income below the poverty level (%) - Black or African American
Residents with income below the poverty level (%) - Asian
Residents with income below the poverty level (%) - Hispanic or Latino
Residents with income below the poverty level (%) - American Indian and Alaska Native
Residents with income below the poverty level (%) - Multirace
Residents with income below the poverty level (%) - Other Race
Air pollution - Air Quality Index (AQI)
Air pollution - CO
Air pollution - NO2
Air pollution - SO2
Air pollution - Ozone
Air pollution - PM10
Air pollution - PM25
Air pollution - Pb
Crime - Murders per 100,000 population
Crime - Rapes per 100,000 population
Crime - Robberies per 100,000 population
Crime - Assaults per 100,000 population
Crime - Burglaries per 100,000 population
Crime - Thefts per 100,000 population
Crime - Auto thefts per 100,000 population
Crime - Arson per 100,000 population
Crime - City-data.com crime index
Crime - Violent crime index
Crime - Property crime index
Crime - Murders per 100,000 population (5 year average)
Crime - Rapes per 100,000 population (5 year average)
Crime - Robberies per 100,000 population (5 year average)
Crime - Assaults per 100,000 population (5 year average)
Crime - Burglaries per 100,000 population (5 year average)
Crime - Thefts per 100,000 population (5 year average)
Crime - Auto thefts per 100,000 population (5 year average)
Crime - Arson per 100,000 population (5 year average)
Crime - City-data.com crime index (5 year average)
Crime - Violent crime index (5 year average)
Crime - Property crime index (5 year average)
1996 Presidential Elections Results (%) - Democratic Party (Clinton)
1996 Presidential Elections Results (%) - Republican Party (Dole)
1996 Presidential Elections Results (%) - Other
2000 Presidential Elections Results (%) - Democratic Party (Gore)
2000 Presidential Elections Results (%) - Republican Party (Bush)
2000 Presidential Elections Results (%) - Other
2004 Presidential Elections Results (%) - Democratic Party (Kerry)
2004 Presidential Elections Results (%) - Republican Party (Bush)
2004 Presidential Elections Results (%) - Other
2008 Presidential Elections Results (%) - Democratic Party (Obama)
2008 Presidential Elections Results (%) - Republican Party (McCain)
2008 Presidential Elections Results (%) - Other
2012 Presidential Elections Results (%) - Democratic Party (Obama)
2012 Presidential Elections Results (%) - Republican Party (Romney)
2012 Presidential Elections Results (%) - Other
2016 Presidential Elections Results (%) - Democratic Party (Clinton)
2016 Presidential Elections Results (%) - Republican Party (Trump)
2016 Presidential Elections Results (%) - Other
2020 Presidential Elections Results (%) - Democratic Party (Biden)
2020 Presidential Elections Results (%) - Republican Party (Trump)
2020 Presidential Elections Results (%) - Other
Ancestries Reported - Arab (%)
Ancestries Reported - Czech (%)
Ancestries Reported - Danish (%)
Ancestries Reported - Dutch (%)
Ancestries Reported - English (%)
Ancestries Reported - French (%)
Ancestries Reported - French Canadian (%)
Ancestries Reported - German (%)
Ancestries Reported - Greek (%)
Ancestries Reported - Hungarian (%)
Ancestries Reported - Irish (%)
Ancestries Reported - Italian (%)
Ancestries Reported - Lithuanian (%)
Ancestries Reported - Norwegian (%)
Ancestries Reported - Polish (%)
Ancestries Reported - Portuguese (%)
Ancestries Reported - Russian (%)
Ancestries Reported - Scotch-Irish (%)
Ancestries Reported - Scottish (%)
Ancestries Reported - Slovak (%)
Ancestries Reported - Subsaharan African (%)
Ancestries Reported - Swedish (%)
Ancestries Reported - Swiss (%)
Ancestries Reported - Ukrainian (%)
Ancestries Reported - United States (%)
Ancestries Reported - Welsh (%)
Ancestries Reported - West Indian (%)
Ancestries Reported - Other (%)
Educational Attainment - No schooling completed (%)
Educational Attainment - Less than high school (%)
Educational Attainment - High school or equivalent (%)
Educational Attainment - Less than 1 year of college (%)
Educational Attainment - 1 or more years of college (%)
Educational Attainment - Associate degree (%)
Educational Attainment - Bachelor's degree (%)
Educational Attainment - Master's degree (%)
Educational Attainment - Professional school degree (%)
Educational Attainment - Doctorate degree (%)
School Enrollment - Nursery, preschool (%)
School Enrollment - Kindergarten (%)
School Enrollment - Grade 1 to 4 (%)
School Enrollment - Grade 5 to 8 (%)
School Enrollment - Grade 9 to 12 (%)
School Enrollment - College undergrad (%)
School Enrollment - Graduate or professional (%)
School Enrollment - Not enrolled in school (%)
School enrollment - Public schools (%)
School enrollment - Private schools (%)
School enrollment - Not enrolled (%)
Median number of rooms in houses and condos
Median number of rooms in apartments
Housing units lacking complete plumbing facilities (%)
Housing units lacking complete kitchen facilities (%)
Density of houses
Urban houses (%)
Rural houses (%)
Households with people 60 years and over (%)
Households with people 65 years and over (%)
Households with people 75 years and over (%)
Households with one or more nonrelatives (%)
Households with no nonrelatives (%)
Population in households (%)
Family households (%)
Nonfamily households (%)
Population in families (%)
Family households with own children (%)
Median number of bedrooms in owner occupied houses
Mean number of bedrooms in owner occupied houses
Median number of bedrooms in renter occupied houses
Mean number of bedrooms in renter occupied houses
Median number of vehichles in owner occupied houses
Mean number of vehichles in owner occupied houses
Median number of vehichles in renter occupied houses
Mean number of vehichles in renter occupied houses
Mortgage status - with mortgage (%)
Mortgage status - with second mortgage (%)
Mortgage status - with home equity loan (%)
Mortgage status - with both second mortgage and home equity loan (%)
Mortgage status - without a mortgage (%)
Average family size
Average family size - White
Average family size - Black or African American
Average family size - Asian
Average family size - Hispanic or Latino
Average family size - American Indian and Alaska Native
Average family size - Multirace
Average family size - Other Race
Geographical mobility - Same house 1 year ago (%)
Geographical mobility - Moved within same county (%)
Geographical mobility - Moved from different county within same state (%)
Geographical mobility - Moved from different state (%)
Geographical mobility - Moved from abroad (%)
Place of birth - Born in state of residence (%)
Place of birth - Born in other state (%)
Place of birth - Native, outside of US (%)
Place of birth - Foreign born (%)
Housing units in structures - 1, detached (%)
Housing units in structures - 1, attached (%)
Housing units in structures - 2 (%)
Housing units in structures - 3 or 4 (%)
Housing units in structures - 5 to 9 (%)
Housing units in structures - 10 to 19 (%)
Housing units in structures - 20 to 49 (%)
Housing units in structures - 50 or more (%)
Housing units in structures - Mobile home (%)
Housing units in structures - Boat, RV, van, etc. (%)
House/condo owner moved in on average (years ago)
Renter moved in on average (years ago)
Year householder moved into unit - Moved in 1999 to March 2000 (%)
Year householder moved into unit - Moved in 1995 to 1998 (%)
Year householder moved into unit - Moved in 1990 to 1994 (%)
Year householder moved into unit - Moved in 1980 to 1989 (%)
Year householder moved into unit - Moved in 1970 to 1979 (%)
Year householder moved into unit - Moved in 1969 or earlier (%)
Means of transportation to work - Drove car alone (%)
Means of transportation to work - Carpooled (%)
Means of transportation to work - Public transportation (%)
Means of transportation to work - Bus or trolley bus (%)
Means of transportation to work - Streetcar or trolley car (%)
Means of transportation to work - Subway or elevated (%)
Means of transportation to work - Railroad (%)
Means of transportation to work - Ferryboat (%)
Means of transportation to work - Taxicab (%)
Means of transportation to work - Motorcycle (%)
Means of transportation to work - Bicycle (%)
Means of transportation to work - Walked (%)
Means of transportation to work - Other means (%)
Working at home (%)
Industry diversity
Most Common Industries - Agriculture, forestry, fishing and hunting, and mining (%)
Most Common Industries - Agriculture, forestry, fishing and hunting (%)
Most Common Industries - Mining, quarrying, and oil and gas extraction (%)
Most Common Industries - Construction (%)
Most Common Industries - Manufacturing (%)
Most Common Industries - Wholesale trade (%)
Most Common Industries - Retail trade (%)
Most Common Industries - Transportation and warehousing, and utilities (%)
Most Common Industries - Transportation and warehousing (%)
Most Common Industries - Utilities (%)
Most Common Industries - Information (%)
Most Common Industries - Finance and insurance, and real estate and rental and leasing (%)
Most Common Industries - Finance and insurance (%)
Most Common Industries - Real estate and rental and leasing (%)
Most Common Industries - Professional, scientific, and management, and administrative and waste management services (%)
Most Common Industries - Professional, scientific, and technical services (%)
Most Common Industries - Management of companies and enterprises (%)
Most Common Industries - Administrative and support and waste management services (%)
Most Common Industries - Educational services, and health care and social assistance (%)
Most Common Industries - Educational services (%)
Most Common Industries - Health care and social assistance (%)
Most Common Industries - Arts, entertainment, and recreation, and accommodation and food services (%)
Most Common Industries - Arts, entertainment, and recreation (%)
Most Common Industries - Accommodation and food services (%)
Most Common Industries - Other services, except public administration (%)
Most Common Industries - Public administration (%)
Occupation diversity
Most Common Occupations - Management, business, science, and arts occupations (%)
Most Common Occupations - Management, business, and financial occupations (%)
Most Common Occupations - Management occupations (%)
Most Common Occupations - Business and financial operations occupations (%)
Most Common Occupations - Computer, engineering, and science occupations (%)
Most Common Occupations - Computer and mathematical occupations (%)
Most Common Occupations - Architecture and engineering occupations (%)
Most Common Occupations - Life, physical, and social science occupations (%)
Most Common Occupations - Education, legal, community service, arts, and media occupations (%)
Most Common Occupations - Community and social service occupations (%)
Most Common Occupations - Legal occupations (%)
Most Common Occupations - Education, training, and library occupations (%)
Most Common Occupations - Arts, design, entertainment, sports, and media occupations (%)
Most Common Occupations - Healthcare practitioners and technical occupations (%)
Most Common Occupations - Health diagnosing and treating practitioners and other technical occupations (%)
Most Common Occupations - Health technologists and technicians (%)
Most Common Occupations - Service occupations (%)
Most Common Occupations - Healthcare support occupations (%)
Most Common Occupations - Protective service occupations (%)
Most Common Occupations - Fire fighting and prevention, and other protective service workers including supervisors (%)
Most Common Occupations - Law enforcement workers including supervisors (%)
Most Common Occupations - Food preparation and serving related occupations (%)
Most Common Occupations - Building and grounds cleaning and maintenance occupations (%)
Most Common Occupations - Personal care and service occupations (%)
Most Common Occupations - Sales and office occupations (%)
Most Common Occupations - Sales and related occupations (%)
Most Common Occupations - Office and administrative support occupations (%)
Most Common Occupations - Natural resources, construction, and maintenance occupations (%)
Most Common Occupations - Farming, fishing, and forestry occupations (%)
Most Common Occupations - Construction and extraction occupations (%)
Most Common Occupations - Installation, maintenance, and repair occupations (%)
Most Common Occupations - Production, transportation, and material moving occupations (%)
Most Common Occupations - Production occupations (%)
Most Common Occupations - Transportation occupations (%)
Most Common Occupations - Material moving occupations (%)
People in Group quarters - Institutionalized population (%)
People in Group quarters - Correctional institutions (%)
People in Group quarters - Federal prisons and detention centers (%)
People in Group quarters - Halfway houses (%)
People in Group quarters - Local jails and other confinement facilities (including police lockups) (%)
People in Group quarters - Military disciplinary barracks (%)
People in Group quarters - State prisons (%)
People in Group quarters - Other types of correctional institutions (%)
People in Group quarters - Nursing homes (%)
People in Group quarters - Hospitals/wards, hospices, and schools for the handicapped (%)
People in Group quarters - Hospitals/wards and hospices for chronically ill (%)
People in Group quarters - Hospices or homes for chronically ill (%)
People in Group quarters - Military hospitals or wards for chronically ill (%)
People in Group quarters - Other hospitals or wards for chronically ill (%)
People in Group quarters - Hospitals or wards for drug/alcohol abuse (%)
People in Group quarters - Mental (Psychiatric) hospitals or wards (%)
People in Group quarters - Schools, hospitals, or wards for the mentally retarded (%)
People in Group quarters - Schools, hospitals, or wards for the physically handicapped (%)
People in Group quarters - Institutions for the deaf (%)
People in Group quarters - Institutions for the blind (%)
People in Group quarters - Orthopedic wards and institutions for the physically handicapped (%)
People in Group quarters - Wards in general hospitals for patients who have no usual home elsewhere (%)
People in Group quarters - Wards in military hospitals for patients who have no usual home elsewhere (%)
People in Group quarters - Juvenile institutions (%)
People in Group quarters - Long-term care (%)
People in Group quarters - Homes for abused, dependent, and neglected children (%)
People in Group quarters - Residential treatment centers for emotionally disturbed children (%)
People in Group quarters - Training schools for juvenile delinquents (%)
People in Group quarters - Short-term care, detention or diagnostic centers for delinquent children (%)
People in Group quarters - Type of juvenile institution unknown (%)
People in Group quarters - Noninstitutionalized population (%)
People in Group quarters - College dormitories (includes college quarters off campus) (%)
People in Group quarters - Military quarters (%)
People in Group quarters - On base (%)
People in Group quarters - Barracks, unaccompanied personnel housing (UPH), (Enlisted/Officer), ;and similar group living quarters for military personnel (%)
People in Group quarters - Transient quarters for temporary residents (%)
People in Group quarters - Military ships (%)
People in Group quarters - Group homes (%)
People in Group quarters - Homes or halfway houses for drug/alcohol abuse (%)
People in Group quarters - Homes for the mentally ill (%)
People in Group quarters - Homes for the mentally retarded (%)
People in Group quarters - Homes for the physically handicapped (%)
People in Group quarters - Other group homes (%)
People in Group quarters - Religious group quarters (%)
People in Group quarters - Dormitories (%)
People in Group quarters - Agriculture workers' dormitories on farms (%)
People in Group quarters - Job Corps and vocational training facilities (%)
People in Group quarters - Other workers' dormitories (%)
People in Group quarters - Crews of maritime vessels (%)
People in Group quarters - Other nonhousehold living situations (%)
People in Group quarters - Other noninstitutional group quarters (%)
Residents speaking English at home (%)
Residents speaking English at home - Born in the United States (%)
Residents speaking English at home - Native, born elsewhere (%)
Residents speaking English at home - Foreign born (%)
Residents speaking Spanish at home (%)
Residents speaking Spanish at home - Born in the United States (%)
Residents speaking Spanish at home - Native, born elsewhere (%)
Residents speaking Spanish at home - Foreign born (%)
Residents speaking other language at home (%)
Residents speaking other language at home - Born in the United States (%)
Residents speaking other language at home - Native, born elsewhere (%)
Residents speaking other language at home - Foreign born (%)
Class of Workers - Employee of private company (%)
Class of Workers - Self-employed in own incorporated business (%)
Class of Workers - Private not-for-profit wage and salary workers (%)
Class of Workers - Local government workers (%)
Class of Workers - State government workers (%)
Class of Workers - Federal government workers (%)
Class of Workers - Self-employed workers in own not incorporated business and Unpaid family workers (%)
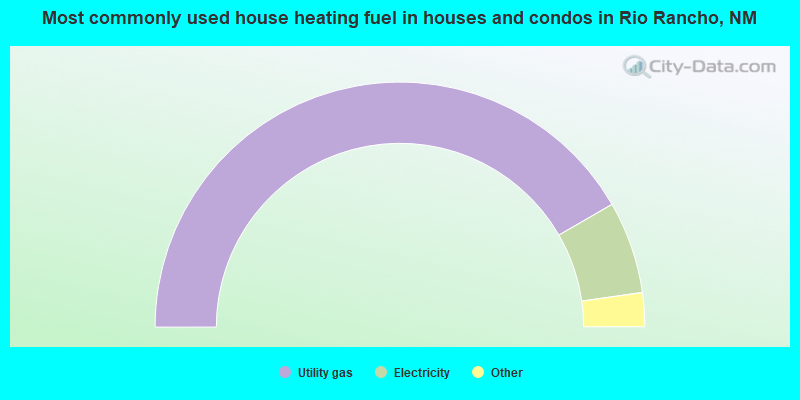
House heating fuel used in houses and condos - Utility gas (%)
House heating fuel used in houses and condos - Bottled, tank, or LP gas (%)
House heating fuel used in houses and condos - Electricity (%)
House heating fuel used in houses and condos - Fuel oil, kerosene, etc. (%)
House heating fuel used in houses and condos - Coal or coke (%)
House heating fuel used in houses and condos - Wood (%)
House heating fuel used in houses and condos - Solar energy (%)
House heating fuel used in houses and condos - Other fuel (%)
House heating fuel used in houses and condos - No fuel used (%)
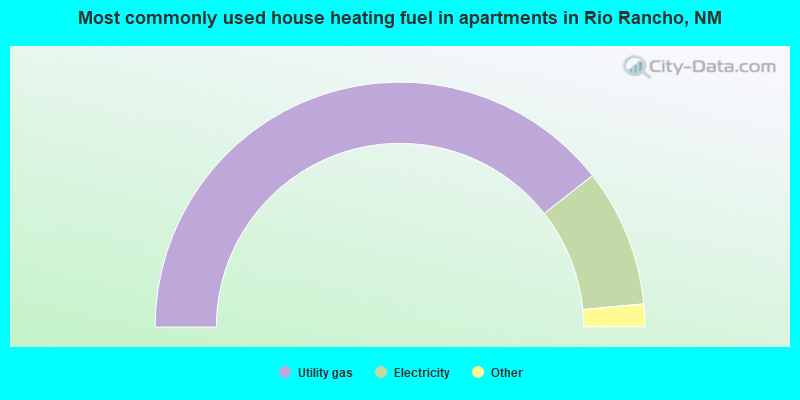
House heating fuel used in apartments - Utility gas (%)
House heating fuel used in apartments - Bottled, tank, or LP gas (%)
House heating fuel used in apartments - Electricity (%)
House heating fuel used in apartments - Fuel oil, kerosene, etc. (%)
House heating fuel used in apartments - Coal or coke (%)
House heating fuel used in apartments - Wood (%)
House heating fuel used in apartments - Solar energy (%)
House heating fuel used in apartments - Other fuel (%)
House heating fuel used in apartments - No fuel used (%)
Armed forces status - In Armed Forces (%)
Armed forces status - Civilian (%)
Armed forces status - Civilian - Veteran (%)
Armed forces status - Civilian - Nonveteran (%)
Fatal accidents locations in years 2005-2021
Fatal accidents locations in 2005
Fatal accidents locations in 2006
Fatal accidents locations in 2007
Fatal accidents locations in 2008
Fatal accidents locations in 2009
Fatal accidents locations in 2010
Fatal accidents locations in 2011
Fatal accidents locations in 2012
Fatal accidents locations in 2013
Fatal accidents locations in 2014
Fatal accidents locations in 2015
Fatal accidents locations in 2016
Fatal accidents locations in 2017
Fatal accidents locations in 2018
Fatal accidents locations in 2019
Fatal accidents locations in 2020
Fatal accidents locations in 2021
Alcohol use - People drinking some alcohol every month (%)
Alcohol use - People not drinking at all (%)
Alcohol use - Average days/month drinking alcohol
Alcohol use - Average drinks/week
Alcohol use - Average days/year people drink much
Audiometry - Average condition of hearing (%)
Audiometry - People that can hear a whisper from across a quiet room (%)
Audiometry - People that can hear normal voice from across a quiet room (%)
Audiometry - Ears ringing, roaring, buzzing (%)
Audiometry - Had a job exposure to loud noise (%)
Audiometry - Had off-work exposure to loud noise (%)
Blood Pressure & Cholesterol - Has high blood pressure (%)
Blood Pressure & Cholesterol - Checking blood pressure at home (%)
Blood Pressure & Cholesterol - Frequently checking blood cholesterol (%)
Blood Pressure & Cholesterol - Has high cholesterol level (%)
Consumer Behavior - Money monthly spent on food at supermarket/grocery store
Consumer Behavior - Money monthly spent on food at other stores
Consumer Behavior - Money monthly spent on eating out
Consumer Behavior - Money monthly spent on carryout/delivered foods
Consumer Behavior - Income spent on food at supermarket/grocery store (%)
Consumer Behavior - Income spent on food at other stores (%)
Consumer Behavior - Income spent on eating out (%)
Consumer Behavior - Income spent on carryout/delivered foods (%)
Current Health Status - General health condition (%)
Current Health Status - Blood donors (%)
Current Health Status - Has blood ever tested for HIV virus (%)
Current Health Status - Left-handed people (%)
Dermatology - People using sunscreen (%)
Diabetes - Diabetics (%)
Diabetes - Had a blood test for high blood sugar (%)
Diabetes - People taking insulin (%)
Diet Behavior & Nutrition - Diet health (%)
Diet Behavior & Nutrition - Milk product consumption (# of products/month)
Diet Behavior & Nutrition - Meals not home prepared (#/week)
Diet Behavior & Nutrition - Meals from fast food or pizza place (#/week)
Diet Behavior & Nutrition - Ready-to-eat foods (#/month)
Diet Behavior & Nutrition - Frozen meals/pizza (#/month)
Drug Use - People that ever used marijuana or hashish (%)
Drug Use - Ever used hard drugs (%)
Drug Use - Ever used any form of cocaine (%)
Drug Use - Ever used heroin (%)
Drug Use - Ever used methamphetamine (%)
Health Insurance - People covered by health insurance (%)
Kidney Conditions-Urology - Avg. # of times urinating at night
Medical Conditions - People with asthma (%)
Medical Conditions - People with anemia (%)
Medical Conditions - People with psoriasis (%)
Medical Conditions - People with overweight (%)
Medical Conditions - Elderly people having difficulties in thinking or remembering (%)
Medical Conditions - People who ever received blood transfusion (%)
Medical Conditions - People having trouble seeing even with glass/contacts (%)
Medical Conditions - People with arthritis (%)
Medical Conditions - People with gout (%)
Medical Conditions - People with congestive heart failure (%)
Medical Conditions - People with coronary heart disease (%)
Medical Conditions - People with angina pectoris (%)
Medical Conditions - People who ever had heart attack (%)
Medical Conditions - People who ever had stroke (%)
Medical Conditions - People with emphysema (%)
Medical Conditions - People with thyroid problem (%)
Medical Conditions - People with chronic bronchitis (%)
Medical Conditions - People with any liver condition (%)
Medical Conditions - People who ever had cancer or malignancy (%)
Mental Health - People who have little interest in doing things (%)
Mental Health - People feeling down, depressed, or hopeless (%)
Mental Health - People who have trouble sleeping or sleeping too much (%)
Mental Health - People feeling tired or having little energy (%)
Mental Health - People with poor appetite or overeating (%)
Mental Health - People feeling bad about themself (%)
Mental Health - People who have trouble concentrating on things (%)
Mental Health - People moving or speaking slowly or too fast (%)
Mental Health - People having thoughts they would be better off dead (%)
Oral Health - Average years since last visit a dentist
Oral Health - People embarrassed because of mouth (%)
Oral Health - People with gum disease (%)
Oral Health - General health of teeth and gums (%)
Oral Health - Average days a week using dental floss/device
Oral Health - Average days a week using mouthwash for dental problem
Oral Health - Average number of teeth
Pesticide Use - Households using pesticides to control insects (%)
Pesticide Use - Households using pesticides to kill weeds (%)
Physical Activity - People doing vigorous-intensity work activities (%)
Physical Activity - People doing moderate-intensity work activities (%)
Physical Activity - People walking or bicycling (%)
Physical Activity - People doing vigorous-intensity recreational activities (%)
Physical Activity - People doing moderate-intensity recreational activities (%)
Physical Activity - Average hours a day doing sedentary activities
Physical Activity - Average hours a day watching TV or videos
Physical Activity - Average hours a day using computer
Physical Functioning - People having limitations keeping them from working (%)
Physical Functioning - People limited in amount of work they can do (%)
Physical Functioning - People that need special equipment to walk (%)
Physical Functioning - People experiencing confusion/memory problems (%)
Physical Functioning - People requiring special healthcare equipment (%)
Prescription Medications - Average number of prescription medicines taking
Preventive Aspirin Use - Adults 40+ taking low-dose aspirin (%)
Reproductive Health - Vaginal deliveries (%)
Reproductive Health - Cesarean deliveries (%)
Reproductive Health - Deliveries resulted in a live birth (%)
Reproductive Health - Pregnancies resulted in a delivery (%)
Reproductive Health - Women breastfeeding newborns (%)
Reproductive Health - Women that had a hysterectomy (%)
Reproductive Health - Women that had both ovaries removed (%)
Reproductive Health - Women that have ever taken birth control pills (%)
Reproductive Health - Women taking birth control pills (%)
Reproductive Health - Women that have ever used Depo-Provera or injectables (%)
Reproductive Health - Women that have ever used female hormones (%)
Sexual Behavior - People 18+ that ever had sex (vaginal, anal, or oral) (%)
Sexual Behavior - Males 18+ that ever had vaginal sex with a woman (%)
Sexual Behavior - Males 18+ that ever performed oral sex on a woman (%)
Sexual Behavior - Males 18+ that ever had anal sex with a woman (%)
Sexual Behavior - Males 18+ that ever had any sex with a man (%)
Sexual Behavior - Females 18+ that ever had vaginal sex with a man (%)
Sexual Behavior - Females 18+ that ever performed oral sex on a man (%)
Sexual Behavior - Females 18+ that ever had anal sex with a man (%)
Sexual Behavior - Females 18+ that ever had any kind of sex with a woman (%)
Sexual Behavior - Average age people first had sex
Sexual Behavior - Average number of female sex partners in lifetime (males 18+)
Sexual Behavior - Average number of female vaginal sex partners in lifetime (males 18+)
Sexual Behavior - Average age people first performed oral sex on a woman (18+)
Sexual Behavior - Average number of woman performed oral sex on in lifetime (18+)
Sexual Behavior - Average number of male sex partners in lifetime (males 18+)
Sexual Behavior - Average number of male anal sex partners in lifetime (males 18+)
Sexual Behavior - Average age people first performed oral sex on a man (18+)
Sexual Behavior - Average number of male oral sex partners in lifetime (18+)
Sexual Behavior - People using protection when performing oral sex (%)
Sexual Behavior - Average number of times people have vaginal or anal sex a year
Sexual Behavior - People having sex without condom (%)
Sexual Behavior - Average number of male sex partners in lifetime (females 18+)
Sexual Behavior - Average number of male vaginal sex partners in lifetime (females 18+)
Sexual Behavior - Average number of female sex partners in lifetime (females 18+)
Sexual Behavior - Circumcised males 18+ (%)
Sleep Disorders - Average hours sleeping at night
Sleep Disorders - People that has trouble sleeping (%)
Smoking-Cigarette Use - People smoking cigarettes (%)
Taste & Smell - People 40+ having problems with smell (%)
Taste & Smell - People 40+ having problems with taste (%)
Taste & Smell - People 40+ that ever had wisdom teeth removed (%)
Taste & Smell - People 40+ that ever had tonsils teeth removed (%)
Taste & Smell - People 40+ that ever had a loss of consciousness because of a head injury (%)
Taste & Smell - People 40+ that ever had a broken nose or other serious injury to face or skull (%)
Taste & Smell - People 40+ that ever had two or more sinus infections (%)
Weight - Average height (inches)
Weight - Average weight (pounds)
Weight - Average BMI
Weight - People that are obese (%)
Weight - People that ever were obese (%)
Weight - People trying to lose weight (%)
According to our research of New Mexico and other state lists, there were 77 registered sex offenders living in Rio Rancho, New Mexico as of June 04, 2024 . The ratio of all residents to sex offenders in Rio Rancho is 1,247 to 1.The ratio of registered sex offenders to all residents in this city is lower than the state average.
The City-Data.com crime index weighs serious crimes and violent crimes more heavily. Higher means more crime, U.S. average is 246.1. It adjusts for the number of visitors and daily workers commuting into cities.
- means the value is smaller than the state average.
- means the value is about the same as the state average.
- means the value is bigger than the state average.
- means the value is much bigger than the state average.
Crime rate in Rio Rancho detailed stats: murders, rapes, robberies, assaults, burglaries, thefts, arson Officers per 1,000 residents here:
1.28New Mexico average:
2.73
Latest news from Rio Rancho, NM collected exclusively by city-data.com from local newspapers, TV, and radio stations
Ancestries: German (5.8%), American (5.6%), English (5.4%), European (4.1%), Irish (3.7%), Italian (3.1%).
Current Local Time:
Land area: 73.4 square miles.
Population density: 1,472 people per square mile (low).
5,633 residents are foreign born (2.8% Latin America , 1.3% Asia , 0.8% Europe ).
This city:
5.4%New Mexico:
9.2%
Median real estate property taxes paid for housing units with mortgages in 2022: $2,365 (0.7%)Median real estate property taxes paid for housing units with no mortgage in 2022: $1,919 (0.7%)
Nearest city with pop. 200,000+: Albuquerque, NM
Nearest city with pop. 1,000,000+: Phoenix, AZ
Nearest cities:
Latitude: 35.29 N, Longitude: 106.67 W
Nickname or alias (official or unofficial): City of Vision
Daytime population change due to commuting: -19,996 (-18.5%)Workers who live and work in this city: 28,200 (54.0%)
Area code commonly used in this area: 505
Unemployment in December 2023: Population change in the 1990s: +18,848 (+57.3%).
Most common occupations in Rio Rancho, NM (%)
Both Males Females
Other management occupations, except farmers and farm managers (6.7%)
Cooks and food preparation workers (4.7%)
Electrical equipment mechanics and other installation, maintenance, and repair workers, including supervisors (4.0%)
Retail sales workers, except cashiers (3.5%)
Computer specialists (3.0%)
Customer service representatives (2.7%)
Cashiers (2.5%)
Electrical equipment mechanics and other installation, maintenance, and repair workers, including supervisors (7.7%)
Other management occupations, except farmers and farm managers (7.6%)
Computer specialists (4.1%)
Drafters, engineering, and mapping technicians (3.3%)
Vehicle and mobile equipment mechanics, installers, and repairers (3.2%)
Cooks and food preparation workers (3.0%)
Engineers (2.8%)
Cooks and food preparation workers (6.5%)
Other management occupations, except farmers and farm managers (5.7%)
Retail sales workers, except cashiers (4.6%)
Information and record clerks, except customer service representatives (3.9%)
Customer service representatives (3.6%)
Registered nurses (3.6%)
Secretaries and administrative assistants (3.5%)
Earthquake activity:
Rio Rancho-area historical earthquake activity is significantly above New Mexico state average. It is 721% greater than the overall U.S. average. On 6/28/1992 at 11:57:34, a magnitude 7.6 (6.2 MB, 7.6 MS, 7.3 MW, Depth: 0.7 mi, Class: Major, Intensity: VIII - XII) earthquake occurred 565.4 miles away from Rio Rancho center, causing 3 deaths ( 1 shaking deaths, 2 other deaths) and 400 injuries, causing $100,000,000 total damage and $40,000,000 insured lossesOn 1/29/1990 at 13:16:10, a magnitude 4.8 (4.5 MB, 4.8 LG, Depth: 7.5 mi, Class: Light, Intensity: IV - V) earthquake occurred 58.2 miles away from the city center On 8/23/2011 at 05:46:18, a magnitude 5.3 (5.3 MW, Depth: 2.5 mi, Class: Moderate, Intensity: VI - VII) earthquake occurred 164.9 miles away from the city center On 10/16/1999 at 09:46:44, a magnitude 7.4 (6.3 MB, 7.4 MS, 7.2 MW, 7.3 ML) earthquake occurred 556.2 miles away from the city center On 5/19/1940 at 04:36:40, a magnitude 7.2 (7.2 UK) earthquake occurred 535.2 miles away from Rio Rancho center, causing $33,000,000 total damage On 8/10/2005 at 22:08:22, a magnitude 5.0 (5.0 MW, Depth: 3.1 mi) earthquake occurred 154.1 miles away from Rio Rancho center Magnitude types: regional Lg-wave magnitude (LG), body-wave magnitude (MB), local magnitude (ML), surface-wave magnitude (MS), moment magnitude (MW) Natural disasters: The number of natural disasters in Bernalillo County (9) is smaller than the US average (15).Major Disasters (Presidential) Declared: 3Emergencies Declared: 2Fires: 5, Floods: 2, Storms: 2, Hurricane: 1, Other: 1 (Note: some incidents may be assigned to more than one category). Hospitals and medical centers in Rio Rancho: UNM SANDOVAL REGIONAL MEDICAL CENTER (Voluntary non-profit - Private, provides emergency services, 3001 BROADMOOR BLVD NE) RIO RANCHO CARE AND REHABILITATION CENTER (4210 SABANA GRANDE SE)
NORTH RIO RANCHO DIALYSIS (FMC) (7555 ENCHANTED HILLS BLVD STE 102)
RIO RANCHO DIALYSIS (DCI) (4045 JACKIE RD SE)
RIO RANCHO DIALYSIS (FMC) (1760 GRANDE BLVD STE 100)
Heliports located in Rio Rancho: Amtrak station near Rio Rancho: 15 miles: ALBUQUERQUE (214 FIRST ST. SW) Services: ticket office, partially wheelchair accessible, enclosed waiting area, public restrooms, public payphones, vending machines, free short-term parking, call for car rental service, call for taxi service, intercity bus service, public transit connection.
Colleges/universities with over 2000 students nearest to Rio Rancho:
University of Phoenix-Albuquerque Campus (about 8 miles; Albuquerque, NM ; Full-time enrollment: 2,335)
University of New Mexico-Main Campus (about 15 miles; Albuquerque, NM ; FT enrollment: 23,042)
Central New Mexico Community College (about 15 miles; Albuquerque, NM ; FT enrollment: 19,398)
Santa Fe Community College (about 43 miles; Santa Fe, NM ; FT enrollment: 3,047)
New Mexico Highlands University (about 85 miles; Las Vegas, NM ; FT enrollment: 2,931)
San Juan College (about 133 miles; Farmington, NM ; FT enrollment: 5,112)
Fort Lewis College (about 153 miles; Durango, CO ; FT enrollment: 3,631)
Public high schools in Rio Rancho: RIO RANCHO HIGH Students: 2,941, Location: 500 LASER RD NE, Grades: 9-12)RIO RANCHO CYBER ACADEMY Students: 139, Location: 1330 JACKIE RD SE, Grades: 6-12)INDEPENDENCE HIGH SCHOOL Location: 421 QUANTUM RD NE, Grades: 9-12)
V SUE CLEVELAND HIGH Location: 4800 LABAN RD NE, Grades: 9-12)
THE ASK ACADEMY Location: 4311 SARA RD SE, Grades: 7-12, Charter school )
EXPLORE ACADEMY Location: 2720 AVENIDA CORAZON, Grades: 9-10, Charter school )
Private high schools in Rio Rancho: GOSPEL LIGHT BAPTIST ACADEMY Students: 80, Location: 1500 SOUTHERN BLVD SE, Grades: KG-12)
LIVING WORD CHRISTIAN ACADEMY Students: 26, Location: 1901 17TH AVE NE, Grades: KG-12)
Biggest public elementary/middle schools in Rio Rancho: RIO RANCHO MIDDLE SCHOOL Students: 2,396, Location: 1600 40TH ST NE, Grades: 6-8)COLINAS DEL NORTE ELEMENTARY Students: 1,076, Location: 1001 23RD AVE, Grades: PK-5)VISTA GRANDE ELEMENTARY Students: 910, Location: 7001 CHAYOTE RD NE, Grades: KG-5)MARTIN KING JR ELEMENTARY Students: 908, Location: 1301 27TH ST SE, Grades: KG-5)ERNEST STAPLETON ELEMENTARY Students: 893, Location: 3100 8TH AVE, Grades: KG-5)ENCHANTED HILLS ELEMENTARY Students: 831, Location: 5400 OBREGON RD NE, Grades: KG-5)PUESTA DEL SOL ELEMENTARY Students: 804, Location: 450 SOUTHERN BLVD, Grades: KG-5)MOUNTAIN VIEW MIDDLE Students: 799, Location: 4101 MONTREAL LOOP, Grades: 6-8)RIO RANCHO ELEMENTARY Students: 772, Location: 4601 PEPE ORTIZ SE, Grades: PK-5)LINCOLN MIDDLE Students: 761, Location: 2287 LEMA RD SE, Grades: 6-8)Private elementary/middle school in Rio Rancho: ST THOMAS AQUINAS SCHOOL Students: 406, Location: 1100 HOOD RD SE, Grades: KG-8)
See full list of schools located in Rio Rancho Library in Rio Rancho: RIO RANCHO PUBLIC LIBRARY Operating income: $2,345,269; Location: 755 LOMA COLORADO DR. SE; 160,545 books ; 4,976 audio materials ; 4,707 video materials ; 10 local licensed databases ; 37 state licensed databases ; 244 print serial subscriptions )
User-submitted facts and corrections:
Add another church to data: First Baptist Church of Rio Rancho, 3906 19th Ave SE, Rio Rancho, NM 87124
Notable locations in Rio Rancho: (A) , Corrales Mental Health Clinic Library (B) , Rio Rancho Fire and Rescue Station 5 (C) , Intel Corporation (D) , Rio Rancho Fire and Rescue Station 1 (E) , Rio Rancho Fire and Rescue Station 2 (F) , Rio Rancho Fire and Rescue Station 3 (G) , Rio Rancho Fire and Rescue Station 4 (H) . Display/hide their locations on the map
Churches in Rio Rancho include: (A) , Calvary Lutheran Church-LCMS (B) , Community of Joy Lutheran Church (C) , Covenant Christian Church (D) , Austin Chapel Baptist Church (E) , Rio Rancho Community Christianity Church (F) , First Baptist Church of Rio Rancho (G) , Bernallilo Church of Christ (H) , Church of the Incarnation (I) . Display/hide their locations on the map
Cemetery: (1) . Display/hide its location on the map
Streams, rivers, and creeks: (A) . Display/hide its location on the map
Parks in Rio Rancho include: (1) , Western Winds Park (2) , Star Heights Park (3) , Cielo Vista Park (4) , Veja Baja Park (5) , Leon Grande Park (6) , Vista Hills Park (7) . Display/hide their locations on the map
Tourist attractions: (1) , Tenpins & More at Rio Rancho (Amusement & Theme Parks; 1416 Deborah Road Southeast) (2) , Sweet Escape Ballooning (216 Dogwood Trail Southeast) (3) . Display/hide their approximate locations on the map
Hotels: (1) , Days Inn (4200 Crestview Drive Southeast) (2) , Holiday Inn Select (1501 Sunset Road Southeast) (3) , Ramada Limited (4081 High Resort Blvd SE) (4) , Super 8 Rio Rancho NM (4100 Barbara Loop Southeast) (5) , Best Western Rio Rancho Inn (1465 Rio Rancho Drive Southeast) (6) . Display/hide their approximate locations on the map
Courts: (1) , 13th Judicial District Court (1500 Idalia Road Northeast) (2) , Mission of Maitreya (779 Spur Road) (3) . Display/hide their approximate locations on the map
Birthplace of: Alan Branch - Player of Football.
Bernalillo County has a predicted average indoor radon screening level greater than 4 pCi/L (pico curies per liter) - Highest Potential Drinking water stations with addresses in Rio Rancho and their reported violations in the past:
RIO RANCHO WATER & WW SERVICES (Address: 4300 Sara Rd Population served: 87,000, Groundwater):
Past monitoring violations:
Monitoring and Reporting (DBP) - Between JAN-2012 and DEC-2012, Contaminant: Total Haloacetic Acids (HAA5). Follow-up actions: St Violation/Reminder Notice (NOV-14-2012), St Public Notif requested (NOV-14-2012)
Monitoring and Reporting (DBP) - Between JAN-2012 and DEC-2012, Contaminant: TTHM. Follow-up actions: St Violation/Reminder Notice (NOV-14-2012), St Public Notif requested (NOV-14-2012)
Failure Submit IDSE/Subpart V Plan Rpt - In JUL-02-2009, Contaminant: DBP STAGE 2. Follow-up actions: St Compliance achieved (DEC-28-2012)
34 regular monitoring violations
Serves WY, Population served: 85, Groundwater):
Past monitoring violations:
Monitoring, Source Water (GWR) - In MAR-19-2014, Contaminant: E. COLI. Follow-up actions: St Public Notif received (AUG-21-2014)
2 routine major monitoring violations
One regular monitoring violation
Address: 6404 Milpa Alta Rd. NE Population served: 70, Groundwater):
Past health violations:
MCL, Single Sample - Between JAN-2008 and DEC-2010, Contaminant: Combined Uranium. Follow-up actions: St Compliance achieved (JAN-25-2011)
MCL, Average - Between APR-2007 and JUN-2007, Contaminant: Combined Uranium. Follow-up actions: St Compliance achieved (JAN-25-2011)
MCL, Single Sample - Between JAN-2007 and MAR-2007, Contaminant: Combined Uranium. Follow-up actions: St Compliance achieved (JAN-25-2011)
Past monitoring violations:
7 regular monitoring violations
Serves CA, Population served: 26, Groundwater):
Past monitoring violations:
Initial Tap Sampling for Pb and Cu - In JUL-01-1993, Contaminant: Lead and Copper Rule. Follow-up actions: Fed Compliance achieved (DEC-31-2008), Fed No Longer Subject to Rule (DEC-31-2008)
One routine major monitoring violation
Average household size: This city:
2.7 peopleNew Mexico:
2.5 people
Percentage of family households: This city:
72.9%Whole state:
65.5%
Percentage of households with unmarried partners: This city:
7.6%Whole state:
8.2%
Likely homosexual households (counted as self-reported same-sex unmarried-partner households)
Lesbian couples: 0.7% of all households Gay men: 0.4% of all households
People in group quarters in Rio Rancho in 2010:
141 people in nursing facilities/skilled-nursing facilities
46 people in other noninstitutional facilities
7 people in group homes intended for adults
2 people in emergency and transitional shelters (with sleeping facilities) for people experiencing homelessness
People in group quarters in Rio Rancho in 2000:
257 people in nursing homes
156 people in other group homes
5 people in other nonhousehold living situations
Arena or stadium:
Santa Ana Star Center. Capacity: 8,000.
Banks with most branches in Rio Rancho (2011 data):
BOKF, National Association: Rio Rancho Southern Branch at 3901 Southern Boulevard, S.E., branch established on 1934/09/01; High Resort Branch at 4300 Ridgecrest Drive S.E., branch established on 2003/04/01. Info updated 2012/02/28: Bank assets: $25,360.0 mil, Deposits: $19,171.3 mil, headquarters in Tulsa, OK, positive income , Commercial Lending Specialization, 189 total offices , Holding Company: Bok Financial Corporation
New Mexico Bank & Trust: Rio Rancho Branch at 4001 Southern Blvd. S.E., branch established on 1999/09/27; Rio Rancho 2 at 7830 Enchanted Hills Blvd, branch established on 2006/03/13. Info updated 2006/11/03: Bank assets: $974.9 mil, Deposits: $690.3 mil, headquarters in Albuquerque, NM, positive income , Commercial Lending Specialization, 16 total offices , Holding Company: Heartland Financial Usa, Inc.
Wells Fargo Bank, National Association: Rio Rancho Branch at 4110 Meadowlark Lane Se, branch established on 1960/08/29; Raley's Rio Rancho Branch at 3301 Southern Blvd Se, branch established on 1996/05/15. Info updated 2011/04/05: Bank assets: $1,161,490.0 mil, Deposits: $905,653.0 mil, headquarters in Sioux Falls, SD, positive income , 6395 total offices , Holding Company: Wells Fargo & Company
U.S. Bank National Association: Rio Rancho Southern Branch at 1000 Commercial Drive Se, branch established on 2006/07/24; Rio Rancho Branch at 1781 Rio Rancho Drive Southeast, branch established on 1994/06/20. Info updated 2012/01/30: Bank assets: $330,470.8 mil, Deposits: $236,091.5 mil, headquarters in Cincinnati, OH, positive income , 3121 total offices , Holding Company: U.S. Bancorp
Bank of America, National Association: Country Club Branch at 3101 Southern Boulevard, S.E., branch established on 1984/11/19; High Resort Branch at 4201 Crestview Road, S.E., branch established on 1989/12/01. Info updated 2009/11/18: Bank assets: $1,451,969.3 mil, Deposits: $1,077,176.8 mil, headquarters in Charlotte, NC, positive income , 5782 total offices , Holding Company: Bank Of America Corporation
Bank of the West: Rio Rancho Branch at 3735 Southern Boulevard, S.E., branch established on 1994/11/21. Info updated 2009/11/16: Bank assets: $62,408.3 mil, Deposits: $43,995.2 mil, headquarters in San Francisco, CA, positive income , 647 total offices , Holding Company: Bnp Paribas
Washington Federal: Rio Rancho Branch at 2518 Southern Blvd, branch established on 2007/09/15. Info updated 2011/12/19: Bank assets: $13,653.0 mil, Deposits: $8,905.8 mil, headquarters in Seattle, WA, positive income , Mortgage Lending Specialization, 174 total offices
First American Bank: Rio Rancho Branch at 3002 Southern Blvd., Se, branch established on 2005/10/17. Info updated 2010/06/26: Bank assets: $732.3 mil, Deposits: $605.7 mil, headquarters in Artesia, NM, positive income , Commercial Lending Specialization, 14 total offices , Holding Company: First Artesia Bancshares, Inc.
Compass Bank: Rio Rancho Branch at 1201 Rio Rancho Drive, Southeast, branch established on 1992/07/06. Info updated 2011/02/24: Bank assets: $63,107.0 mil, Deposits: $46,232.4 mil, headquarters in Birmingham, AL, negative income in the last year , Commercial Lending Specialization, 720 total offices , Holding Company: Banco Bilbao Vizcaya Argentaria, S.A.
For population 15 years and over in Rio Rancho:
Never married: 30.9%Now married: 53.8%Separated: 1.1%Widowed: 4.4%Divorced: 9.7% For population 25 years and over in Rio Rancho:
High school or higher: 93.3%Bachelor's degree or higher: 34.6%Graduate or professional degree: 11.8%Unemployed: 4.7%Mean travel time to work (commute): 27.7 minutes
Education Gini index (Inequality in education) Here:
10.4New Mexico average:
12.6
Religion statistics for Rio Rancho, NM (based on Bernalillo County data)
Religion Adherents Congregations Catholic 175,266 44 Evangelical Protestant 81,470 220 Other 27,665 74 Mainline Protestant 25,031 59 Orthodox 1,644 3 Black Protestant 1,625 12 None 349,863 -
Source: Clifford Grammich, Kirk Hadaway, Richard Houseal, Dale E.Jones, Alexei Krindatch, Richie Stanley and Richard H.Taylor. 2012. 2010 U.S.Religion Census: Religious Congregations & Membership Study. Association of Statisticians of American Religious Bodies. Jones, Dale E., et al. 2002. Congregations and Membership in the United States 2000. Nashville, TN: Glenmary Research Center. Graphs represent county-level data
Food Environment Statistics: Number of grocery stores : 85This county :
1.35 / 10,000 pop.New Mexico :
1.44 / 10,000 pop.
Number of supercenters and club stores : 11Bernalillo County :
0.18 / 10,000 pop.New Mexico :
0.21 / 10,000 pop.
Number of convenience stores (no gas) : 11Here :
0.18 / 10,000 pop.State :
0.32 / 10,000 pop.
Number of convenience stores (with gas) : 189Bernalillo County :
3.01 / 10,000 pop.New Mexico :
4.06 / 10,000 pop.
Number of full-service restaurants : 437This county :
6.96 / 10,000 pop.State :
7.12 / 10,000 pop.
Adult diabetes rate : Bernalillo County :
5.3%State :
6.4%
Adult obesity rate : This county :
20.0%State :
22.1%
Low-income preschool obesity rate : This county :
9.8%New Mexico :
11.5%
Health and Nutrition: Healthy diet rate : This city:
51.1%New Mexico:
49.0%
Average overall health of teeth and gums : This city:
50.7%New Mexico:
48.1%
Average BMI : This city:
28.6New Mexico:
28.6
People feeling badly about themselves : Rio Rancho:
19.7%New Mexico:
20.7%
People not drinking alcohol at all : This city:
9.6%New Mexico:
10.1%
Average hours sleeping at night : This city:
6.8New Mexico:
6.8
Overweight people : Rio Rancho:
34.4%New Mexico:
34.6%
General health condition : This city:
58.3%State:
55.9%
Average condition of hearing : Here:
80.8%New Mexico:
80.3%
More about Health and Nutrition of Rio Rancho, NM Residents
Rio Rancho government finances - Expenditure in 2021 (per resident):
Construction - Water Utilities: $14,588,000 ($134.97)
Regular Highways: $7,545,000 ($69.81)Central Staff Services: $2,451,000 ($22.68)Sewerage: $2,101,000 ($19.44)Parks and Recreation: $201,000 ($1.86)Housing and Community Development: $113,000 ($1.05)General Public Buildings: $100,000 ($0.93)Natural Resources - Other: $91,000 ($0.84)Local Fire Protection: $4,000 ($0.04)Current Operations - Water Utilities: $19,879,000 ($183.93)
Police Protection: $19,446,000 ($179.92)Sewerage: $13,667,000 ($126.45)Local Fire Protection: $13,555,000 ($125.41)Regular Highways: $10,254,000 ($94.87)Central Staff Services: $5,451,000 ($50.43)Parks and Recreation: $5,121,000 ($47.38)Protective Inspection and Regulation - Other: $3,003,000 ($27.78)Libraries: $2,989,000 ($27.65)Financial Administration: $2,001,000 ($18.51)Judicial and Legal Services: $1,977,000 ($18.29)General Public Buildings: $1,501,000 ($13.89)Solid Waste Management: $600,000 ($5.55)Natural Resources - Other: $488,000 ($4.52)Correctional Institutions: $415,000 ($3.84)Housing and Community Development: $330,000 ($3.05)Transit Utilities: $100,000 ($0.93)General - Other: $4,000 ($0.04)Other Capital Outlay - Regular Highways: $800,000 ($7.40)
Police Protection: $500,000 ($4.63)Parks and Recreation: $174,000 ($1.61)Local Fire Protection: $94,000 ($0.87)Sewerage: $48,000 ($0.44)Water Utilities: $10,000 ($0.09)Total Salaries and Wages: $31,547,000 ($291.88)
Rio Rancho government finances - Revenue in 2021 (per resident):
Charges - Sewerage: $22,787,000 ($210.83)
Other: $6,002,000 ($55.53)Parks and Recreation: $1,490,000 ($13.79)Miscellaneous Commercial Activities: $311,000 ($2.88)Federal Intergovernmental - Highways: $7,006,000 ($64.82)
Other: $750,000 ($6.94)Housing and Community Development: $452,000 ($4.18)Public Welfare: $250,000 ($2.31)Water Utilities: $60,000 ($0.56)Local Intergovernmental - Public Welfare: $990,000 ($9.16)
General Local Government Support: $4,000 ($0.04)Miscellaneous - General Revenue - Other: $5,306,000 ($49.09)
Special Assessments: $2,015,000 ($18.64)Fines and Forfeits: $991,000 ($9.17)Interest Earnings: $270,000 ($2.50)Rents: $136,000 ($1.26)Donations From Private Sources: $95,000 ($0.88)Revenue - Water Utilities: $28,566,000 ($264.30)
State Intergovernmental - Housing and Community Development: $4,000,000 ($37.01)
Water Utilities: $3,005,000 ($27.80)General Local Government Support: $989,000 ($9.15)Public Welfare: $700,000 ($6.48)Highways: $155,000 ($1.43)Tax - General Sales and Gross Receipts: $38,458,000 ($355.82)
Property: $19,925,000 ($184.35)Motor Vehicle License: $901,000 ($8.34)Occupation and Business License - Other: $346,000 ($3.20)Amusements Sales: $36,000 ($0.33)Alcoholic Beverage License: $16,000 ($0.15)
Rio Rancho government finances - Debt in 2021 (per resident):
Long Term Debt - Beginning Outstanding - Public Debt for Private Purpose: $138,785,000 ($1284.07)
Outstanding Nonguaranteed - Industrial Revenue: $130,244,000 ($1205.05)Beginning Outstanding - Unspecified Public Purpose: $51,223,000 ($473.93)Retired Nonguaranteed - Public Debt for Private Purpose: $48,799,000 ($451.50)Outstanding Unspecified Public Purpose: $44,207,000 ($409.01)Issue, Nonguaranteed - Public Debt for Private Purpose: $40,258,000 ($372.48)Retired Unspecified Public Purpose: $7,015,000 ($64.90)Short Term Debt Outstanding - Beginning: $20,200,000 ($186.90)
Rio Rancho government finances - Cash and Securities in 2021 (per resident):
Other Funds - Cash and Securities: $60,351,000 ($558.38)
Sinking Funds - Cash and Securities: $177,390,000 ($1641.25)
5.56% of this county's 2021 resident taxpayers lived in other counties in 2020 ($59,103 average adjusted gross income )
Here:
5.56%New Mexico average:
6.50%
0.05% of residents moved from foreign countries ($562 average AGI )Bernalillo County:
0.05%New Mexico average:
0.07%
Top counties from which taxpayers relocated into this county between 2020 and 2021:
5.93% of this county's 2020 resident taxpayers moved to other counties in 2021 ($60,689 average adjusted gross income )
Here:
5.93%New Mexico average:
6.53%
0.05% of residents moved to foreign countries ($614 average AGI )Bernalillo County:
0.05%New Mexico average:
0.05%
Top counties to which taxpayers relocated from this county between 2020 and 2021:
Businesses in Rio Rancho, NM
Name Count Name Count
7-Eleven 1 Jones New York 2 Albertsons 1 KFC 1 Applebee's 1 Kmart 1 Arby's 1 Kroger 1 AutoZone 2 Little Caesars Pizza 2 Baskin-Robbins 1 Long John Silver's 1 Big O Tires 1 Lowe's 1 Burger King 3 MasterBrand Cabinets 1 CVS 1 McDonald's 4 Carl\s Jr. 1 Nike 3 Circle K 3 Panda Express 1 Cold Stone Creamery 1 Penske 1 Comfort Inn 1 Pizza Hut 2 Cricket Wireless 3 Quiznos 1 Curves 1 RadioShack 1 Dairy Queen 1 SONIC Drive-In 2 Days Inn 1 Sprint Nextel 1 Decora Cabinetry 1 Starbucks 3 Discount Tire 1 Subway 1 Domino's Pizza 2 Super 8 1 Extended Stay America 1 T-Mobile 3 Extended Stay Deluxe 1 Taco Bell 1 Fashion Bug 1 Target 1 FedEx 7 True Value 1 Firestone Complete Auto Care 1 U-Haul 2 Ford 1 UPS 3 GNC 1 Village Inn 1 GameStop 1 Walgreens 4 H&R Block 2 Walmart 1 Hilton 1 Wendy's 2 Home Depot 1 YMCA 2 Honda 1
Strongest AM radio stations in Rio Rancho:
KKIM (1000 AM; 10 kW; ALBUQUERQUE, NM; Owner: AGM-NEVADA, LLC)
KANM (1600 AM; 10 kW; ALBUQUERQUE, NM; Owner: ARAGON BROADCASTING COMPANY, L.L.C.)
KDEF (1150 AM; 5 kW; ALBUQUERQUE, NM; Owner: RAMH CORPORATION)
KKNS (1310 AM; 5 kW; CORRALES, NM; Owner: SIMMONS-NM, LS, LLC)
KXKS (1190 AM; 10 kW; ALBUQUERQUE, NM; Owner: CLEAR CHANNEL BROADCASTING LICENSES, INC.)
KKOB (770 AM; 50 kW; ALBUQUERQUE, NM; Owner: CITADEL BROADCASTING COMPANY)
KNML (610 AM; 5 kW; ALBUQUERQUE, NM; Owner: CITADEL BROADCASTING COMPANY)
KABQ (1350 AM; 5 kW; ALBUQUERQUE, NM; Owner: CLEAR CHANNEL BROADCASTING LICENSES, INC.)
KKJY (1550 AM; 5 kW; ALBUQUERQUE, NM; Owner: VANGUARD MEDIA, L.L.C)
KALY (1240 AM; 1 kW; LOS RANCHOS DE ALBUQ, NM; Owner: ABC, INC.)
KSVA (920 AM; 1 kW; ALBUQUERQUE, NM; Owner: LIFETALK RADIO, INC.)
KRZY (1450 AM; 1 kW; ALBUQUERQUE, NM; Owner: ENTRAVISION HOLDINGS, LLC)
KDAZ (730 AM; 1 kW; ALBUQUERQUE, NM; Owner: PAN AMERICAN BROADCASTING CO., INC.)
Strongest FM radio stations in Rio Rancho:
KLYT (88.3 FM; ALBUQUERQUE, NM; Owner: CONNECTION COMMUNICATIONS ASSOCIATION, INC.)
KTZO (103.3 FM; ALBUQUERQUE, NM; Owner: CITADEL BROADCASTING COMPANY)
KRST (92.3 FM; ALBUQUERQUE, NM; Owner: CITADEL BROADCASTING COMPANY)
KPEK (100.3 FM; ALBUQUERQUE, NM; Owner: CITICASTERS LICENSES, L.P.)
KUNM (89.9 FM; ALBUQUERQUE, NM; Owner: BOARD OF REGENTS UNIV. OF NEW MEXICO)
KKOB-FM (93.3 FM; ALBUQUERQUE, NM; Owner: CITADEL BROADCASTING COMPANY)
KANW (89.1 FM; ALBUQUERQUE, NM; Owner: BD. OF EDUC. CITY OF ALBUQUERQUE, NM)
KBZU (96.3 FM; ALBUQUERQUE, NM; Owner: CITADEL BROADCASTING COMPANY)
KMGA (99.5 FM; ALBUQUERQUE, NM; Owner: CITADEL BROADCASTING COMPANY)
KZRR (94.1 FM; ALBUQUERQUE, NM; Owner: CLEAR CHANNEL BROADCASTING LICENSES, INC.)
K265CA (100.9 FM; ALBUQUERQUE, NM; Owner: CITICASTERS LICENSES, L.P.)
KBQI (107.9 FM; ALBUQUERQUE, NM; Owner: CITICASTERS LICENSES, L.P.)
KFLQ (91.5 FM; ALBUQUERQUE, NM; Owner: FAMILY LIFE BROADCASTING SYSTEM)
K213BT (90.5 FM; ALBUQUERQUE, NM; Owner: EDUCATIONAL MEDIA FOUNDATION)
KNKT (107.1 FM; ARMIJO, NM; Owner: CALVARY CHAPEL OF ALBUQUERQUE, INC.)
KIOT (102.5 FM; LOS LUNAS, NM; Owner: HBC LICENSE CORPORATION)
KTEG (104.7 FM; BOSQUE FARMS, NM; Owner: CLEAR CHANNEL BROADCASTING LICENSES, INC.)
KRZY-FM (105.9 FM; SANTA FE, NM; Owner: ENTRAVISION HOLDINGS, LLC)
KAJZ (105.1 FM; SANTA FE, NM; Owner: HBC LICENSE CORPORATION)
KBAC (104.1 FM; SANTA FE, NM; Owner: CITICASTERS LICENSES, L.P.)
TV broadcast stations around Rio Rancho:
KTFQ (Channel 14; ALBUQUERQUE, NM; Owner: TELEFUTURA TELEVISION GROUP, INC.)
KWBQ (Channel 19; SANTA FE, NM; Owner: ACME TV LICENSES OF NEW MEXICO, LLC)
KASA-TV (Channel 2; SANTA FE, NM; Owner: RAYCOM NATIONAL, INC.)
KOAT-TV (Channel 7; ALBUQUERQUE, NM; Owner: KOAT HEARST-ARGYLE TELEVISION, INC.)
KNME-TV (Channel 5; ALBUQUERQUE, NM; Owner: REGENTS OF THE UNIV. OF NEW MEXICO)
K43HW (Channel 43; ALBUQUERQUE, NM; Owner: JOSEPH W. SHAFFER)
KASY-TV (Channel 50; ALBUQUERQUE, NM; Owner: ACME TV LICENSES OF NEW MEXICO, LLC)
K46GY (Channel 46; SANTA FE, NM; Owner: RAMAR COMMUNICATIONS II, LTD.)
KYNM-LP (Channel 61; ALBUQUERQUE, NM; Owner: BELMAX BROADCASTING LLC)
KRQE (Channel 13; ALBUQUERQUE, NM; Owner: EMMIS TELEVISION LICENSE CORPORATION)
KTVS-LP (Channel 59; ALBUQUERQUE, NM; Owner: ALPHA OMEGA BROADCASTING OF ALBUQUERQUE, INC.)
K17DD (Channel 17; ALBUQUERQUE, NM; Owner: THREE ANGELS BROADCASTING NETWORK, INC.)
KAZQ (Channel 32; ALBUQUERQUE, NM; Owner: ALPHA OMEGA BROADCASTING OF ALBUQUERQUE, INC.)
KLUZ-TV (Channel 41; ALBUQUERQUE, NM; Owner: ENTRAVISION HOLDINGS, LLC)
K56FB (Channel 56; ALBUQUERQUE, NM; Owner: RAMAR COMMUNICATIONS II, LTD.)
KQDF-LP (Channel 25; ALBUQUERQUE, NM; Owner: JOSEPH W. SHAFFER)
National Bridge Inventory (NBI) Statistics 24 Number of bridges200ft / 60.6m Total length $1,519,000 Total costs260,765 Total average daily traffic22,250 Total average daily truck traffic
New bridges - historical statistics
1 1960-1969 5 1970-1979 4 1990-1999 8 2000-2009 6 2010-2019
See full National Bridge Inventory statistics for Rio Rancho, NM
Home Mortgage Disclosure Act Aggregated Statistics For Year 2009(Based on 8 full and 3 partial tracts) A) FHA, FSA/RHS & VA B) Conventional C) Refinancings D) Home Improvement Loans F) Non-occupant Loans on G) Loans On Manufactured Number Average Value Number Average Value Number Average Value Number Average Value Number Average Value Number Average Value
LOANS ORIGINATED 747 $175,907 522 $156,194 2,086 $170,782 114 $64,454 150 $142,638 22 $96,146 APPLICATIONS APPROVED, NOT ACCEPTED 35 $201,570 48 $205,341 244 $182,071 12 $74,668 12 $111,552 3 $122,293 APPLICATIONS DENIED 173 $170,067 74 $181,131 908 $181,800 118 $35,709 73 $153,879 22 $94,353 APPLICATIONS WITHDRAWN 82 $175,597 69 $165,874 725 $174,730 21 $101,417 46 $143,971 9 $112,302 FILES CLOSED FOR INCOMPLETENESS 7 $122,003 8 $185,348 100 $173,569 6 $74,002 10 $137,728 0 $0
Aggregated Statistics For Year 2008(Based on 8 full and 3 partial tracts) A) FHA, FSA/RHS & VA B) Conventional C) Refinancings D) Home Improvement Loans F) Non-occupant Loans on G) Loans On Manufactured Number Average Value Number Average Value Number Average Value Number Average Value Number Average Value Number Average Value
LOANS ORIGINATED 682 $184,408 841 $180,564 1,412 $166,911 173 $64,476 209 $149,959 36 $92,540 APPLICATIONS APPROVED, NOT ACCEPTED 40 $211,028 141 $218,058 197 $187,037 24 $55,518 30 $157,223 6 $118,292 APPLICATIONS DENIED 97 $176,654 136 $225,604 1,165 $186,975 191 $60,168 108 $207,990 24 $82,965 APPLICATIONS WITHDRAWN 68 $184,467 122 $207,067 572 $184,561 43 $99,032 57 $180,078 8 $107,006 FILES CLOSED FOR INCOMPLETENESS 5 $148,616 29 $238,111 134 $180,629 9 $111,576 12 $184,898 2 $117,195
Aggregated Statistics For Year 2007(Based on 8 full and 3 partial tracts) A) FHA, FSA/RHS & VA B) Conventional C) Refinancings D) Home Improvement Loans E) Loans on Dwellings For 5+ Families F) Non-occupant Loans on G) Loans On Manufactured Number Average Value Number Average Value Number Average Value Number Average Value Number Average Value Number Average Value Number Average Value
LOANS ORIGINATED 288 $189,660 2,177 $168,633 2,086 $163,344 414 $67,296 1 $1,142,000 553 $160,062 43 $99,843 APPLICATIONS APPROVED, NOT ACCEPTED 21 $189,473 345 $173,635 402 $179,954 71 $54,753 0 $0 92 $147,010 11 $107,675 APPLICATIONS DENIED 35 $171,569 364 $166,845 1,506 $174,621 404 $65,821 0 $0 141 $177,681 29 $73,364 APPLICATIONS WITHDRAWN 37 $196,072 394 $164,245 835 $171,345 102 $101,229 0 $0 85 $144,802 12 $112,712 FILES CLOSED FOR INCOMPLETENESS 2 $183,620 59 $160,211 205 $190,746 14 $130,138 0 $0 16 $179,613 2 $80,650
Aggregated Statistics For Year 2006(Based on 8 full and 3 partial tracts) A) FHA, FSA/RHS & VA B) Conventional C) Refinancings D) Home Improvement Loans E) Loans on Dwellings For 5+ Families F) Non-occupant Loans on G) Loans On Manufactured Number Average Value Number Average Value Number Average Value Number Average Value Number Average Value Number Average Value Number Average Value
LOANS ORIGINATED 303 $171,652 3,675 $143,946 2,378 $143,355 379 $56,503 2 $2,990,500 994 $135,212 30 $78,752 APPLICATIONS APPROVED, NOT ACCEPTED 16 $158,082 483 $157,549 316 $149,088 61 $35,334 0 $0 138 $146,476 10 $66,104 APPLICATIONS DENIED 31 $151,033 572 $140,434 1,570 $139,686 388 $54,396 0 $0 170 $130,215 39 $79,694 APPLICATIONS WITHDRAWN 32 $197,454 699 $143,096 1,097 $143,775 121 $78,192 0 $0 133 $137,992 7 $81,131 FILES CLOSED FOR INCOMPLETENESS 1 $154,000 98 $134,895 265 $161,200 9 $69,388 0 $0 25 $137,162 1 $109,290
Aggregated Statistics For Year 2005(Based on 8 full and 3 partial tracts) A) FHA, FSA/RHS & VA B) Conventional C) Refinancings D) Home Improvement Loans F) Non-occupant Loans on G) Loans On Manufactured Number Average Value Number Average Value Number Average Value Number Average Value Number Average Value Number Average Value
LOANS ORIGINATED 418 $145,287 3,171 $121,312 1,853 $124,167 223 $60,658 921 $112,713 38 $73,183 APPLICATIONS APPROVED, NOT ACCEPTED 28 $150,944 348 $127,911 259 $125,941 29 $50,802 79 $120,606 9 $97,928 APPLICATIONS DENIED 53 $148,270 496 $116,778 1,367 $123,719 240 $42,636 129 $117,889 37 $69,418 APPLICATIONS WITHDRAWN 52 $141,780 608 $123,818 967 $127,516 135 $147,104 147 $131,221 13 $92,151 FILES CLOSED FOR INCOMPLETENESS 3 $144,787 101 $111,233 172 $136,931 15 $95,638 18 $91,191 0 $0
Aggregated Statistics For Year 2004(Based on 8 full and 3 partial tracts) A) FHA, FSA/RHS & VA B) Conventional C) Refinancings D) Home Improvement Loans E) Loans on Dwellings For 5+ Families F) Non-occupant Loans on G) Loans On Manufactured Number Average Value Number Average Value Number Average Value Number Average Value Number Average Value Number Average Value Number Average Value
LOANS ORIGINATED 576 $128,202 2,028 $118,990 1,757 $112,930 151 $41,048 2 $9,269,000 401 $109,463 42 $74,723 APPLICATIONS APPROVED, NOT ACCEPTED 34 $132,269 240 $130,457 210 $114,641 28 $43,946 0 $0 36 $116,011 10 $81,625 APPLICATIONS DENIED 140 $128,644 323 $111,208 1,060 $116,182 217 $33,335 0 $0 77 $110,465 34 $66,184 APPLICATIONS WITHDRAWN 110 $138,072 315 $125,942 694 $118,832 63 $52,913 0 $0 78 $118,353 9 $93,836 FILES CLOSED FOR INCOMPLETENESS 9 $115,977 48 $148,172 73 $132,066 14 $29,281 0 $0 3 $212,710 0 $0
Aggregated Statistics For Year 2003(Based on 8 full and 3 partial tracts) A) FHA, FSA/RHS & VA B) Conventional C) Refinancings D) Home Improvement Loans F) Non-occupant Loans on Number Average Value Number Average Value Number Average Value Number Average Value Number Average Value
LOANS ORIGINATED 620 $122,679 1,270 $122,566 3,828 $108,265 105 $23,627 393 $95,557 APPLICATIONS APPROVED, NOT ACCEPTED 31 $124,740 150 $125,503 378 $108,788 16 $36,882 50 $109,094 APPLICATIONS DENIED 72 $125,503 164 $108,365 1,135 $106,276 93 $26,263 58 $89,002 APPLICATIONS WITHDRAWN 81 $132,497 191 $118,632 802 $115,996 26 $45,962 52 $88,384 FILES CLOSED FOR INCOMPLETENESS 14 $116,959 33 $138,515 124 $118,423 7 $17,869 15 $113,242
Aggregated Statistics For Year 2002(Based on 2 full and 2 partial tracts) A) FHA, FSA/RHS & VA B) Conventional C) Refinancings D) Home Improvement Loans F) Non-occupant Loans on Number Average Value Number Average Value Number Average Value Number Average Value Number Average Value
LOANS ORIGINATED 199 $114,191 340 $118,050 971 $108,304 76 $22,640 62 $82,860 APPLICATIONS APPROVED, NOT ACCEPTED 14 $124,784 46 $104,555 94 $101,308 11 $29,700 7 $74,660 APPLICATIONS DENIED 12 $133,192 64 $90,742 329 $102,410 30 $20,288 13 $82,377 APPLICATIONS WITHDRAWN 7 $92,451 35 $119,414 241 $110,559 20 $28,017 8 $61,361 FILES CLOSED FOR INCOMPLETENESS 1 $104,820 14 $97,043 49 $110,185 0 $0 2 $75,305
Aggregated Statistics For Year 2001(Based on 2 full and 2 partial tracts) A) FHA, FSA/RHS & VA B) Conventional C) Refinancings D) Home Improvement Loans F) Non-occupant Loans on Number Average Value Number Average Value Number Average Value Number Average Value Number Average Value
LOANS ORIGINATED 208 $105,717 282 $107,843 836 $101,413 82 $21,686 101 $97,822 APPLICATIONS APPROVED, NOT ACCEPTED 4 $121,198 25 $97,700 89 $93,478 23 $27,045 5 $111,322 APPLICATIONS DENIED 17 $102,695 38 $85,087 397 $91,791 56 $16,522 15 $93,031 APPLICATIONS WITHDRAWN 17 $105,916 25 $119,721 240 $100,923 22 $26,633 11 $124,780 FILES CLOSED FOR INCOMPLETENESS 1 $54,000 10 $84,239 36 $138,198 3 $60,140 2 $43,500
Aggregated Statistics For Year 2000(Based on 2 full and 2 partial tracts) A) FHA, FSA/RHS & VA B) Conventional C) Refinancings D) Home Improvement Loans F) Non-occupant Loans on Number Average Value Number Average Value Number Average Value Number Average Value Number Average Value
LOANS ORIGINATED 141 $106,823 228 $108,890 222 $85,149 73 $22,621 28 $77,458 APPLICATIONS APPROVED, NOT ACCEPTED 4 $83,848 29 $102,203 63 $80,672 29 $21,466 3 $131,040 APPLICATIONS DENIED 20 $97,604 85 $83,571 264 $84,012 56 $22,245 15 $90,108 APPLICATIONS WITHDRAWN 15 $103,803 31 $100,855 139 $78,323 8 $20,976 2 $75,690 FILES CLOSED FOR INCOMPLETENESS 2 $83,660 7 $54,447 21 $101,331 2 $36,500 2 $81,500
Aggregated Statistics For Year 1999(Based on 5 full and 4 partial tracts) A) FHA, FSA/RHS & VA B) Conventional C) Refinancings D) Home Improvement Loans F) Non-occupant Loans on Number Average Value Number Average Value Number Average Value Number Average Value Number Average Value
LOANS ORIGINATED 484 $99,260 610 $95,057 1,042 $85,489 166 $17,293 131 $70,892 APPLICATIONS APPROVED, NOT ACCEPTED 16 $101,646 113 $85,931 294 $81,138 57 $20,821 27 $73,181 APPLICATIONS DENIED 50 $105,267 216 $75,256 581 $80,247 130 $23,509 36 $72,885 APPLICATIONS WITHDRAWN 47 $105,817 99 $97,798 332 $87,443 29 $56,915 15 $75,410 FILES CLOSED FOR INCOMPLETENESS 15 $94,085 23 $112,169 91 $100,466 2 $23,695 6 $88,800
Detailed mortgage data for all 11 tracts in Rio Rancho, NM
Private Mortgage Insurance Companies Aggregated Statistics For Year 2009(Based on 8 full and 3 partial tracts) A) Conventional B) Refinancings C) Non-occupant Loans on Number Average Value Number Average Value Number Average Value
LOANS ORIGINATED 69 $246,158 83 $218,657 4 $230,382 APPLICATIONS APPROVED, NOT ACCEPTED 54 $250,676 27 $229,234 6 $189,602 APPLICATIONS DENIED 14 $210,568 17 $263,192 0 $0 APPLICATIONS WITHDRAWN 1 $326,500 6 $272,772 0 $0 FILES CLOSED FOR INCOMPLETENESS 2 $278,970 4 $202,282 0 $0
Aggregated Statistics For Year 2008(Based on 8 full and 3 partial tracts) A) Conventional B) Refinancings C) Non-occupant Loans on Number Average Value Number Average Value Number Average Value
LOANS ORIGINATED 324 $214,465 175 $202,355 32 $183,369 APPLICATIONS APPROVED, NOT ACCEPTED 121 $217,207 98 $233,543 13 $238,184 APPLICATIONS DENIED 19 $201,290 15 $216,105 11 $195,756 APPLICATIONS WITHDRAWN 15 $228,493 14 $243,041 3 $334,793 FILES CLOSED FOR INCOMPLETENESS 8 $232,032 7 $187,209 6 $163,857
Aggregated Statistics For Year 2007(Based on 8 full and 3 partial tracts) A) Conventional B) Refinancings C) Non-occupant Loans on Number Average Value Number Average Value Number Average Value
LOANS ORIGINATED 461 $177,207 272 $191,133 58 $166,371 APPLICATIONS APPROVED, NOT ACCEPTED 68 $190,389 50 $208,790 9 $196,543 APPLICATIONS DENIED 7 $174,107 8 $209,380 2 $78,230 APPLICATIONS WITHDRAWN 19 $154,923 14 $212,901 2 $199,955 FILES CLOSED FOR INCOMPLETENESS 1 $119,590 2 $202,145 0 $0
Aggregated Statistics For Year 2006(Based on 8 full and 3 partial tracts) A) Conventional B) Refinancings C) Non-occupant Loans on D) Loans On Manufactured Number Average Value Number Average Value Number Average Value Number Average Value
LOANS ORIGINATED 309 $168,402 171 $185,175 61 $159,697 2 $108,685 APPLICATIONS APPROVED, NOT ACCEPTED 59 $169,202 24 $222,355 29 $156,084 0 $0 APPLICATIONS DENIED 2 $163,000 1 $185,890 1 $153,000 0 $0 APPLICATIONS WITHDRAWN 13 $180,094 10 $198,708 5 $187,052 1 $72,710 FILES CLOSED FOR INCOMPLETENESS 1 $124,000 1 $155,000 1 $124,000 0 $0
Aggregated Statistics For Year 2005(Based on 8 full and 3 partial tracts) A) Conventional B) Refinancings C) Non-occupant Loans on D) Loans On Manufactured Number Average Value Number Average Value Number Average Value Number Average Value
LOANS ORIGINATED 346 $160,635 156 $146,079 80 $128,551 1 $99,720 APPLICATIONS APPROVED, NOT ACCEPTED 60 $143,122 40 $152,273 17 $110,379 0 $0 APPLICATIONS DENIED 1 $159,610 4 $219,922 4 $209,395 0 $0 APPLICATIONS WITHDRAWN 22 $156,667 9 $182,267 6 $105,587 0 $0 FILES CLOSED FOR INCOMPLETENESS 0 $0 0 $0 0 $0 0 $0
Aggregated Statistics For Year 2004(Based on 8 full and 3 partial tracts) A) Conventional B) Refinancings C) Non-occupant Loans on D) Loans On Manufactured Number Average Value Number Average Value Number Average Value Number Average Value
LOANS ORIGINATED 365 $142,109 162 $132,284 93 $117,506 2 $91,145 APPLICATIONS APPROVED, NOT ACCEPTED 57 $141,047 50 $136,370 26 $111,859 0 $0 APPLICATIONS DENIED 4 $157,572 2 $93,975 2 $119,000 0 $0 APPLICATIONS WITHDRAWN 17 $160,159 9 $126,377 5 $127,420 0 $0 FILES CLOSED FOR INCOMPLETENESS 3 $147,690 1 $83,210 0 $0 0 $0
Aggregated Statistics For Year 2003(Based on 8 full and 3 partial tracts) A) Conventional B) Refinancings C) Non-occupant Loans on Number Average Value Number Average Value Number Average Value
LOANS ORIGINATED 309 $134,742 539 $127,003 78 $101,383 APPLICATIONS APPROVED, NOT ACCEPTED 34 $131,648 75 $127,710 10 $94,307 APPLICATIONS DENIED 3 $87,000 1 $137,760 2 $78,245 APPLICATIONS WITHDRAWN 6 $106,667 18 $121,214 4 $86,175 FILES CLOSED FOR INCOMPLETENESS 1 $191,070 0 $0 0 $0
Aggregated Statistics For Year 2002(Based on 2 full and 2 partial tracts) A) Conventional B) Refinancings C) Non-occupant Loans on Number Average Value Number Average Value Number Average Value
LOANS ORIGINATED 105 $123,930 139 $131,238 13 $98,528 APPLICATIONS APPROVED, NOT ACCEPTED 15 $101,440 26 $128,538 4 $71,745 APPLICATIONS DENIED 1 $106,620 6 $104,233 1 $130,000 APPLICATIONS WITHDRAWN 3 $120,720 8 $128,928 0 $0 FILES CLOSED FOR INCOMPLETENESS 0 $0 1 $119,280 0 $0
Aggregated Statistics For Year 2001(Based on 2 full and 2 partial tracts) A) Conventional B) Refinancings C) Non-occupant Loans on Number Average Value Number Average Value Number Average Value
LOANS ORIGINATED 107 $125,184 132 $119,990 12 $82,570 APPLICATIONS APPROVED, NOT ACCEPTED 14 $128,860 19 $140,579 2 $127,585 APPLICATIONS DENIED 3 $104,303 1 $112,050 1 $112,050 APPLICATIONS WITHDRAWN 2 $135,805 3 $105,000 3 $83,800 FILES CLOSED FOR INCOMPLETENESS 1 $108,310 1 $181,610 0 $0
Aggregated Statistics For Year 2000(Based on 2 full and 2 partial tracts) A) Conventional B) Refinancings C) Non-occupant Loans on Number Average Value Number Average Value Number Average Value
LOANS ORIGINATED 83 $123,041 36 $119,468 7 $84,134 APPLICATIONS APPROVED, NOT ACCEPTED 5 $133,446 9 $124,746 0 $0 APPLICATIONS DENIED 3 $111,557 3 $119,460 2 $81,620 APPLICATIONS WITHDRAWN 1 $270,760 6 $102,500 0 $0 FILES CLOSED FOR INCOMPLETENESS 2 $165,100 2 $88,000 0 $0
Aggregated Statistics For Year 1999(Based on 5 full and 4 partial tracts) A) Conventional B) Refinancings C) Non-occupant Loans on Number Average Value Number Average Value Number Average Value
LOANS ORIGINATED 227 $114,873 152 $111,098 27 $93,855 APPLICATIONS APPROVED, NOT ACCEPTED 8 $93,565 21 $102,297 2 $76,405 APPLICATIONS DENIED 11 $117,645 9 $88,010 1 $103,510 APPLICATIONS WITHDRAWN 6 $163,250 3 $116,160 0 $0 FILES CLOSED FOR INCOMPLETENESS 0 $0 1 $79,200 0 $0
Fire-safe hotels and motels in Rio Rancho, New Mexico:
Howard Johnson Rio Rancho/Albuquerque North, 1465 Rio Rancho Blvd SE, Rio Rancho, New Mexico 87124 Phone: (505) 892-1700, Fax: (505) 892-4628
Extended Stay America - Albuquerque - Rio Rancho Blvd, 2221 Rio Rancho Blvd Hwy 528, Rio Rancho, New Mexico 87124 Phone: (505) 892-7900, Fax: (505) 892-7999
Extended Stay America - Albuquerque - Rio Rancho, 2608 The American Rd NW, Rio Rancho, New Mexico 87124 Phone: (505) 792-1338, Fax: (505) 792-1329
Quality Inn Rio Rancho, 4081 High Resort Boulevard SE, Rio Rancho, New Mexico 87124 Phone: (505) 892-5998, Fax: (505) 892-9131
Hilton Garden Inn - Albuquerque North/ Rio Rancho, 1771 Rio Rancho Blvd, Rio Rancho, New Mexico 87124 Phone: (505) 896-1111, Fax: (505) 896-2100
Days Inn Of Rio Rancho, 4200 Crestview Dr, Rio Rancho, New Mexico 87124 Phone: (505) 892-8800, Fax: (505) 896-3321
All 6 fire-safe hotels and motels in Rio Rancho, New Mexico
Most common first names in Rio Rancho, NM among deceased individuals Name Count Lived (average)
John 181 73.8 years Mary 142 79.8 years Robert 117 75.4 years William 100 75.7 years Joseph 94 76.2 years James 86 74.4 years Charles 69 76.7 years Margaret 69 81.2 years Helen 67 80.4 years Dorothy 64 79.1 years
Most common last names in Rio Rancho, NM among deceased individuals Last name Count Lived (average)
Smith 47 77.2 years Garcia 32 72.5 years Miller 30 79.2 years Johnson 28 75.7 years Martinez 26 77.0 years Brown 24 72.2 years Jones 19 79.4 years Romero 18 73.4 years Thompson 16 83.2 years Nelson 16 80.9 years
Rio Rancho compared to New Mexico state average:
Unemployed percentage significantly below state average. Black race population percentage above state average. Hispanic race population percentage above state average. Length of stay since moving in significantly below state average. House age significantly below state average. Number of college students above state average. Percentage of population with a bachelor's degree or higher above state average. Rio Rancho on our top lists :
#4 on the list of "Top 101 cities with largest percentage of females in occupations: construction and extraction occupations (population 50,000+)"
#13 on the list of "Top 101 cities with the largest differences between daily high and daily low temperatures (population 50,000+)"
#17 on the list of "Top 101 cities with the largest percentage of one, detached housing units in structures (20,000+ housing units)"
#19 on the list of "Top 101 cities with largest percentage of females in industries: arts, entertainment, and recreation (population 50,000+)"
#21 on the list of "Top 101 cities with largest percentage of males in occupations: architecture and engineering occupations (population 50,000+)"
#21 on the list of "Top 101 cities with largest percentage of females in occupations: community and social service occupations (population 50,000+)"
#26 on the list of "Top 101 cities with most building permits per 10,000 residents (population 50,000+)"
#35 on the list of "Top 101 cities with the largest percentage of likely lesbian couples (counted as self-reported female-female unmarried-partner households) (population 50,000+)"
#35 on the list of "Top 101 cities with the lowest maximum monthly morning or afternoon humidity (population 50,000+)"
#35 on the list of "Top 101 cities with the lowest average humidity (population 50,000+)"
#39 on the list of "Top 101 cities with the lowest minimum monthly morning or afternoon humidity (population 50,000+)"
#41 on the list of "Top 101 cities with largest percentage of females in occupations: business and financial operations occupations (population 50,000+)"
#42 on the list of "Top 101 cities with the most users submitting photos to our site per 10,000 residents (population 50,000+)"
#42 on the list of "Top 101 cities with the most people born in other U.S. states (population 50,000+)"
#42 on the list of "Top 101 cities with the smallest household incomes disparities (population 50,000+)"
#44 on the list of "Top 101 cities with the smallest sunshine amount differences during a year (population 50,000+)"
#46 on the list of "Top 101 cities with the lowest average yearly precipitation (population 50,000+)"
#49 on the list of "Top 101 cities with largest percentage of females in occupations: legal occupations (population 50,000+)"
#52 on the list of "Top 101 cities with largest percentage of females in industries: utilities (population 50,000+)"
#55 on the list of "Top 101 cities with largest percentage of females in industries: agriculture, forestry, fishing and hunting (population 50,000+)"
#12 on the list of "Top 101 counties with highest percentage of residents voting for 3rd party candidates in the 2012 Presidential Election"
#21 on the list of "Top 101 counties with the highest Particulate Matter (PM10 ) Annual air pollution readings in 2012 (µg/m3 )"
#22 on the list of "Top 101 counties with the highest ground withdrawal of fresh water for public supply"
#38 on the list of "Top 101 counties with the lowest surface withdrawal of fresh water for public supply"
#59 on the list of "Top 101 counties with the highest percentage of residents that exercised in the past month"
Top Patent Applicants
Nicolas G. Droux (21)
John Michael Stuart (16)
Jonathan Phillips (11)
Sergey A. Dryga (10)
Eleanor L. Schuler (9)
Jeffrey J. Nummerdor (8)
Steven J. Catanach (7)
Claudia Luhrs (7)
J. Michael Stuart (7)
Alexandre Rogozine (6)
Total of 303 patent applications in 2008-2024.

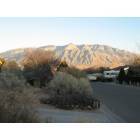
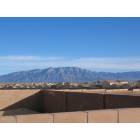


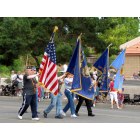

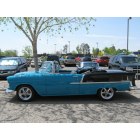
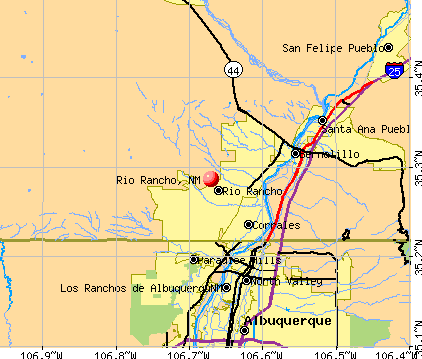


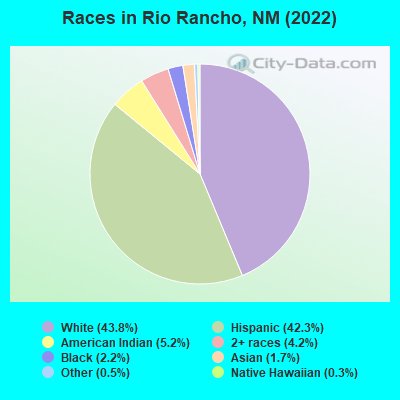
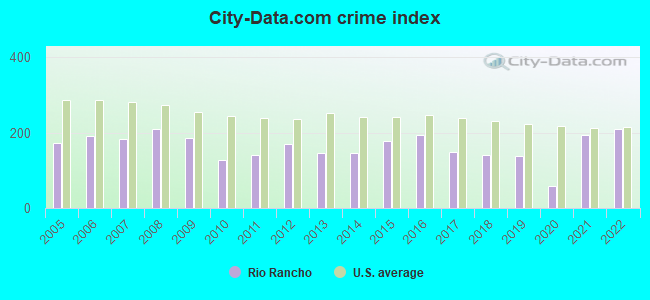
 Recent articles from our blog. Our writers, many of them Ph.D. graduates or candidates, create easy-to-read articles on a wide variety of topics.

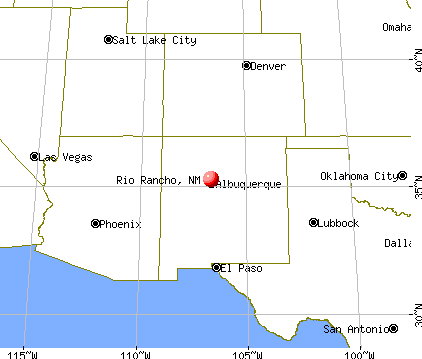
 (12.6 miles
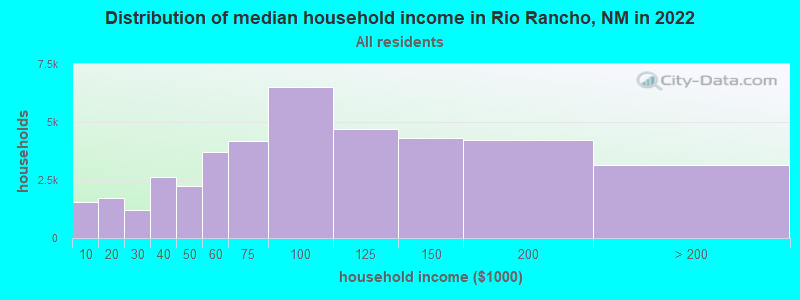


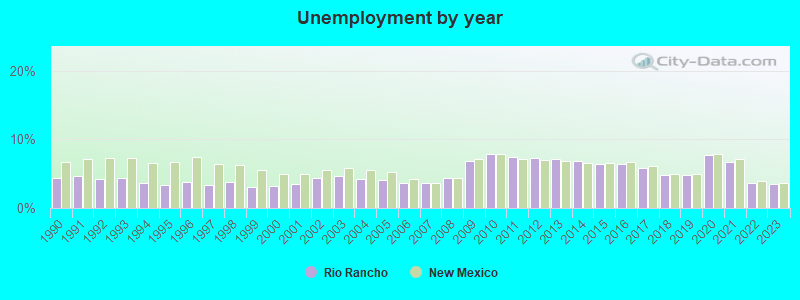
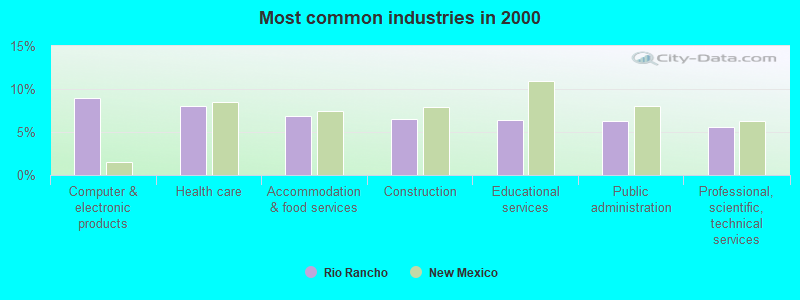
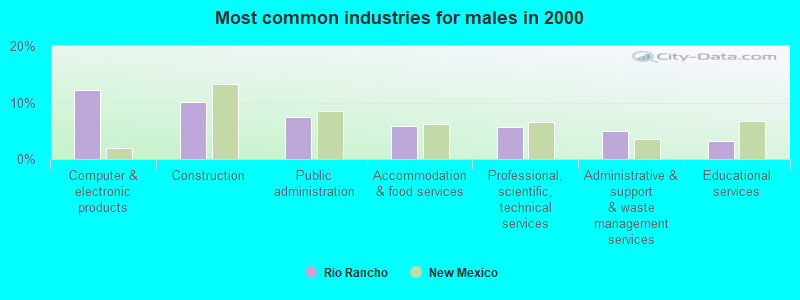
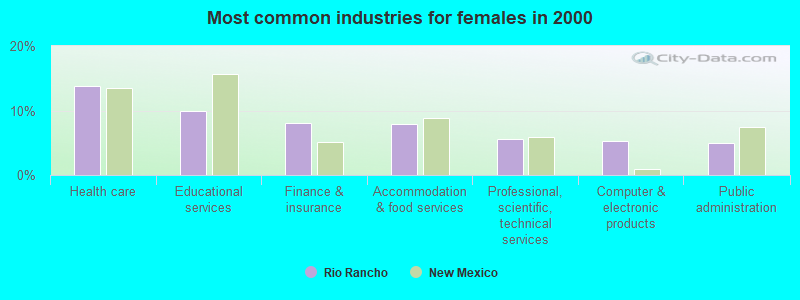
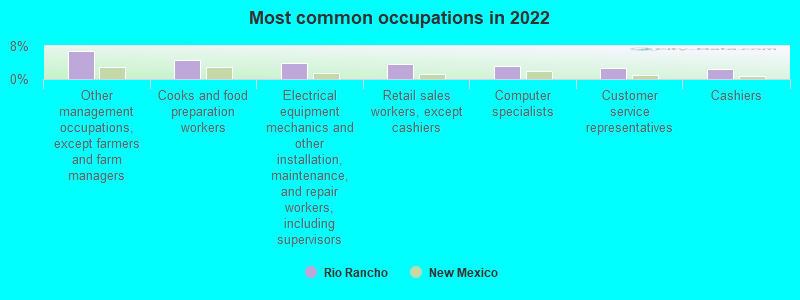

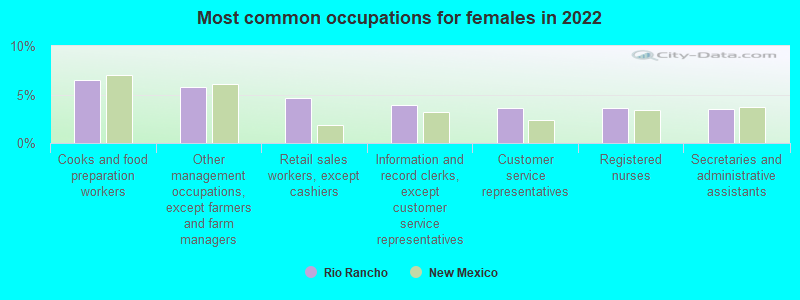
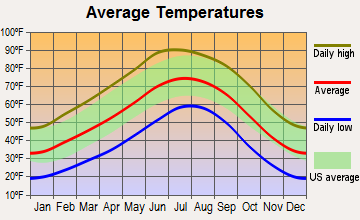
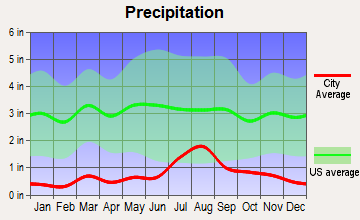
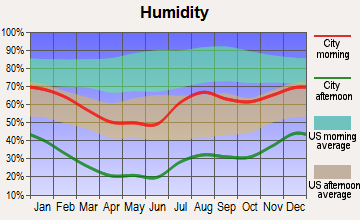


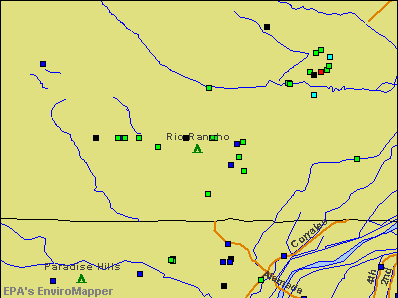

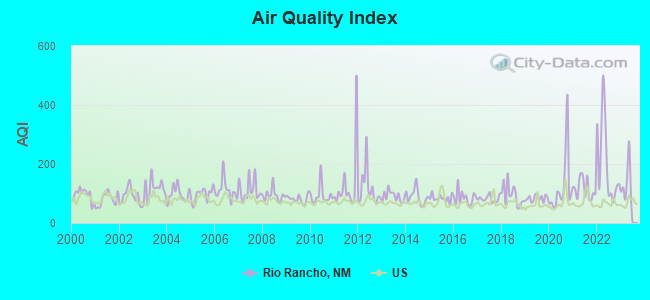
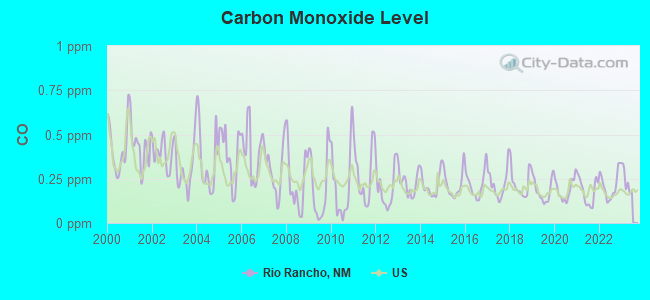
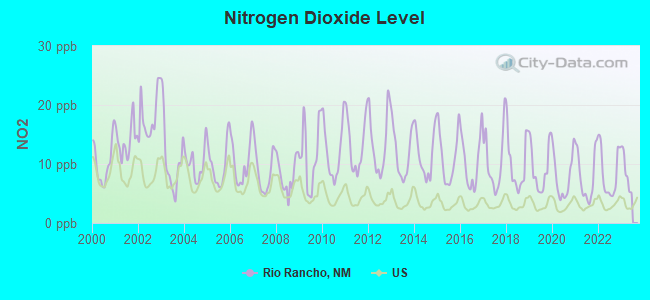
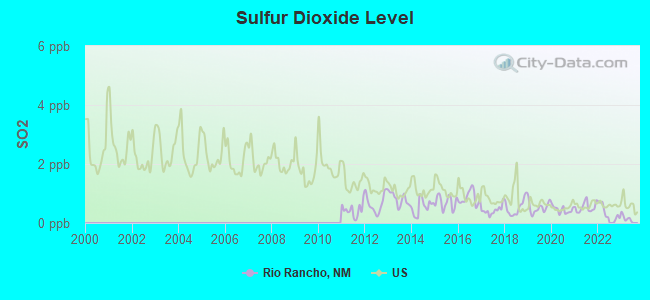

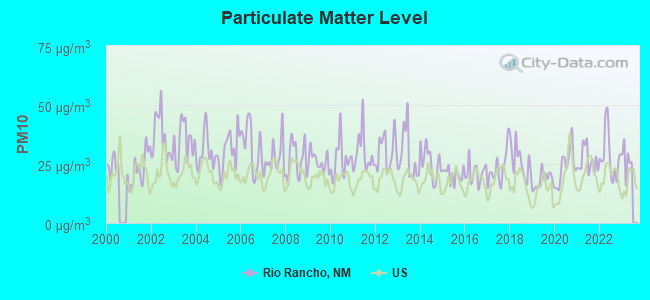
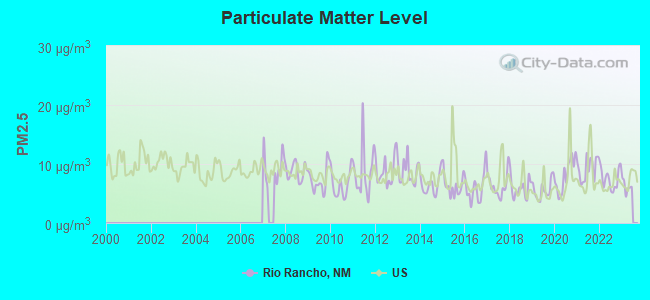
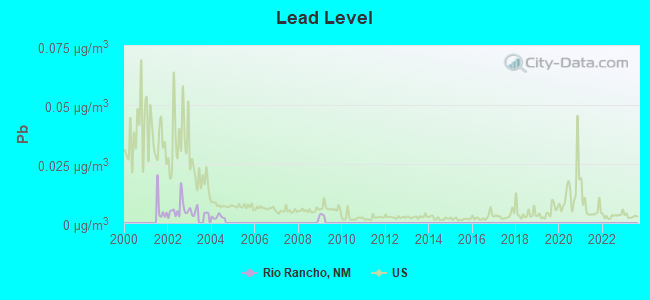
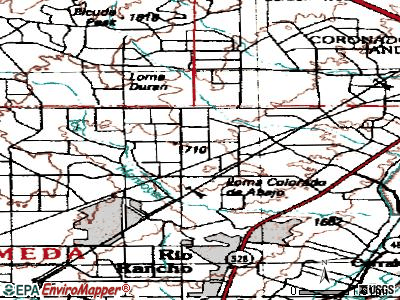
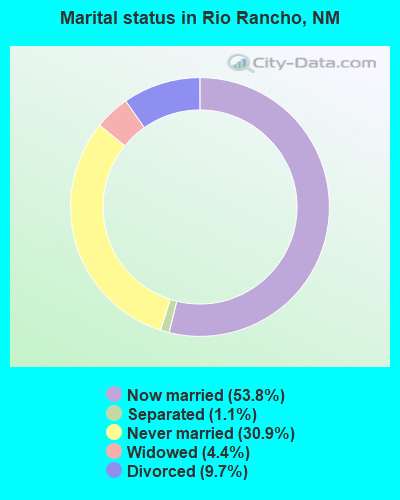
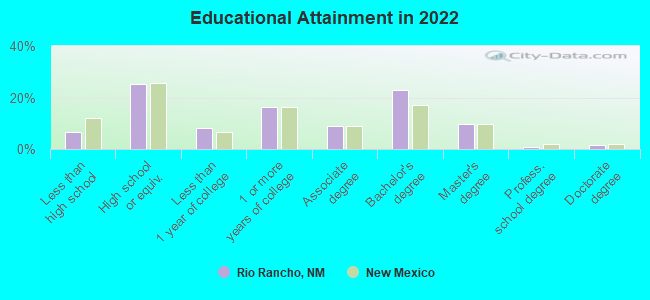
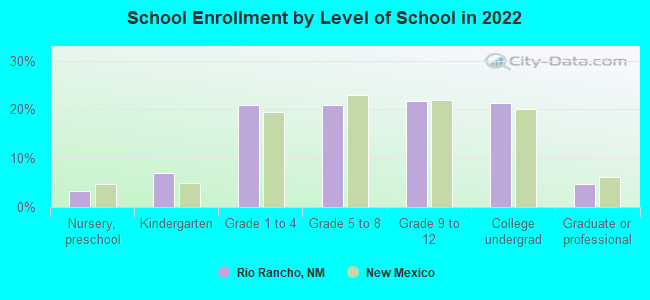
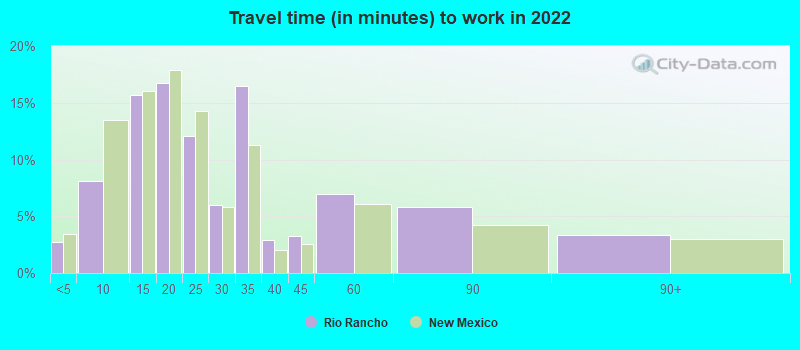
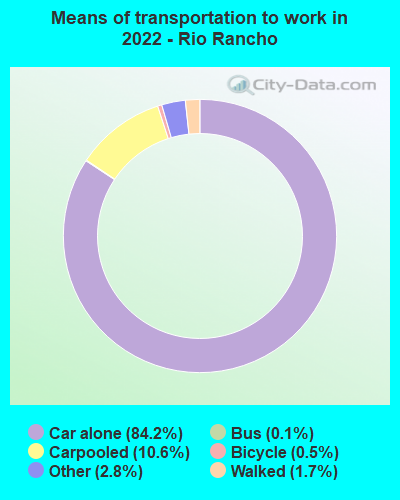
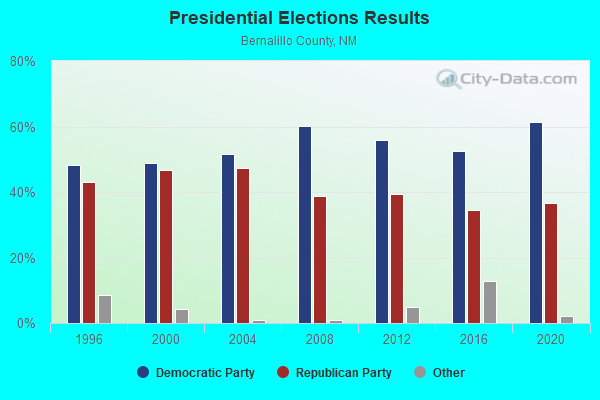
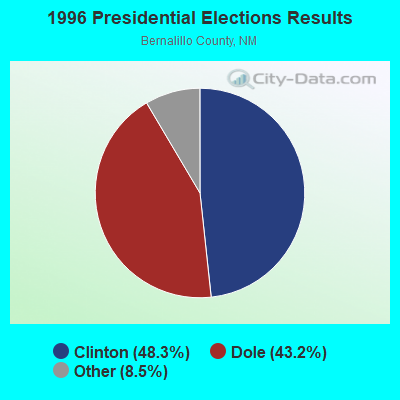
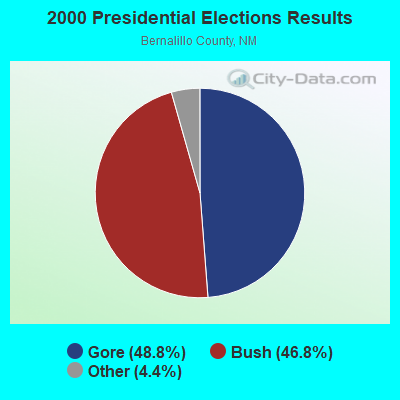
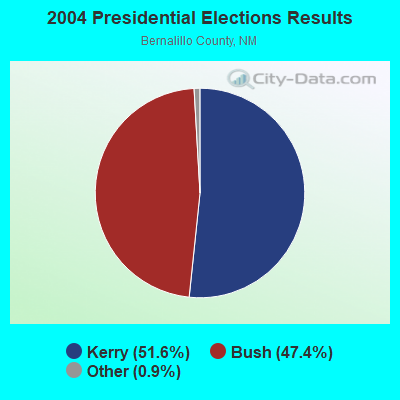
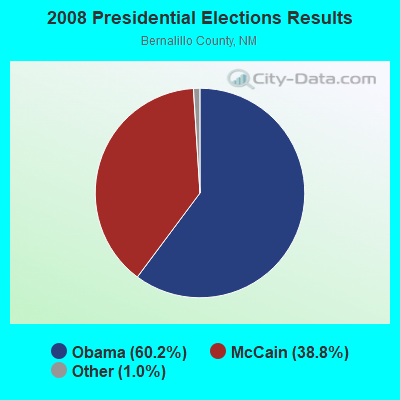
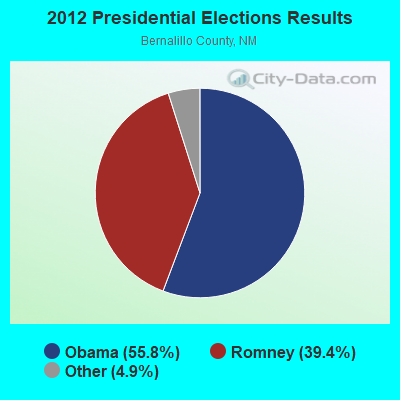
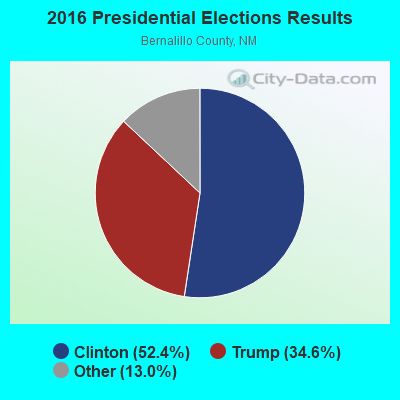
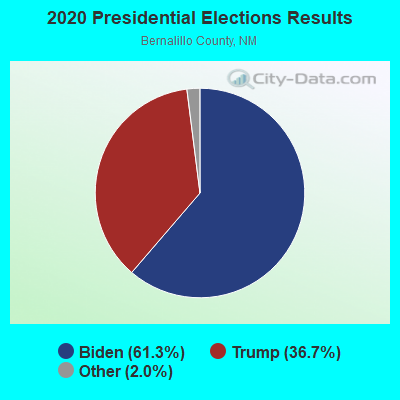
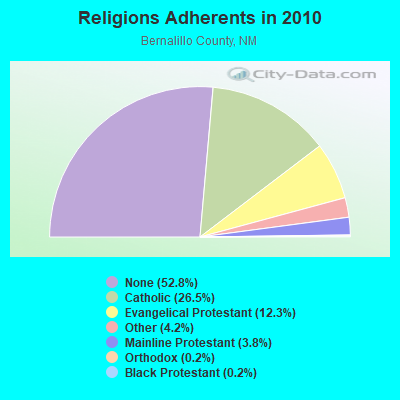
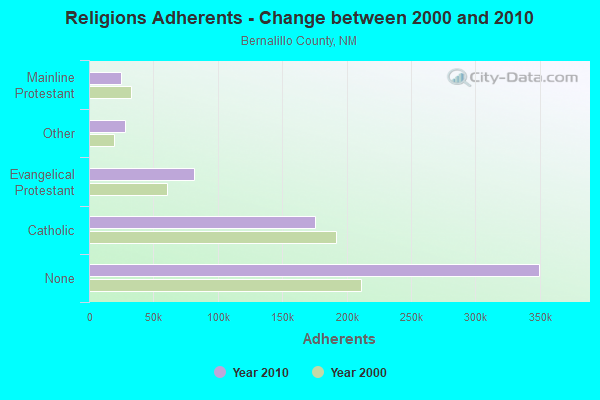
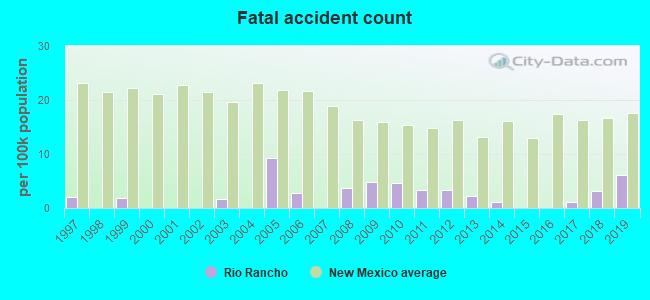
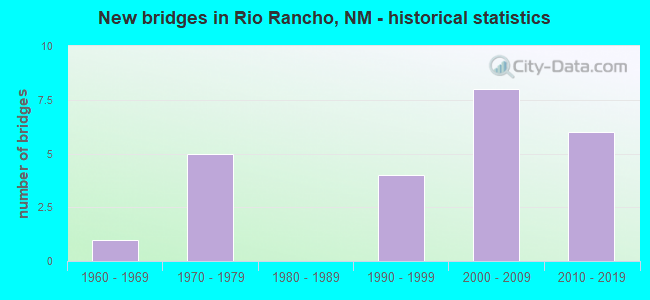
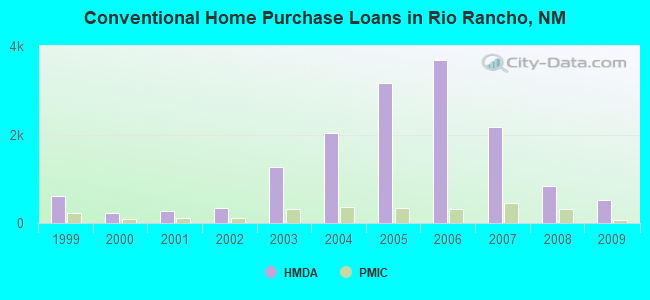
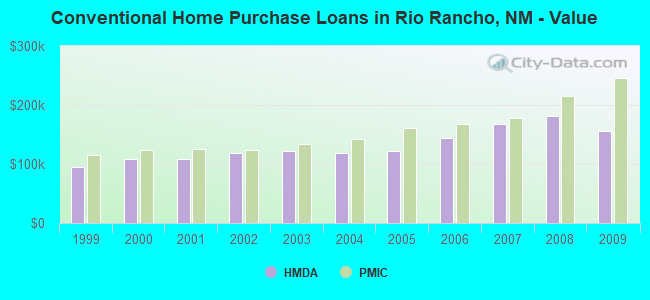
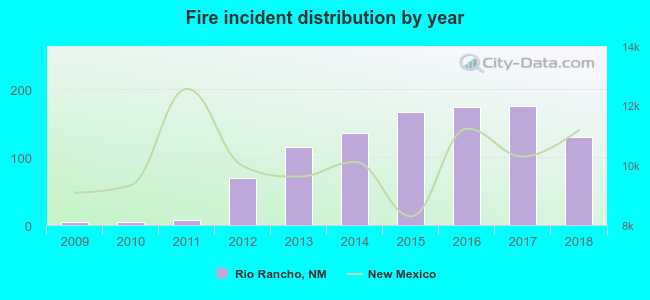 According to the data from the years 2009 - 2018 the average number of fires per year is 98. The highest number of fire incidents - 176 took place in 2017, and the least - 4 in 2009. The data has an increasing trend.
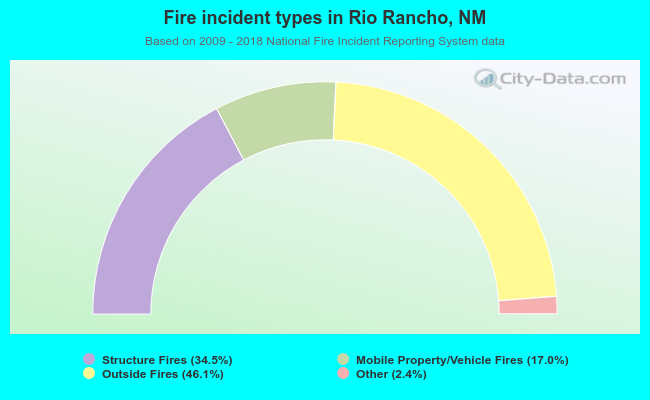 When looking into fire subcategories, the most incidents belonged to: Outside Fires (46.1%), and Structure Fires (34.5%).