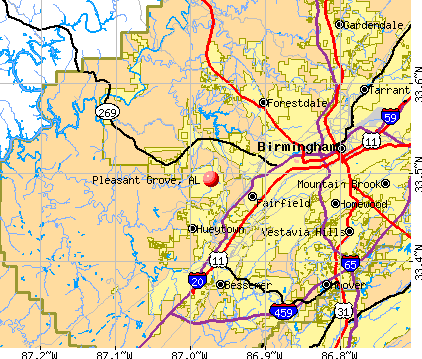
Pleasant Grove, Alabama
Submit your own pictures of this city and show them to the world
- OSM Map
- General Map
- Google Map
- MSN Map
Population change since 2000: -5.4%
 |
| Males: 4,476 | |
| Females: 4,970 |
| Median resident age: | 44.0 years |
| Alabama median age: | 39.6 years |
Zip codes: 35127.
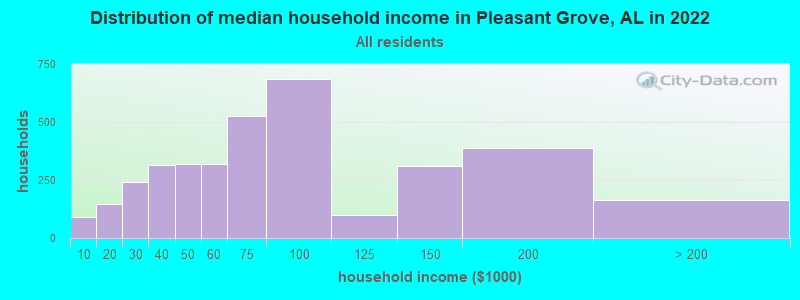
| Pleasant Grove: | $71,052 |
| AL: | $59,674 |
Estimated per capita income in 2022: $34,295 (it was $20,774 in 2000)
Pleasant Grove city income, earnings, and wages data
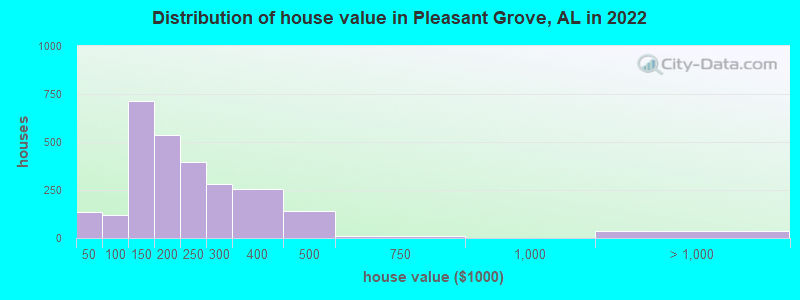
Estimated median house or condo value in 2022: $196,550 (it was $110,600 in 2000)
| Pleasant Grove: | $196,550 |
| AL: | $200,900 |
Mean prices in 2022: all housing units: $309,295; detached houses: $322,061; townhouses or other attached units: $218,406; in 2-unit structures: $208,395; in 3-to-4-unit structures: $229,321; in 5-or-more-unit structures: $282,627; mobile homes: $67,878; occupied boats, rvs, vans, etc.: $104,744
Median gross rent in 2022: $1,193.
Pleasant Grove, AL residents, houses, and apartments details
(17.6% for White Non-Hispanic residents, 7.5% for Black residents, 7.2% for two or more races residents)
Detailed information about poverty and poor residents in Pleasant Grove, AL

Compare current foreclosures in Pleasant Grove, AL:
| Photo | Address | Area | Beds / Baths | Price | Details |
|---|---|---|---|---|---|

|
#1
1st Ave
Pleasant Grove, AL 35127
|
1,125 sq. feet
|
1 baths 3 beds |
$224,500
|
show details |

|
#2
3rd Ave
Pleasant Grove, AL 35127
|
1,312 sq. feet
|
1 baths 3 beds |
$244,900
|
show details |

|
#3
1st Ave
Pleasant Grove, AL 35127
|
1,675 sq. feet
|
2 baths 3 beds |
$15,000
|
show details |

|
#4
10th Ave
Pleasant Grove, AL 35127
|
2,025 sq. feet
|
2 baths 3 beds |
show details | |

|
#5
8th Pl
Pleasant Grove, AL 35127
|
1,922 sq. feet
|
2 baths 3 beds |
show details | |

|
#6
10th Ave
Pleasant Grove, AL 35127
|
1,784 sq. feet
|
2 baths 3 beds |
show details | |

|
#7
3rd Ave
Pleasant Grove, AL 35127
|
1,026 sq. feet
|
2 baths 2 beds |
show details | |

|
#8
4th Ave
Pleasant Grove, AL 35127
|
1,620 sq. feet
|
2 baths 3 beds |
show details | |

|
#9
9th Ave
Pleasant Grove, AL 35127
|
2,468 sq. feet
|
2 baths 3 beds |
show details | |

|
#10
6th St
Pleasant Grove, AL 35127
|
- sq. feet
|
2 baths 3 beds |
show details |
| Photo | Address | Area | Beds / Baths | Price | Details |
|---|---|---|---|---|---|

|
#11
12th Ln
Pleasant Grove, AL 35127
|
2,706 sq. feet
|
2 baths 3 beds |
show details | |

|
#12
12th St
Pleasant Grove, AL 35127
|
2,260 sq. feet
|
2 baths 3 beds |
show details | |

|
#13
4th Ter
Pleasant Grove, AL 35127
|
2,456 sq. feet
|
2 baths 3 beds |
show details | |

|
#14
5th St
Pleasant Grove, AL 35127
|
2,306 sq. feet
|
3 baths 3 beds |
show details | |

|
#15
4th Pl
Pleasant Grove, AL 35127
|
1,539 sq. feet
|
2 baths 3 beds |
show details | |

|
#16
Smithfield Forest Dr
Pleasant Grove, AL 35127
|
2,631 sq. feet
|
3 baths 3 beds |
show details | |

|
#17
13th Ave
Pleasant Grove, AL 35127
|
1,479 sq. feet
|
2 baths 3 beds |
show details | |

|
#18
Smithfield Forest Dr
Pleasant Grove, AL 35127
|
2,428 sq. feet
|
2 baths 4 beds |
show details | |

|
#19
14th Way
Pleasant Grove, AL 35127
|
2,606 sq. feet
|
2 baths 3 beds |
show details | |

|
#20
13th St
Pleasant Grove, AL 35127
|
1,738 sq. feet
|
3 baths 3 beds |
show details |
| Photo | Address | Area | Beds / Baths | Price | Details |
|---|---|---|---|---|---|

|
#21
Park Rd
Pleasant Grove, AL 35127
|
1,292 sq. feet
|
2 baths 2 beds |
show details | |

|
#22
Smithfield Forest Dr
Pleasant Grove, AL 35127
|
3,006 sq. feet
|
2 baths 4 beds |
show details | |

|
#23
14th Place Cir
Pleasant Grove, AL 35127
|
2,764 sq. feet
|
2 baths 3 beds |
show details | |

|
#24
12th Ct
Pleasant Grove, AL 35127
|
1,882 sq. feet
|
2 baths 3 beds |
show details | |

|
#25
13th Way
Pleasant Grove, AL 35127
|
1,823 sq. feet
|
2 baths 4 beds |
show details | |

|
#26
10th Ave
Pleasant Grove, AL 35127
|
1,080 sq. feet
|
1 baths 2 beds |
show details | |

|
#27
12th St
Pleasant Grove, AL 35127
|
1,761 sq. feet
|
3 baths 3 beds |
show details | |

|
#28
Woodridge Cv
Pleasant Grove, AL 35127
|
4,274 sq. feet
|
3 baths 3 beds |
show details | |

|
#29
13th Way
Pleasant Grove, AL 35127
|
1,590 sq. feet
|
2 baths 3 beds |
show details | |

|
#30
9th Ct
Pleasant Grove, AL 35127
|
1,418 sq. feet
|
1 baths 3 beds |
show details |
| Photo | Address | Area | Beds / Baths | Price | Details |
|---|---|---|---|---|---|

|
#31
9th Ct
Pleasant Grove, AL 35127
|
1,425 sq. feet
|
1 baths 3 beds |
show details | |

|
#32
Pleasant Grove Rd
Pleasant Grove, AL 35127
|
2,921 sq. feet
|
1 baths 3 beds |
show details | |

|
#33
Rolling Ridge Cir
Pleasant Grove, AL 35127
|
2,496 sq. feet
|
3 baths 4 beds |
show details | |

|
#34
Fairlane Dr
Pleasant Grove, AL 35127
|
2,044 sq. feet
|
2 baths 3 beds |
show details | |

|
#35
4th Ave
Pleasant Grove, AL 35127
|
1,646 sq. feet
|
2 baths 3 beds |
show details | |

|
#36
Gardenia Cir
Pleasant Grove, AL 35127
|
1,620 sq. feet
|
2 baths 4 beds |
show details | |

|
#37
6th Ave
Pleasant Grove, AL 35127
|
1,640 sq. feet
|
1 baths 3 beds |
show details | |

|
#38
10th Ter
Pleasant Grove, AL 35127
|
1,228 sq. feet
|
2 baths 3 beds |
show details | |

|
#39
Park Rd
Pleasant Grove, AL 35127
|
1,436 sq. feet
|
1 baths 2 beds |
show details | |

|
#40
4th St
Pleasant Grove, AL 35127
|
4,260 sq. feet
|
3 baths 5 beds |
show details |
| Photo | Address | Area | Beds / Baths | Price | Details |
|---|---|---|---|---|---|

|
#41
7th Pl
Pleasant Grove, AL 35127
|
996 sq. feet
|
1 baths 2 beds |
show details | |

|
#42
4th Plz
Pleasant Grove, AL 35127
|
1,693 sq. feet
|
2 baths 3 beds |
show details | |

|
#43
5th Ave
Pleasant Grove, AL 35127
|
2,358 sq. feet
|
2 baths 3 beds |
show details | |

|
#44
12th Plz
Pleasant Grove, AL 35127
|
1,378 sq. feet
|
2 baths 3 beds |
show details | |

|
#45
10th Ct
Pleasant Grove, AL 35127
|
1,418 sq. feet
|
2 baths 3 beds |
show details | |

|
#46
14th Ave
Pleasant Grove, AL 35127
|
3,008 sq. feet
|
2 baths 3 beds |
show details | |

|
#47
Jennifer Dr
Pleasant Grove, AL 35127
|
1,722 sq. feet
|
2 baths 3 beds |
show details | |

|
#48
12th Ter
Pleasant Grove, AL 35127
|
1,711 sq. feet
|
2 baths 3 beds |
show details | |

|
#49
9th Ave
Pleasant Grove, AL 35127
|
1,552 sq. feet
|
1 baths 4 beds |
show details | |

|
Check over 1 million property listings on Foreclosure.com!
|
browse all offers | |||


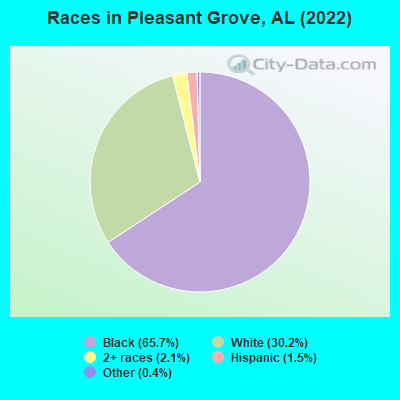
- 6,21165.7%Black alone
- 2,85330.2%White alone
- 1942.1%Two or more races
- 1441.5%Hispanic
- 380.4%Other race alone
- 90.10%Asian alone
According to our research of Alabama and other state lists, there were 12 registered sex offenders living in Pleasant Grove, Alabama as of June 05, 2024.
The ratio of all residents to sex offenders in Pleasant Grove is 858 to 1.
The ratio of registered sex offenders to all residents in this city is lower than the state average.
Type |
2009 |
2010 |
2011 |
2012 |
2013 |
2014 |
2015 |
2016 |
2017 |
2018 |
2019 |
2020 |
2021 |
2022 |
|---|---|---|---|---|---|---|---|---|---|---|---|---|---|---|
| Murders (per 100,000) | 1 (9.7) | 0 (0.0) | 0 (0.0) | 0 (0.0) | 1 (9.6) | 1 (9.6) | 0 (0.0) | 1 (9.7) | 0 (0.0) | 0 (0.0) | 0 (0.0) | 0 (0.0) | 0 (0.0) | 0 (0.0) |
| Rapes (per 100,000) | 2 (19.5) | 1 (9.9) | 2 (19.7) | 2 (19.7) | 1 (9.6) | 0 (0.0) | 4 (38.5) | 0 (0.0) | 1 (9.8) | 2 (19.8) | 3 (29.7) | 1 (10.5) | 1 (10.5) | 3 (31.7) |
| Robberies (per 100,000) | 9 (87.5) | 2 (19.8) | 3 (29.5) | 0 (0.0) | 3 (28.7) | 3 (28.8) | 1 (9.6) | 5 (48.6) | 0 (0.0) | 1 (9.9) | 1 (9.9) | 2 (20.9) | 2 (21.0) | 0 (0.0) |
| Assaults (per 100,000) | 12 (116.7) | 8 (79.1) | 13 (128.0) | 15 (147.7) | 14 (133.8) | 8 (76.7) | 20 (192.6) | 21 (204.0) | 10 (98.1) | 13 (128.6) | 7 (69.3) | 12 (125.6) | 14 (146.9) | 19 (201.0) |
| Burglaries (per 100,000) | 76 (739.2) | 26 (257.2) | 66 (649.7) | 53 (521.8) | 39 (372.7) | 21 (201.4) | 31 (298.6) | 43 (417.8) | 37 (363.1) | 17 (168.2) | 20 (198.0) | 14 (146.6) | 11 (115.4) | 20 (211.6) |
| Thefts (per 100,000) | 164 (1,595) | 130 (1,286) | 123 (1,211) | 92 (905.7) | 89 (850.6) | 94 (901.5) | 110 (1,060) | 138 (1,341) | 116 (1,138) | 102 (1,009) | 56 (554.4) | 60 (628.2) | 31 (325.4) | 65 (687.5) |
| Auto thefts (per 100,000) | 2 (19.5) | 8 (79.1) | 11 (108.3) | 5 (49.2) | 12 (114.7) | 5 (48.0) | 3 (28.9) | 18 (174.9) | 11 (107.9) | 8 (79.2) | 4 (39.6) | 3 (31.4) | 9 (94.5) | 8 (84.6) |
| Arson (per 100,000) | 0 (0.0) | 0 (0.0) | 1 (9.8) | 0 (0.0) | 0 (0.0) | 1 (9.6) | 1 (9.6) | 1 (9.7) | 0 (0.0) | 1 (9.9) | 0 (0.0) | 1 (10.5) | 2 (21.0) | 1 (10.6) |
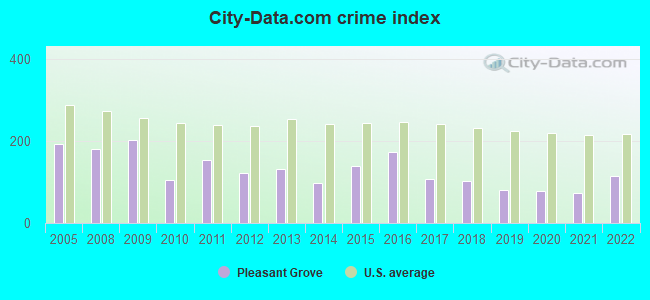
| City-Data.com crime index | 201.7 | 105.4 | 152.8 | 122.0 | 131.4 | 97.2 | 137.8 | 171.7 | 107.1 | 103.0 | 79.8 | 77.7 | 72.7 | 114.7 |
The City-Data.com crime index weighs serious crimes and violent crimes more heavily. Higher means more crime, U.S. average is 246.1. It adjusts for the number of visitors and daily workers commuting into cities.
Crime rate in Pleasant Grove detailed stats: murders, rapes, robberies, assaults, burglaries, thefts, arson
Full-time law enforcement employees in 2021, including police officers: 20 (15 officers - 15 male; 0 female).
| Officers per 1,000 residents here: | 1.57 |
| Alabama average: | 2.40 |
 Recent articles from our blog. Our writers, many of them Ph.D. graduates or candidates, create easy-to-read articles on a wide variety of topics.

 | New York Times Article comparing Birmingham and Nashville (121 replies) |
| I-422 northern beltline.... (143 replies) |
| Financially challenged metro cities! (13 replies) |
| This is kind of huge. (34 replies) |
| What suburbs will rise/fall over the next 10-20 years? (97 replies) |
| moving to the area soon, please help. (8 replies) |
Latest news from Pleasant Grove, AL collected exclusively by city-data.com from local newspapers, TV, and radio stations
Ancestries: American (14.3%), English (3.7%), Irish (3.4%), Scottish (1.7%), German (1.2%), European (1.2%).
Current Local Time: CST time zone
Land area: 8.84 square miles.
Population density: 1,069 people per square mile (low).
87 residents are foreign born
| This city: | 0.9% |
| Alabama: | 3.5% |
Median real estate property taxes paid for housing units with mortgages in 2022: $1,357 (0.6%)
Median real estate property taxes paid for housing units with no mortgage in 2022: $1,197 (0.8%)
Nearest city with pop. 50,000+: Birmingham, AL  (9.5 miles , pop. 242,820).
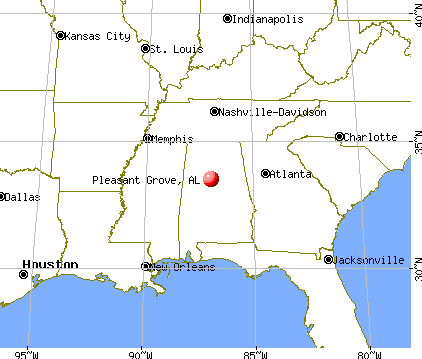
Nearest city with pop. 1,000,000+: Houston, TX (558.2 miles , pop. 1,953,631).
Nearest cities:
), ), ), ), )Latitude: 33.49 N, Longitude: 86.97 W
Daytime population change due to commuting: -3,595 (-38.0%)
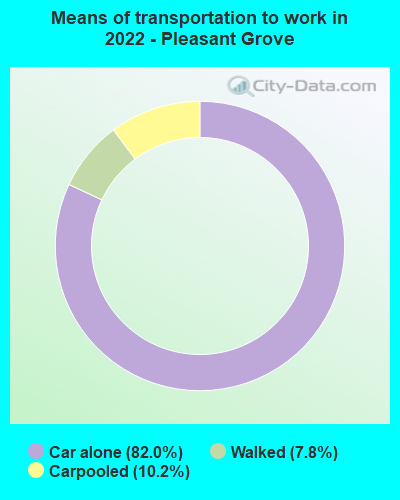
Workers who live and work in this city: 494 (10.1%)

Pleasant Grove, Alabama accommodation & food services, waste management - Economy and Business Data
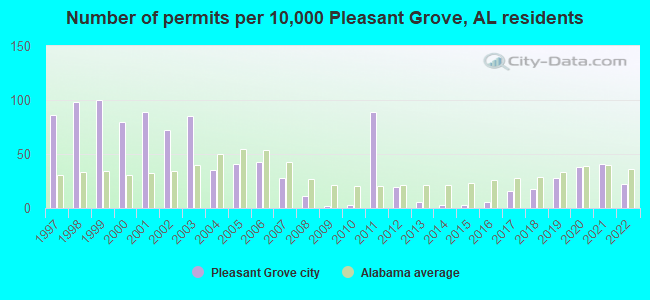
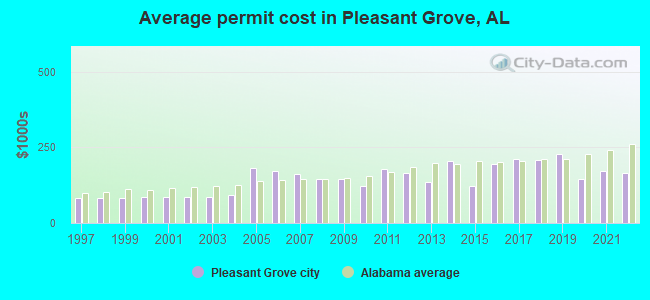
Single-family new house construction building permits:
- 2022: 22 buildings, average cost: $166,200
- 2021: 41 buildings, average cost: $173,300
- 2020: 38 buildings, average cost: $144,900
- 2019: 28 buildings, average cost: $226,700
- 2018: 18 buildings, average cost: $206,700
- 2017: 16 buildings, average cost: $209,600
- 2016: 6 buildings, average cost: $194,100
- 2015: 3 buildings, average cost: $121,700
- 2014: 3 buildings, average cost: $205,000
- 2013: 6 buildings, average cost: $135,800
- 2012: 19 buildings, average cost: $165,900
- 2011: 89 buildings, average cost: $176,500
- 2010: 3 buildings, average cost: $121,000
- 2009: 2 buildings, average cost: $145,000
- 2008: 11 buildings, average cost: $147,000
- 2007: 28 buildings, average cost: $161,300
- 2006: 43 buildings, average cost: $170,900
- 2005: 41 buildings, average cost: $182,300
- 2004: 35 buildings, average cost: $92,200
- 2003: 85 buildings, average cost: $86,700
- 2002: 72 buildings, average cost: $87,000
- 2001: 89 buildings, average cost: $85,900
- 2000: 80 buildings, average cost: $86,300
- 1999: 100 buildings, average cost: $83,600
- 1998: 98 buildings, average cost: $83,600
- 1997: 86 buildings, average cost: $83,600
| Here: | 2.6% |
| Alabama: | 2.6% |
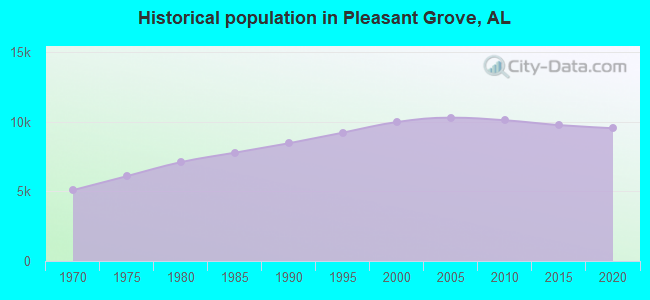
Population change in the 1990s: +1,427 (+16.7%).
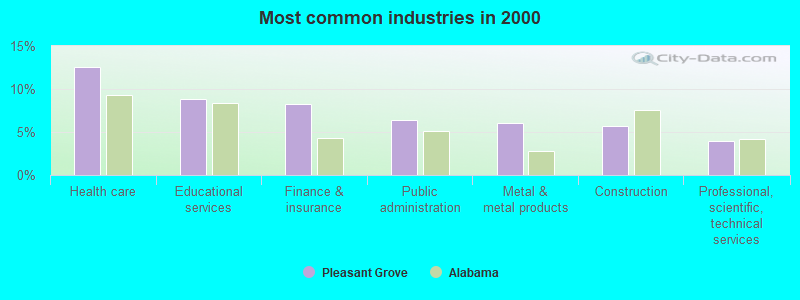
- Health care (12.6%)
- Educational services (8.8%)
- Finance & insurance (8.2%)
- Public administration (6.4%)
- Metal & metal products (6.0%)
- Construction (5.8%)
- Professional, scientific, technical services (3.9%)
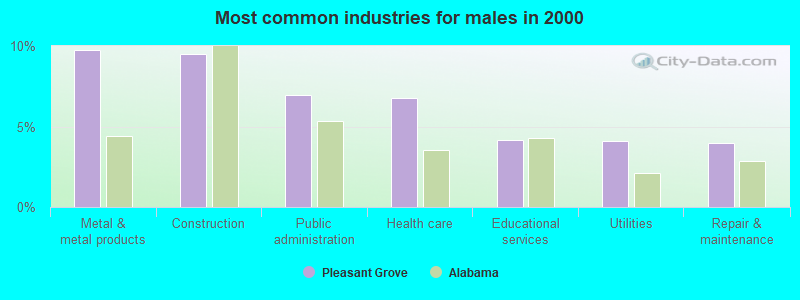
- Metal & metal products (9.7%)
- Construction (9.5%)
- Public administration (7.0%)
- Health care (6.7%)
- Educational services (4.2%)
- Utilities (4.1%)
- Repair & maintenance (4.0%)
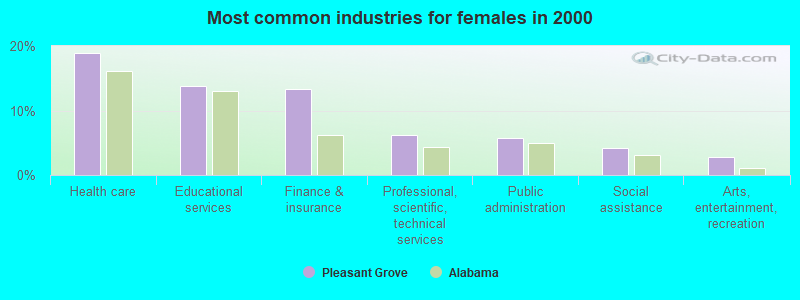
- Health care (19.0%)
- Educational services (13.8%)
- Finance & insurance (13.3%)
- Professional, scientific, technical services (6.2%)
- Public administration (5.8%)
- Social assistance (4.1%)
- Arts, entertainment, recreation (2.8%)

- Secretaries and administrative assistants (5.2%)
- Other office and administrative support workers, including supervisors (4.6%)
- Preschool, kindergarten, elementary, and middle school teachers (4.4%)
- Driver/sales workers and truck drivers (3.7%)
- Other management occupations, except farmers and farm managers (3.6%)
- Material recording, scheduling, dispatching, and distributing workers (3.5%)
- Registered nurses (3.4%)
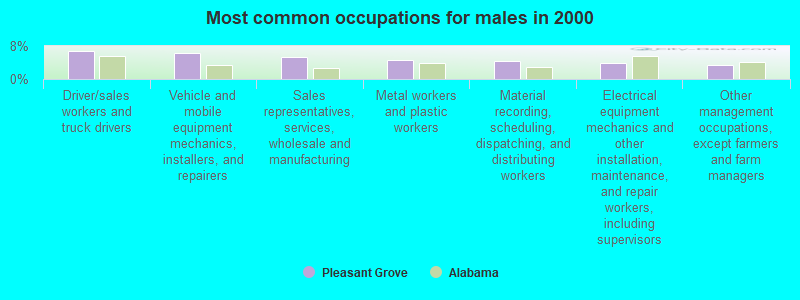
- Driver/sales workers and truck drivers (6.8%)
- Vehicle and mobile equipment mechanics, installers, and repairers (6.2%)
- Sales representatives, services, wholesale and manufacturing (5.2%)
- Metal workers and plastic workers (4.6%)
- Material recording, scheduling, dispatching, and distributing workers (4.5%)
- Electrical equipment mechanics and other installation, maintenance, and repair workers, including supervisors (4.0%)
- Other management occupations, except farmers and farm managers (3.4%)

- Secretaries and administrative assistants (10.8%)
- Other office and administrative support workers, including supervisors (9.1%)
- Preschool, kindergarten, elementary, and middle school teachers (7.4%)
- Registered nurses (6.0%)
- Health technologists and technicians (4.8%)
- Information and record clerks, except customer service representatives (4.6%)
- Other management occupations, except farmers and farm managers (3.9%)
Average climate in Pleasant Grove, Alabama
Based on data reported by over 4,000 weather stations


(lower is better)
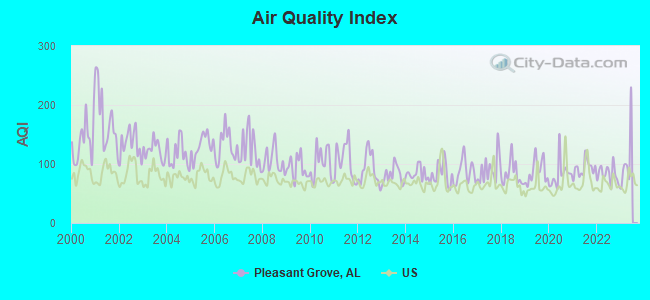
Air Quality Index (AQI) level in 2022 was 82.1. This is about average.
| City: | 82.1 |
| U.S.: | 72.6 |
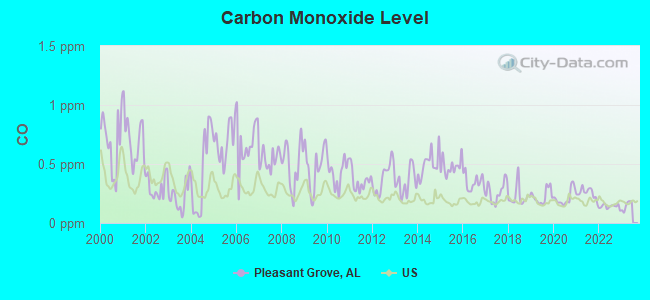
Carbon Monoxide (CO) [ppm] level in 2022 was 0.140. This is significantly better than average. Closest monitor was 3.4 miles away from the city center.
| City: | 0.140 |
| U.S.: | 0.251 |
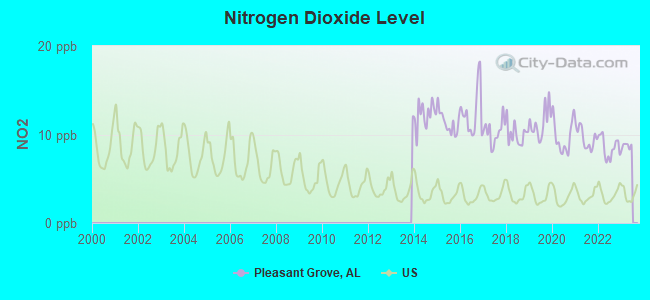
Nitrogen Dioxide (NO2) [ppb] level in 2022 was 8.52. This is significantly worse than average. Closest monitor was 3.4 miles away from the city center.
| City: | 8.52 |
| U.S.: | 5.11 |
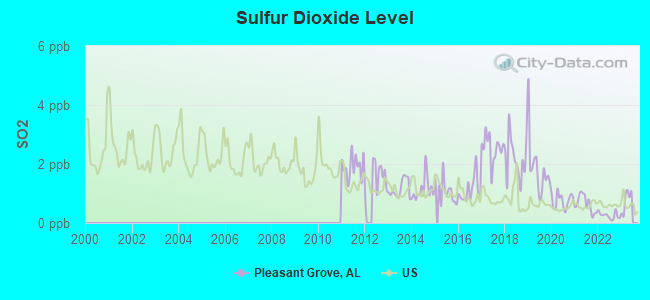
Sulfur Dioxide (SO2) [ppb] level in 2022 was 0.254. This is significantly better than average. Closest monitor was 3.4 miles away from the city center.
| City: | 0.254 |
| U.S.: | 1.515 |
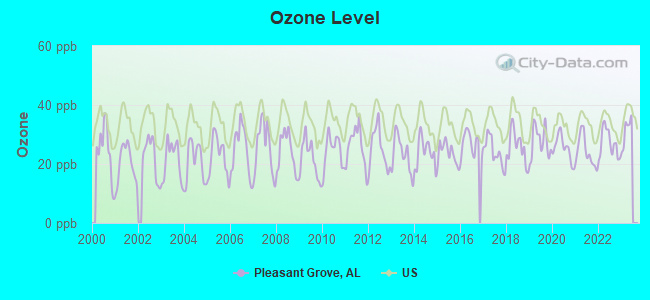
Ozone [ppb] level in 2022 was 27.0. This is better than average. Closest monitor was 3.4 miles away from the city center.
| City: | 27.0 |
| U.S.: | 33.3 |
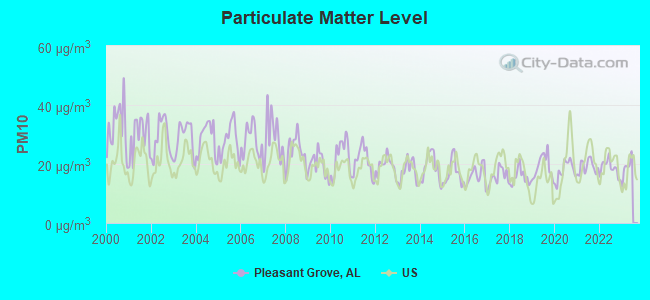
Particulate Matter (PM10) [µg/m3] level in 2022 was 18.6. This is about average. Closest monitor was 2.9 miles away from the city center.
| City: | 18.6 |
| U.S.: | 19.2 |
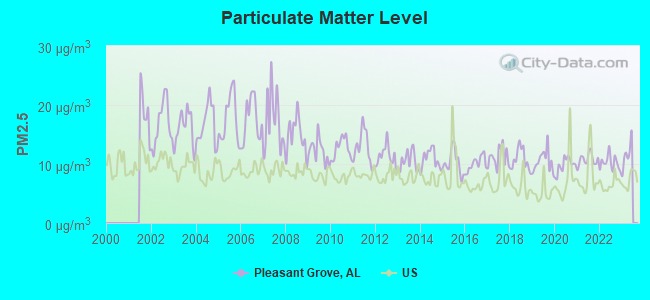
Particulate Matter (PM2.5) [µg/m3] level in 2022 was 10.2. This is worse than average. Closest monitor was 2.9 miles away from the city center.
| City: | 10.2 |
| U.S.: | 8.1 |
Tornado activity:
Pleasant Grove-area historical tornado activity is slightly above Alabama state average. It is 149% greater than the overall U.S. average.
On 4/4/1977, a category F5 (max. wind speeds 261-318 mph) tornado 3.1 miles away from the Pleasant Grove city center killed 22 people and injured 130 people and caused between $5,000,000 and $50,000,000 in damages.
On 4/8/1998, a category F5 tornado 8.5 miles away from the city center killed 32 people and injured 259 people and caused $200 million in damages.
Earthquake activity:
Pleasant Grove-area historical earthquake activity is significantly above Alabama state average. It is 135% greater than the overall U.S. average.On 1/18/1999 at 07:00:53, a magnitude 4.8 (4.8 MB, 4.0 LG, Depth: 0.6 mi, Class: Light, Intensity: IV - V) earthquake occurred 17.4 miles away from Pleasant Grove center
On 4/29/2003 at 08:59:39, a magnitude 4.9 (4.4 MB, 4.6 MW, 4.9 LG) earthquake occurred 103.6 miles away from Pleasant Grove center
On 6/24/1975 at 11:11:36, a magnitude 4.5 (4.5 MB) earthquake occurred 52.4 miles away from the city center
On 10/24/1997 at 08:35:17, a magnitude 4.9 (4.8 MB, 4.2 MS, 4.9 LG, Depth: 6.2 mi) earthquake occurred 164.8 miles away from the city center
On 4/29/2003 at 08:59:39, a magnitude 4.6 (4.6 MW, Depth: 12.3 mi) earthquake occurred 103.6 miles away from the city center
On 11/7/2004 at 11:20:21, a magnitude 4.3 (4.3 MW, Depth: 3.1 mi) earthquake occurred 80.6 miles away from Pleasant Grove center
Magnitude types: regional Lg-wave magnitude (LG), body-wave magnitude (MB), surface-wave magnitude (MS), moment magnitude (MW)
Natural disasters:
The number of natural disasters in Jefferson County (32) is a lot greater than the US average (15).Major Disasters (Presidential) Declared: 24
Emergencies Declared: 6
Causes of natural disasters: Storms: 18, Tornadoes: 16, Floods: 14, Hurricanes: 6, Winds: 6, Drought: 1, Fire: 1, Heavy Rain: 1, Snowfall: 1, Winter Storm: 1, Other: 1 (Note: some incidents may be assigned to more than one category).

Hospitals and medical centers in Pleasant Grove:
Colleges/universities with over 2000 students nearest to Pleasant Grove:
- Lawson State Community College-Birmingham Campus (about 6 miles; Birmingham, AL; Full-time enrollment: 2,695)
- Virginia College-Birmingham (about 10 miles; Birmingham, AL; FT enrollment: 8,167)
- University of Alabama at Birmingham (about 10 miles; Birmingham, AL; FT enrollment: 14,853)
- Samford University (about 11 miles; Birmingham, AL; FT enrollment: 3,829)
- Jefferson State Community College (about 19 miles; Birmingham, AL; FT enrollment: 6,041)
- University of Montevallo (about 28 miles; Montevallo, AL; FT enrollment: 2,826)
- Bevill State Community College (about 30 miles; Jasper, AL; FT enrollment: 2,970)
Public high school in Pleasant Grove:
- PLEASANT GROVE HIGH SCH (Students: 869, Location: 100 SPARTAN DRIVE, Grades: 9-12)
Public elementary/middle schools in Pleasant Grove:
- PLEASANT GROVE ELEM SCH (Students: 921, Location: 601 PARK RD, Grades: KG-5)
- PLEASANT GROVE MIDDLE SCH (Location: 805 SEVENTH AVENUE, Grades: 6-8)
User-submitted facts and corrections:
- First Baptist Church is no longer offering a school. Only a Weekday Education Program through 4 year olds.
Points of interest:
Notable locations in Pleasant Grove: Pleasant Grove City Hall (A), Pleasant Grove Public Library (B), Pleasant Grove Fire and Rescue Service (C). Display/hide their locations on the map
Churches in Pleasant Grove include: Pleasant Grove First Baptist Church (A), Pleasant Grove United Methodist Church (B), Pleasant Grove Church of Christ (C). Display/hide their locations on the map
Cemetery: Mason Cemetery (1). Display/hide its location on the map
Tourist attraction: Jefferson County Public Libraries - Pleasant Grove (Cultural Attractions- Events- & Facilities; 501 Park Road).
Hotel: Sailaway 204 Condo (1021 9th Street).
| This city: | 2.7 people |
| Alabama: | 2.5 people |
| This city: | 76.9% |
| Whole state: | 67.8% |
| This city: | 2.9% |
| Whole state: | 4.7% |
Likely homosexual households (counted as self-reported same-sex unmarried-partner households)
- Lesbian couples: 0.2% of all households
- Gay men: 0.3% of all households
2 people in local jails and other municipal confinement facilities in 2010
252 people in nursing homes in 2000
5 people in local jails and other confinement facilities (including police lockups) in 2000
Banks with branches in Pleasant Grove (2011 data):
- Branch Banking and Trust Company: Pleasant Grove Branch at 27 Park Road, branch established on 1966/08/11. Info updated 2010/03/29: Bank assets: $168,867.6 mil, Deposits: $127,549.5 mil, headquarters in Winston Salem, NC, positive income, Commercial Lending Specialization, 1793 total offices, Holding Company: Bb&T Corporation
- Union State Bank: Pleasant Grove Branch at 829 Park Road, branch established on 1992/11/18. Info updated 2011/02/24: Bank assets: $274.5 mil, Deposits: $250.5 mil, headquarters in Pell City, AL, negative income in the last year, Commercial Lending Specialization, 15 total offices, Holding Company: Union Bancshares, Inc.
For population 15 years and over in Pleasant Grove:
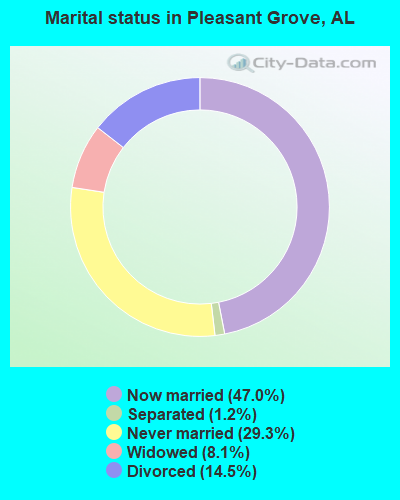
- Never married: 29.3%
- Now married: 47.0%
- Separated: 1.2%
- Widowed: 8.1%
- Divorced: 14.5%
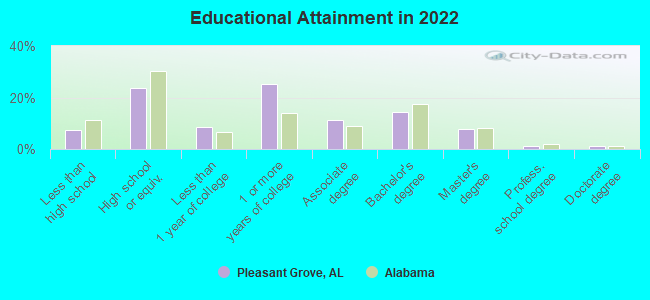
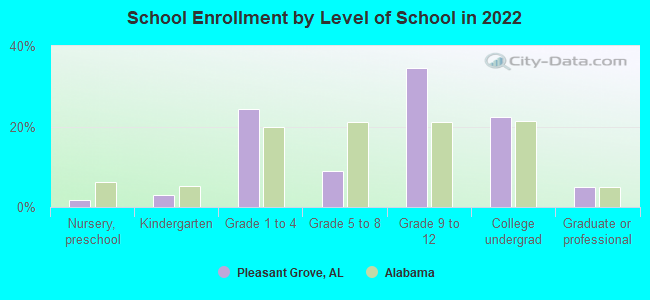
For population 25 years and over in Pleasant Grove:
- High school or higher: 92.7%
- Bachelor's degree or higher: 22.6%
- Graduate or professional degree: 8.6%
- Unemployed: 1.8%
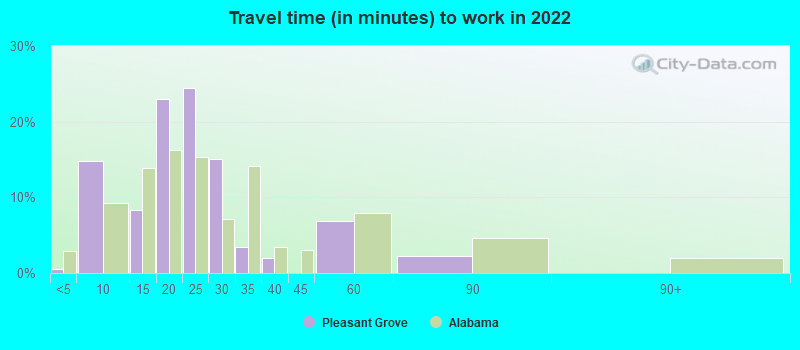
- Mean travel time to work (commute): 23.1 minutes
| Here: | 9.1 |
| Alabama average: | 11.5 |
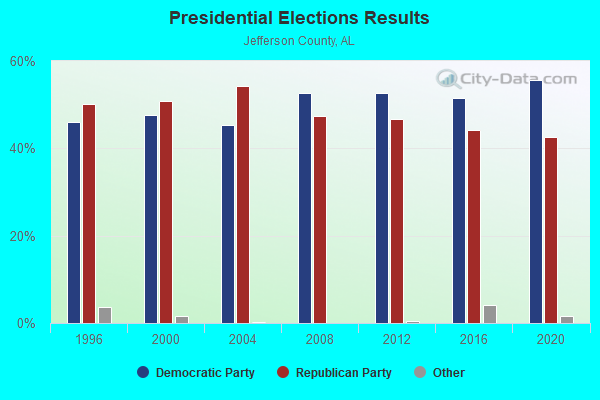
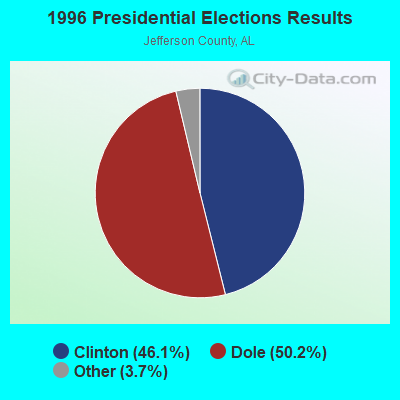
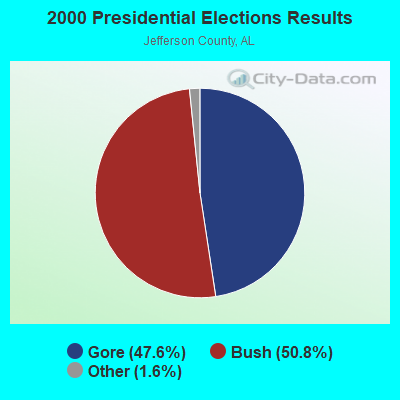


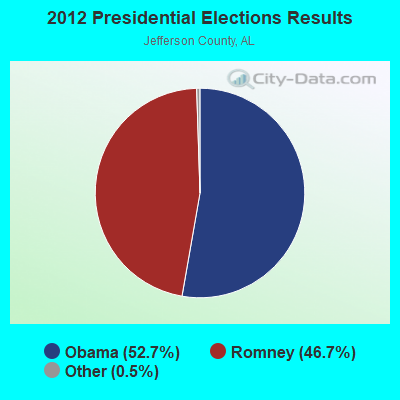


Graphs represent county-level data. Detailed 2008 Election Results
Political contributions by individuals in Pleasant Grove, AL
Religion statistics for Pleasant Grove, AL (based on Jefferson County data)
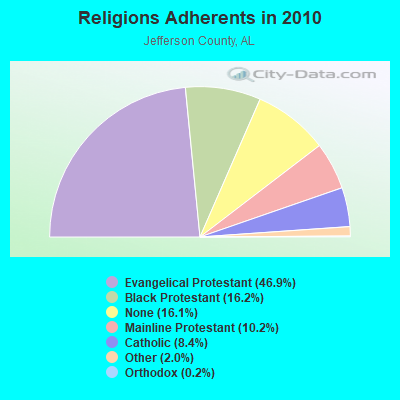
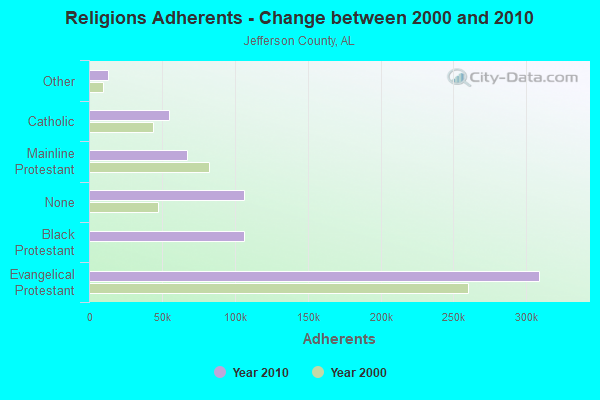
| Religion | Adherents | Congregations |
|---|---|---|
| Evangelical Protestant | 308,984 | 710 |
| Black Protestant | 106,653 | 257 |
| Mainline Protestant | 67,037 | 150 |
| Catholic | 55,083 | 32 |
| Other | 13,073 | 45 |
| Orthodox | 1,424 | 4 |
| None | 106,212 | - |
Food Environment Statistics:
| Jefferson County: | 2.05 / 10,000 pop. |
| State: | 1.89 / 10,000 pop. |
| This county: | 0.18 / 10,000 pop. |
| Alabama: | 0.20 / 10,000 pop. |
| This county: | 0.99 / 10,000 pop. |
| Alabama: | 0.65 / 10,000 pop. |
| This county: | 5.77 / 10,000 pop. |
| Alabama: | 6.32 / 10,000 pop. |
| Jefferson County: | 5.42 / 10,000 pop. |
| Alabama: | 5.75 / 10,000 pop. |
| Jefferson County: | 12.4% |
| Alabama: | 11.8% |
| Jefferson County: | 31.1% |
| Alabama: | 31.7% |
| Jefferson County: | 12.0% |
| Alabama: | 13.5% |
Health and Nutrition:
| Here: | 44.7% |
| State: | 49.0% |
| Pleasant Grove: | 37.9% |
| Alabama: | 45.7% |
| Pleasant Grove: | 28.8 |
| Alabama: | 28.9 |
| This city: | 24.6% |
| State: | 20.7% |
| This city: | 10.8% |
| Alabama: | 11.0% |
| Pleasant Grove: | 6.8 |
| State: | 6.8 |
| Here: | 34.6% |
| Alabama: | 34.4% |
| This city: | 49.0% |
| State: | 55.2% |
| This city: | 75.1% |
| Alabama: | 79.3% |
More about Health and Nutrition of Pleasant Grove, AL Residents
| Local government employment and payroll (March 2022) | |||||
| Function | Full-time employees | Monthly full-time payroll | Average yearly full-time wage | Part-time employees | Monthly part-time payroll |
|---|---|---|---|---|---|
| Police Protection - Officers | 22 | $103,610 | $56,515 | 0 | $0 |
| Firefighters | 15 | $76,870 | $61,496 | 0 | $0 |
| Other Government Administration | 5 | $20,025 | $48,060 | 2 | $1,731 |
| Police - Other | 4 | $14,317 | $42,951 | 1 | $950 |
| Local Libraries | 2 | $4,606 | $27,636 | 0 | $0 |
| Streets and Highways | 1 | $4,482 | $53,784 | 0 | $0 |
| Judicial and Legal | 1 | $5,187 | $62,244 | 0 | $0 |
| Totals for Government | 50 | $229,096 | $54,983 | 3 | $2,680 |
Pleasant Grove government finances - Expenditure in 2017 (per resident):
- Current Operations - Police Protection: $1,850,000 ($195.85)
Local Fire Protection: $1,429,000 ($151.28)
Financial Administration: $696,000 ($73.68)
Solid Waste Management: $693,000 ($73.36)
Regular Highways: $430,000 ($45.52)
Parks and Recreation: $177,000 ($18.74)
Judicial and Legal Services: $118,000 ($12.49)
Central Staff Services: $52,000 ($5.50)
- Other Capital Outlay - General - Other: $1,099,000 ($116.35)
Regular Highways: $244,000 ($25.83)
Pleasant Grove government finances - Revenue in 2017 (per resident):
- Charges - Solid Waste Management: $646,000 ($68.39)
- Miscellaneous - Interest Earnings: $540,000 ($57.17)
General Revenue - Other: $230,000 ($24.35)
Fines and Forfeits: $56,000 ($5.93)
- State Intergovernmental - Other: $1,082,000 ($114.55)
Highways: $265,000 ($28.05)
- Tax - Property: $2,630,000 ($278.42)
Public Utilities Sales: $503,000 ($53.25)
Other License: $183,000 ($19.37)
Pleasant Grove government finances - Cash and Securities in 2017 (per resident):
- Other Funds - Cash and Securities: $14,007,000 ($1482.85)
6.20% of this county's 2020 resident taxpayers moved to other counties in 2021 ($76,918 average adjusted gross income)
| Here: | 6.20% |
| Alabama average: | 6.41% |
0.01% of residents moved to foreign countries ($73 average AGI)
Jefferson County: 0.01% Alabama average: 0.02%
Top counties to which taxpayers relocated from this county between 2020 and 2021:
| to Shelby County, AL | |
| to St. Clair County, AL | |
| to Blount County, AL |
Businesses in Pleasant Grove, AL
- CVS: 1
- Subway: 1
Strongest AM radio stations in Pleasant Grove:
- WJOX (690 AM; 50 kW; BIRMINGHAM, AL; Owner: CITADEL BROADCASTING COMPANY)
- WAPI (1070 AM; 50 kW; BIRMINGHAM, AL; Owner: CITADEL BROADCASTING COMPANY)
- WDJC (850 AM; 50 kW; BIRMINGHAM, AL; Owner: KIMTRON, INC.)
- WERC (960 AM; 5 kW; BIRMINGHAM, AL; Owner: CAPSTAR TX LIMITED PARTNERSHIP)
- WRJS (1320 AM; 5 kW; BIRMINGHAM, AL; Owner: CXR HOLDINGS, INC.)
- WYDE (1260 AM; 5 kW; BIRMINGHAM, AL; Owner: KIMTRON, INC.)
- WATV (900 AM; 1 kW; BIRMINGHAM, AL)
- WSMQ (1450 AM; 1 kW; BESSEMER, AL; Owner: BESSEMER RADIO INC.)
- WJLD (1400 AM; 1 kW; FAIRFIELD, AL; Owner: RICHARDSON BROADCASTING CORPORATION)
- WAYE (1220 AM; 1 kW; BIRMINGHAM, AL; Owner: BIRMINGHAM CHRISTIAN RADIO, INC.)
- WNSI (810 AM; 50 kW; JACKSONVILLE, AL; Owner: UNITED BROADCASTING NETWORK, INC.)
- WLPH (1480 AM; daytime; 5 kW; IRONDALE, AL; Owner: BIRMINGHAM CHRISTIAN RADIO, INC.)
- WCOC (1010 AM; 5 kW; DORA, AL; Owner: AZTECA COMMUNICATIONS OF ALABAMA, INC.)
Strongest FM radio stations in Pleasant Grove:
- WMJJ (96.5 FM; BIRMINGHAM, AL; Owner: CAPSTAR TX LIMITED PARTNERSHIP)
- WQEN (103.7 FM; GADSDEN, AL; Owner: CAPSTAR TX LIMITED PARTNERSHIP)
- WODL (97.3 FM; HOMEWOOD, AL; Owner: CXR HOLDINGS, INC.)
- WZRR (99.5 FM; BIRMINGHAM, AL; Owner: CITADEL BROADCASTING COMPANY)
- WDJC-FM (93.7 FM; BIRMINGHAM, AL; Owner: KIMTRON, INC.)
- WYSF (94.5 FM; BIRMINGHAM, AL; Owner: CITADEL BROADCASTING COMPANY)
- WBHK (98.7 FM; WARRIOR, AL; Owner: CXR HOLDINGS, INC.)
- WZZK-FM (104.7 FM; BIRMINGHAM, AL; Owner: CXR HOLDINGS, INC.)
- WBPT (106.9 FM; BIRMINGHAM, AL; Owner: CXR HOLDINGS, INC.)
- WBHM (90.3 FM; BIRMINGHAM, AL; Owner: BD OF TRUSTEES/U OF AL AT BIRMINGHAM)
- WBFR (89.5 FM; BIRMINGHAM, AL; Owner: FAMILY STATIONS, INC.)
- WDXB (102.5 FM; JASPER, AL; Owner: CAPSTAR TX LIMITED PARTNERSHIP)
- W281AB (104.1 FM; MOUNTAIN BROOK, AL; Owner: FAMILY STATIONS, INC.)
- WRAX (107.7 FM; BIRMINGHAM, AL; Owner: CITADEL BROADCASTING COMPANY)
- WENN (105.9 FM; TRUSSVILLE, AL; Owner: CAPSTAR TX LIMITED PARTNERSHIP)
- WGIB (91.9 FM; BIRMINGHAM, AL; Owner: GLEN IRIS BAPTIST SCHOOL)
- WVSU-FM (91.1 FM; BIRMINGHAM, AL; Owner: SAMFORD UNIVERSITY)
- WQOP-FM (92.5 FM; DORA, AL; Owner: QUEEN OF PEACE RADIO, INC.)
- WLJR (88.5 FM; BIRMINGHAM, AL; Owner: BRIARWOOD PRESBYTERIAN CHURCH)
- WYDE-FM (101.1 FM; CULLMAN, AL; Owner: KIMTRON, INC.)
TV broadcast stations around Pleasant Grove:
- WABM (Channel 68; BIRMINGHAM, AL; Owner: BIRMINGHAM (WABM-TV) LICENSEE, INC.)
- WBXA-CA (Channel 2; BIRMINGHAM, AL; Owner: THE BOX WORLDWIDE LLC)
- WIAT (Channel 42; BIRMINGHAM, AL; Owner: MEDIA GENERAL COMMUNICATIONS, INC.)
- WBIQ (Channel 10; BIRMINGHAM, AL; Owner: ALABAMA EDUCATIONAL TELEVISION COMMISSION)
- WTTO (Channel 21; HOMEWOOD, AL; Owner: WTTO LICENSEE, LLC)
- WBRC (Channel 6; BIRMINGHAM, AL; Owner: WBRC LICENSE, INC.)
- WBMA-LP (Channel 58; BIRMINGHAM, AL; Owner: TV ALABAMA, INC.)
- WVTM-TV (Channel 13; BIRMINGHAM, AL; Owner: BIRMINGHAM BROADCASTING (WVTM-TV), LLC)
- W27CM (Channel 27; BIRMINGHAM, AL; Owner: EQUITY BROADCASTING CORPORATION)
- WDBB (Channel 17; BESSEMER, AL; Owner: WDBB-TV, INC.)
- WCFT-TV (Channel 33; TUSCALOOSA, AL; Owner: TV ALABAMA, INCORPORATED)
- W34BI (Channel 34; BIRMINGHAM, AL; Owner: VENTANA TELEVISION, INC.)
- W46DK (Channel 46; BIRMINGHAM, AL; Owner: TRINITY BROADCASTING NETWORK)
- W62BG (Channel 62; BIRMINGHAM, AL; Owner: WTTO LICENSEE, LLC)
- W49AY (Channel 49; BIRMINGHAM, AL; Owner: GLEN IRIS BAPTIST SCHOOL)
- W55BJ (Channel 55; JASPER, AL; Owner: COMBS BROADCASTING, INC.)
- W66CN (Channel 66; JASPER, AL; Owner: TRINITY BROADCASTING NETWORK)
- W23AK (Channel 23; JASPER, AL; Owner: WMTY, INC.)
- W15AZ (Channel 15; ALABASTER, AL; Owner: GLEN IRIS BAPTIST CHURCH SCHOOL)
- National Bridge Inventory (NBI) Statistics
- 1Number of bridges
- 3ft / 1.3mTotal length
- $1,208,000Total costs
- 1,600Total average daily traffic
- 160Total average daily truck traffic
- 2,600Total future (year 2041) average daily traffic
FCC Registered Antenna Towers:
56 (See the full list of FCC Registered Antenna Towers in Pleasant Grove)FCC Registered Broadcast Land Mobile Towers:
5- 501 Park Rd (Lat: 33.495944 Lon: -86.959722), Call Sign: WNHT878,
Assigned Frequencies: 458.300 MHz, Grant Date: 12/23/2021, Expiration Date: 12/24/2031, Certifier: Michael Lee, Registrant: Jefferson County 9-1-1, Birmingham, AL 35220, Phone: (205) 783-1911, Fax: (205) 783-1712, Email:
- Pioneer Forestry Fire Tower (Lat: 33.152889 Lon: -87.950028), Call Sign: KBI740,
Assigned Frequencies: 151.175 MHz, 151.175 MHz, 159.315 MHz, 159.315 MHz, 159.465 MHz, 159.465 MHz, Grant Date: 03/17/2015, Expiration Date: 05/31/2025, Certifier: Brent Cord, Registrant: Alabama Forestry Commission, 2201 Cong. Dickinson Dr., Montgomery, AL 36109, Phone: (334) 425-5078, Fax: (334) 242-5079, Email:
- 501 Park Rd (Lat: 33.494556 Lon: -86.970833), Call Sign: KNBH403, Licensee ID: L00009189,
Assigned Frequencies: 460.425 MHz, Grant Date: 07/26/2001, Expiration Date: 09/03/2011, Cancellation Date: 11/05/2011, Registrant: City Of Pleasant Grove, 501 Park Rd, Pleasant Grove, AL 35127, Phone: (205) 744-7221
- City Hall (Lat: 33.494556 Lon: -86.970833), Call Sign: KGR478, Licensee ID: L00009189,
Assigned Frequencies: 451.150 MHz, Grant Date: 03/15/2002, Expiration Date: 03/19/2012, Cancellation Date: 05/19/2012, Registrant: City Of Pleasant Grove, 501 Park Rd, Pleasant Grove, AL 35127, Phone: (205) 744-7221
- 604 Park Rd (Lat: 33.492333 Lon: -86.972500), Call Sign: KAA778, Licensee ID: L00013534,
Assigned Frequencies: 150.860 MHz, Grant Date: 03/09/2001, Expiration Date: 03/05/2011, Cancellation Date: 02/04/2011, Registrant: Park Road Wrecker Service, 604 Park Rd, Pleasant Grove, AL 35127, Phone: (205) 744-6550
FCC Registered Microwave Towers:
4- PLEASANT GROVE, 900 Ft E Of Pleasant Grove Rd 9 Mi N Of Park Rd (Lat: 33.493444 Lon: -86.953583), Type: Ltower, Structure height: 86.8 m, Overall height: 91.4 m, Call Sign: WQFK570,
Assigned Frequencies: 11365.0 MHz, 11445.0 MHz, Grant Date: 06/28/2016, Expiration Date: 08/04/2026, Certifier: Richard A Craig, Registrant: Verizon Wireless, 5055 North Point Pkwy, Np2ne Network Engineering, Alpharetta, GA 30022, Phone: (770) 797-1070, Email:
- PLEASANT GROVE AL, 404 North Pleasant Grove Road (023621 / Pleasant Grove) (Lat: 33.520944 Lon: -86.968250), Type: Tower, Structure height: 60.9 m, Overall height: 62.7 m, Call Sign: WQII329,
Assigned Frequencies: 10755.0 MHz, Grant Date: 02/19/2008, Expiration Date: 02/19/2018, Cancellation Date: 08/19/2009, Certifier: William Chastain, Registrant: Radio Dynamics Corporation, 774 Mays Blvd., #10-465, Silver Spring, MD 20914, Phone: (301) 493-5171, Fax: (301) 576-4553, Email:
- 9BH1071A, 404 North Pleasant Grove Road (023621 / Pleasant Grove) (Lat: 33.520944 Lon: -86.968250), Type: Ltower, Structure height: 60.9 m, Overall height: 62.7 m, Call Sign: WQVC305,
Assigned Frequencies: 11265.0 MHz, 11265.0 MHz, 11265.0 MHz, 11265.0 MHz, 11265.0 MHz, 11265.0 MHz, 11265.0 MHz, 11265.0 MHz, 11265.0 MHz, 11265.0 MHz... (+7 more), Grant Date: 12/24/2014, Expiration Date: 12/24/2024, Cancellation Date: 03/20/2023, Certifier: David Werblow, Registrant: T-Mobile Usa, Inc., 12920 Se 38th Street, Bellevue, WA 98006, Phone: (425) 383-8401, Fax: (425) 383-4040, Email:
- EDGEWATER, 404 North Pleasant Grove Road (023621 / Pleasant Grove) (Lat: 33.520944 Lon: -86.968250), Type: Mtower, Structure height: 60.9 m, Overall height: 62.7 m, Call Sign: WQWN842,
Assigned Frequencies: 11055.0 MHz, 11135.0 MHz, 11055.0 MHz, 11135.0 MHz, 11055.0 MHz, 11135.0 MHz, 11055.0 MHz, 11135.0 MHz, 11055.0 MHz, 11135.0 MHz... (+6 more), Grant Date: 10/14/2015, Expiration Date: 10/14/2025, Certifier: Larry F Butts, Registrant: Southern Company Services, 600 N. 18th St / Bin 5n-5409, Birmingham, AL 35203, Phone: (205) 257-7600, Fax: (205) 257-2134, Email:
FCC Registered Amateur Radio Licenses:
62 (See the full list of FCC Registered Amateur Radio Licenses in Pleasant Grove)FAA Registered Aircraft:
5- Aircraft: BELLANCA 17-30A (Category: Land, Seats: 4, Weight: Up to 12,499 Pounds, Speed: 142 mph), Engine: CONT MOTOR IO 520 SERIES (285 HP) (Reciprocating)
N-Number: 93638, N93638, N-93638, Serial Number: 73-30577, Year manufactured: 1973, Airworthiness Date: 05/18/1973, Certificate Issue Date: 12/04/2018
Registrant (LLC): Hatch Transportation LLC, 4132a Smithfield Forest Dr, Pleasant Grove, AL 35127 - Aircraft: BELLANCA 17-30A (Category: Land, Seats: 4, Weight: Up to 12,499 Pounds, Speed: 142 mph), Engine: CONT MOTOR IO 520 SERIES (285 HP) (Reciprocating)
N-Number: 351AE, N351AE, N-351AE, Serial Number: 73-30577, Year manufactured: 1973, Airworthiness Date: 05/18/1973, Certificate Issue Date: 12/04/2018
Registrant (LLC): Hatch Transportation LLC, 4132a Smithfield Forest Dr, Pleasant Grove, AL 35127
Deregistered: Cancel Date: 08/29/1994, Exported to: New Zealand - Aircraft: BELLANCA 17-30A (Category: Land, Seats: 4, Weight: Up to 12,499 Pounds, Speed: 142 mph), Engine: CONT MOTOR IO 520 SERIES (285 HP) (Reciprocating)
N-Number: 222EG, N222EG, N-222EG, Serial Number: 78-30877, Year manufactured: 1978, Airworthiness Date: 04/13/1978
Registrant (Individual): Reported Sale, 4132 Smithfield Forest Dr, Pleasant Grove, AL 35127
Deregistered: Cancel Date: 02/15/2018 - Aircraft: PIPER PA-28-151 (Category: Land, Seats: 4, Weight: Up to 12,499 Pounds, Speed: 80 mph), Engine: LYCOMING 0-320 SERIES (180 HP) (Reciprocating)
N-Number: 44472, N44472, N-44472, Serial Number: 28-7415643, Year manufactured: 1974, Airworthiness Date: 08/01/1974, Certificate Issue Date: 05/07/2007
Registrant (Corporation): Southern Properties Unlimited LLC, 911 4th Ter, Pleasant Grove, AL 35127
Deregistered: Cancel Date: 04/07/2017 - Aircraft: CHAMPION 7FC (Category: Land, Seats: 2, Weight: Up to 12,499 Pounds, Speed: 90 mph), Engine: CONT MOTOR C90 SERIES (95 HP) (Reciprocating)
N-Number: 8929R, N8929R, N-8929R, Serial Number: 7FC-383, Year manufactured: 1960, Airworthiness Date: 01/21/1960, Certificate Issue Date: 08/22/1981
Registrant (Individual): Gary H Bonham, 812 14th Ln, Pleasant Grove, AL 35127
Deregistered: Cancel Date: 06/19/2017
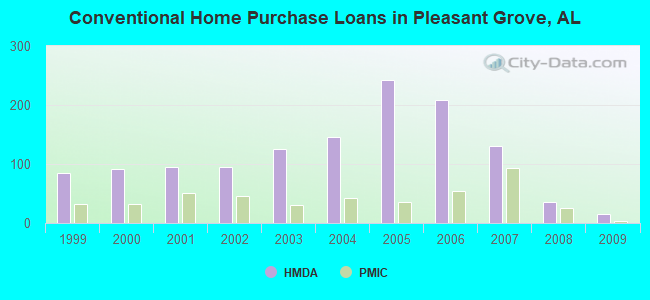
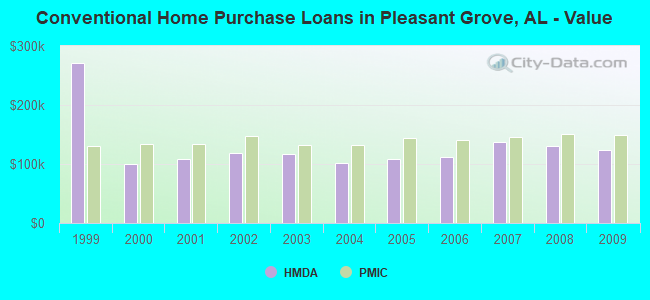
| Home Mortgage Disclosure Act Aggregated Statistics For Year 2009 (Based on 1 partial tract) | ||||||||||
| A) FHA, FSA/RHS & VA Home Purchase Loans | B) Conventional Home Purchase Loans | C) Refinancings | D) Home Improvement Loans | F) Non-occupant Loans on < 5 Family Dwellings (A B C & D) | ||||||
|---|---|---|---|---|---|---|---|---|---|---|
| Number | Average Value | Number | Average Value | Number | Average Value | Number | Average Value | Number | Average Value | |
| LOANS ORIGINATED | 57 | $127,352 | 16 | $124,004 | 151 | $129,882 | 7 | $22,520 | 10 | $82,460 |
| APPLICATIONS APPROVED, NOT ACCEPTED | 6 | $93,592 | 1 | $138,990 | 13 | $145,158 | 3 | $55,347 | 0 | $0 |
| APPLICATIONS DENIED | 28 | $152,346 | 5 | $83,578 | 107 | $148,237 | 8 | $35,214 | 2 | $48,040 |
| APPLICATIONS WITHDRAWN | 10 | $109,417 | 2 | $28,915 | 82 | $146,745 | 1 | $9,330 | 3 | $106,650 |
| FILES CLOSED FOR INCOMPLETENESS | 2 | $92,815 | 1 | $93,280 | 19 | $132,752 | 2 | $149,715 | 0 | $0 |
Detailed HMDA statistics for the following Tracts: 0123.03
| Private Mortgage Insurance Companies Aggregated Statistics For Year 2009 (Based on 1 partial tract) | ||||||
| A) Conventional Home Purchase Loans | B) Refinancings | C) Non-occupant Loans on < 5 Family Dwellings (A & B) | ||||
|---|---|---|---|---|---|---|
| Number | Average Value | Number | Average Value | Number | Average Value | |
| LOANS ORIGINATED | 3 | $149,560 | 4 | $102,608 | 1 | $121,260 |
| APPLICATIONS APPROVED, NOT ACCEPTED | 2 | $180,965 | 5 | $185,628 | 0 | $0 |
| APPLICATIONS DENIED | 1 | $80,220 | 3 | $228,537 | 1 | $80,220 |
| APPLICATIONS WITHDRAWN | 1 | $93,280 | 2 | $124,995 | 0 | $0 |
| FILES CLOSED FOR INCOMPLETENESS | 1 | $113,800 | 1 | $104,470 | 1 | $113,800 |
Detailed PMIC statistics for the following Tracts: 0123.03
2004 - 2018 National Fire Incident Reporting System (NFIRS) incidents
- Fire incident types reported to NFIRS in Pleasant Grove, AL
- 22439.8%Outside Fires
- 20937.1%Structure Fires
- 7313.0%Other
- 5710.1%Mobile Property/Vehicle Fires
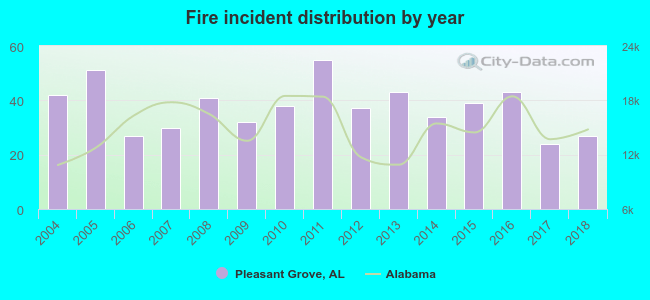 Based on the data from the years 2004 - 2018 the average number of fires per year is 38. The highest number of fire incidents - 55 took place in 2011, and the least - 24 in 2017. The data has a decreasing trend.
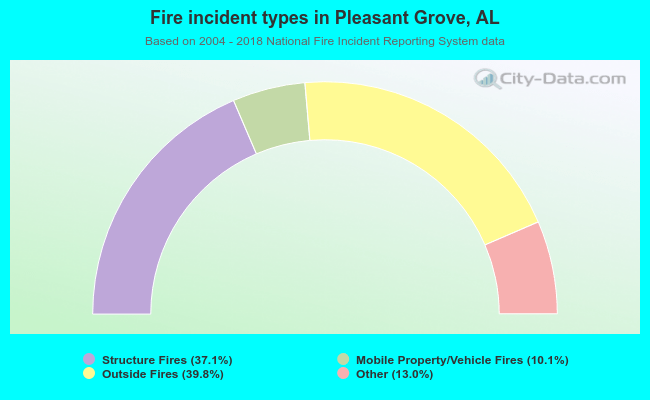 When looking into fire subcategories, the most incidents belonged to: Outside Fires (39.8%), and Structure Fires (37.1%).
| Most common first names in Pleasant Grove, AL among deceased individuals | ||
| Name | Count | Lived (average) |
|---|---|---|
| James | 91 | 73.0 years |
| Mary | 84 | 80.6 years |
| William | 72 | 72.6 years |
| John | 61 | 74.1 years |
| Robert | 50 | 70.2 years |
| Thomas | 31 | 75.3 years |
| Charles | 28 | 73.9 years |
| Annie | 28 | 83.8 years |
| Margaret | 26 | 77.2 years |
| Betty | 25 | 72.0 years |
| Most common last names in Pleasant Grove, AL among deceased individuals | ||
| Last name | Count | Lived (average) |
|---|---|---|
| Smith | 31 | 74.2 years |
| Brown | 23 | 73.2 years |
| Jones | 23 | 73.3 years |
| Williams | 22 | 74.8 years |
| Johnson | 20 | 75.2 years |
| Davis | 19 | 80.3 years |
| Hill | 17 | 74.5 years |
| Harris | 17 | 80.8 years |
| Moore | 16 | 79.7 years |
| Martin | 15 | 77.9 years |
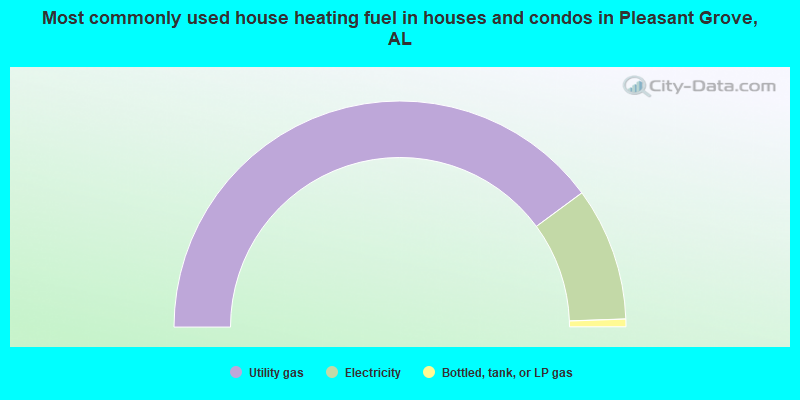
- 79.8%Utility gas
- 19.1%Electricity
- 1.1%Bottled, tank, or LP gas
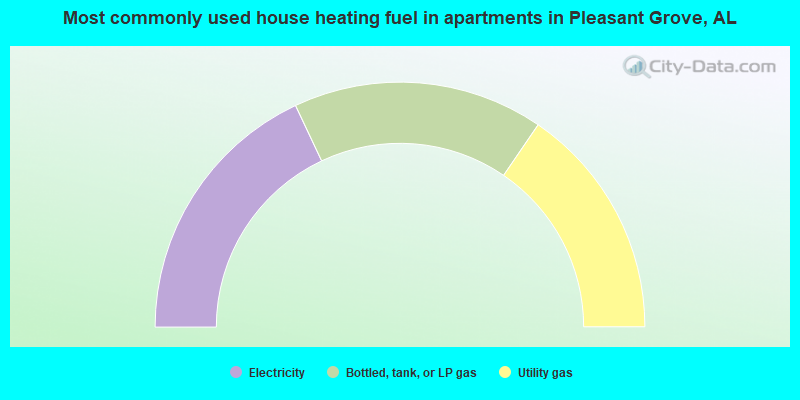
- 36.0%Electricity
- 33.1%Bottled, tank, or LP gas
- 30.9%Utility gas
Pleasant Grove compared to Alabama state average:
- Unemployed percentage significantly below state average.
- Black race population percentage above state average.
- Hispanic race population percentage significantly below state average.
- Foreign-born population percentage significantly below state average.
- Renting percentage significantly below state average.
- Length of stay since moving in significantly above state average.
Pleasant Grove on our top lists:
- #31 on the list of "Top 101 cities with the lowest number of robberies per 100,000 residents (population 5,000+)"
- #101 on the list of "Top 101 cities with largest percentage of males in industries: utilities (population 5,000+)"
- #57 (35127) on the list of "Top 101 zip codes with the lowest 2012 average reported profit/loss from business (pop 5,000+)"
- #76 (35127) on the list of "Top 101 zip codes with the largest percentage of Scottish first ancestries (pop 5,000+)"
- #92 (35127) on the list of "Top 101 zip codes with the largest charity contributions deductions as a percentage of AGI in 2012 (pop 5,000+)"
- #5 on the list of "Top 101 counties with the highest number of infant deaths per 1000 residents 2007-2013 (pop. 50,000+)"
- #5 on the list of "Top 101 counties with the most Black Protestant adherents"
- #5 on the list of "Top 101 counties with the most Black Protestant congregations"
- #9 on the list of "Top 101 counties with the highest average weight of females"
- #9 on the list of "Top 101 counties with the most Evangelical Protestant adherents"

|
Total of 8 patent applications in 2008-2024.