Norton, Ohio Submit your own pictures of this city and show them to the world
OSM Map
General Map
Google Map
MSN Map
OSM Map
General Map
Google Map
MSN Map
OSM Map
General Map
Google Map
MSN Map
OSM Map
General Map
Google Map
MSN Map
Please wait while loading the map...
Population in 2022: 11,516 (96% urban, 4% rural). Population change since 2000: -0.1%Males: 5,859 Females: 5,657
March 2022 cost of living index in Norton: 96.2 (near average, U.S. average is 100) Percentage of residents living in poverty in 2022: 6.9%for White Non-Hispanic residents , 3.8% for Black residents , 17.5% for Hispanic or Latino residents , 27.1% for other race residents , 2.4% for two or more races residents )
Profiles of local businesses
Business Search - 14 Million verified businesses
Data:
Median household income ($)
Median household income (% change since 2000)
Household income diversity
Ratio of average income to average house value (%)
Ratio of average income to average rent
Median household income ($) - White
Median household income ($) - Black or African American
Median household income ($) - Asian
Median household income ($) - Hispanic or Latino
Median household income ($) - American Indian and Alaska Native
Median household income ($) - Multirace
Median household income ($) - Other Race
Median household income for houses/condos with a mortgage ($)
Median household income for apartments without a mortgage ($)
Races - White alone (%)
Races - White alone (% change since 2000)
Races - Black alone (%)
Races - Black alone (% change since 2000)
Races - American Indian alone (%)
Races - American Indian alone (% change since 2000)
Races - Asian alone (%)
Races - Asian alone (% change since 2000)
Races - Hispanic (%)
Races - Hispanic (% change since 2000)
Races - Native Hawaiian and Other Pacific Islander alone (%)
Races - Native Hawaiian and Other Pacific Islander alone (% change since 2000)
Races - Two or more races (%)
Races - Two or more races (% change since 2000)
Races - Other race alone (%)
Races - Other race alone (% change since 2000)
Racial diversity
Unemployment (%)
Unemployment (% change since 2000)
Unemployment (%) - White
Unemployment (%) - Black or African American
Unemployment (%) - Asian
Unemployment (%) - Hispanic or Latino
Unemployment (%) - American Indian and Alaska Native
Unemployment (%) - Multirace
Unemployment (%) - Other Race
Population density (people per square mile)
Population - Males (%)
Population - Females (%)
Population - Males (%) - White
Population - Males (%) - Black or African American
Population - Males (%) - Asian
Population - Males (%) - Hispanic or Latino
Population - Males (%) - American Indian and Alaska Native
Population - Males (%) - Multirace
Population - Males (%) - Other Race
Population - Females (%) - White
Population - Females (%) - Black or African American
Population - Females (%) - Asian
Population - Females (%) - Hispanic or Latino
Population - Females (%) - American Indian and Alaska Native
Population - Females (%) - Multirace
Population - Females (%) - Other Race
Coronavirus confirmed cases (Jun 05, 2024)
Deaths caused by coronavirus (Jun 05, 2024)
Coronavirus confirmed cases (per 100k population) (Jun 05, 2024)
Deaths caused by coronavirus (per 100k population) (Jun 05, 2024)
Daily increase in number of cases (Jun 05, 2024)
Weekly increase in number of cases (Jun 05, 2024)
Cases doubled (in days) (Jun 05, 2024)
Hospitalized patients (Apr 18, 2022)
Negative test results (Apr 18, 2022)
Total test results (Apr 18, 2022)
COVID Vaccine doses distributed (per 100k population) (Sep 19, 2023)
COVID Vaccine doses administered (per 100k population) (Sep 19, 2023)
COVID Vaccine doses distributed (Sep 19, 2023)
COVID Vaccine doses administered (Sep 19, 2023)
Likely homosexual households (%)
Likely homosexual households (% change since 2000)
Likely homosexual households - Lesbian couples (%)
Likely homosexual households - Lesbian couples (% change since 2000)
Likely homosexual households - Gay men (%)
Likely homosexual households - Gay men (% change since 2000)
Cost of living index
Median gross rent ($)
Median contract rent ($)
Median monthly housing costs ($)
Median house or condo value ($)
Median house or condo value ($ change since 2000)
Mean house or condo value by units in structure - 1, detached ($)
Mean house or condo value by units in structure - 1, attached ($)
Mean house or condo value by units in structure - 2 ($)
Mean house or condo value by units in structure by units in structure - 3 or 4 ($)
Mean house or condo value by units in structure - 5 or more ($)
Mean house or condo value by units in structure - Boat, RV, van, etc. ($)
Mean house or condo value by units in structure - Mobile home ($)
Median house or condo value ($) - White
Median house or condo value ($) - Black or African American
Median house or condo value ($) - Asian
Median house or condo value ($) - Hispanic or Latino
Median house or condo value ($) - American Indian and Alaska Native
Median house or condo value ($) - Multirace
Median house or condo value ($) - Other Race
Median resident age
Resident age diversity
Median resident age - Males
Median resident age - Females
Median resident age - White
Median resident age - Black or African American
Median resident age - Asian
Median resident age - Hispanic or Latino
Median resident age - American Indian and Alaska Native
Median resident age - Multirace
Median resident age - Other Race
Median resident age - Males - White
Median resident age - Males - Black or African American
Median resident age - Males - Asian
Median resident age - Males - Hispanic or Latino
Median resident age - Males - American Indian and Alaska Native
Median resident age - Males - Multirace
Median resident age - Males - Other Race
Median resident age - Females - White
Median resident age - Females - Black or African American
Median resident age - Females - Asian
Median resident age - Females - Hispanic or Latino
Median resident age - Females - American Indian and Alaska Native
Median resident age - Females - Multirace
Median resident age - Females - Other Race
Commute - mean travel time to work (minutes)
Travel time to work - Less than 5 minutes (%)
Travel time to work - Less than 5 minutes (% change since 2000)
Travel time to work - 5 to 9 minutes (%)
Travel time to work - 5 to 9 minutes (% change since 2000)
Travel time to work - 10 to 19 minutes (%)
Travel time to work - 10 to 19 minutes (% change since 2000)
Travel time to work - 20 to 29 minutes (%)
Travel time to work - 20 to 29 minutes (% change since 2000)
Travel time to work - 30 to 39 minutes (%)
Travel time to work - 30 to 39 minutes (% change since 2000)
Travel time to work - 40 to 59 minutes (%)
Travel time to work - 40 to 59 minutes (% change since 2000)
Travel time to work - 60 to 89 minutes (%)
Travel time to work - 60 to 89 minutes (% change since 2000)
Travel time to work - 90 or more minutes (%)
Travel time to work - 90 or more minutes (% change since 2000)
Marital status - Never married (%)
Marital status - Now married (%)
Marital status - Separated (%)
Marital status - Widowed (%)
Marital status - Divorced (%)
Median family income ($)
Median family income (% change since 2000)
Median non-family income ($)
Median non-family income (% change since 2000)
Median per capita income ($)
Median per capita income (% change since 2000)
Median family income ($) - White
Median family income ($) - Black or African American
Median family income ($) - Asian
Median family income ($) - Hispanic or Latino
Median family income ($) - American Indian and Alaska Native
Median family income ($) - Multirace
Median family income ($) - Other Race
Median year house/condo built
Median year apartment built
Year house built - Built 2005 or later (%)
Year house built - Built 2000 to 2004 (%)
Year house built - Built 1990 to 1999 (%)
Year house built - Built 1980 to 1989 (%)
Year house built - Built 1970 to 1979 (%)
Year house built - Built 1960 to 1969 (%)
Year house built - Built 1950 to 1959 (%)
Year house built - Built 1940 to 1949 (%)
Year house built - Built 1939 or earlier (%)
Average household size
Household density (households per square mile)
Average household size - White
Average household size - Black or African American
Average household size - Asian
Average household size - Hispanic or Latino
Average household size - American Indian and Alaska Native
Average household size - Multirace
Average household size - Other Race
Occupied housing units (%)
Vacant housing units (%)
Owner occupied housing units (%)
Renter occupied housing units (%)
Vacancy status - For rent (%)
Vacancy status - For sale only (%)
Vacancy status - Rented or sold, not occupied (%)
Vacancy status - For seasonal, recreational, or occasional use (%)
Vacancy status - For migrant workers (%)
Vacancy status - Other vacant (%)
Residents with income below the poverty level (%)
Residents with income below 50% of the poverty level (%)
Children below poverty level (%)
Poor families by family type - Married-couple family (%)
Poor families by family type - Male, no wife present (%)
Poor families by family type - Female, no husband present (%)
Poverty status for native-born residents (%)
Poverty status for foreign-born residents (%)
Poverty among high school graduates not in families (%)
Poverty among people who did not graduate high school not in families (%)
Residents with income below the poverty level (%) - White
Residents with income below the poverty level (%) - Black or African American
Residents with income below the poverty level (%) - Asian
Residents with income below the poverty level (%) - Hispanic or Latino
Residents with income below the poverty level (%) - American Indian and Alaska Native
Residents with income below the poverty level (%) - Multirace
Residents with income below the poverty level (%) - Other Race
Air pollution - Air Quality Index (AQI)
Air pollution - CO
Air pollution - NO2
Air pollution - SO2
Air pollution - Ozone
Air pollution - PM10
Air pollution - PM25
Air pollution - Pb
Crime - Murders per 100,000 population
Crime - Rapes per 100,000 population
Crime - Robberies per 100,000 population
Crime - Assaults per 100,000 population
Crime - Burglaries per 100,000 population
Crime - Thefts per 100,000 population
Crime - Auto thefts per 100,000 population
Crime - Arson per 100,000 population
Crime - City-data.com crime index
Crime - Violent crime index
Crime - Property crime index
Crime - Murders per 100,000 population (5 year average)
Crime - Rapes per 100,000 population (5 year average)
Crime - Robberies per 100,000 population (5 year average)
Crime - Assaults per 100,000 population (5 year average)
Crime - Burglaries per 100,000 population (5 year average)
Crime - Thefts per 100,000 population (5 year average)
Crime - Auto thefts per 100,000 population (5 year average)
Crime - Arson per 100,000 population (5 year average)
Crime - City-data.com crime index (5 year average)
Crime - Violent crime index (5 year average)
Crime - Property crime index (5 year average)
1996 Presidential Elections Results (%) - Democratic Party (Clinton)
1996 Presidential Elections Results (%) - Republican Party (Dole)
1996 Presidential Elections Results (%) - Other
2000 Presidential Elections Results (%) - Democratic Party (Gore)
2000 Presidential Elections Results (%) - Republican Party (Bush)
2000 Presidential Elections Results (%) - Other
2004 Presidential Elections Results (%) - Democratic Party (Kerry)
2004 Presidential Elections Results (%) - Republican Party (Bush)
2004 Presidential Elections Results (%) - Other
2008 Presidential Elections Results (%) - Democratic Party (Obama)
2008 Presidential Elections Results (%) - Republican Party (McCain)
2008 Presidential Elections Results (%) - Other
2012 Presidential Elections Results (%) - Democratic Party (Obama)
2012 Presidential Elections Results (%) - Republican Party (Romney)
2012 Presidential Elections Results (%) - Other
2016 Presidential Elections Results (%) - Democratic Party (Clinton)
2016 Presidential Elections Results (%) - Republican Party (Trump)
2016 Presidential Elections Results (%) - Other
2020 Presidential Elections Results (%) - Democratic Party (Biden)
2020 Presidential Elections Results (%) - Republican Party (Trump)
2020 Presidential Elections Results (%) - Other
Ancestries Reported - Arab (%)
Ancestries Reported - Czech (%)
Ancestries Reported - Danish (%)
Ancestries Reported - Dutch (%)
Ancestries Reported - English (%)
Ancestries Reported - French (%)
Ancestries Reported - French Canadian (%)
Ancestries Reported - German (%)
Ancestries Reported - Greek (%)
Ancestries Reported - Hungarian (%)
Ancestries Reported - Irish (%)
Ancestries Reported - Italian (%)
Ancestries Reported - Lithuanian (%)
Ancestries Reported - Norwegian (%)
Ancestries Reported - Polish (%)
Ancestries Reported - Portuguese (%)
Ancestries Reported - Russian (%)
Ancestries Reported - Scotch-Irish (%)
Ancestries Reported - Scottish (%)
Ancestries Reported - Slovak (%)
Ancestries Reported - Subsaharan African (%)
Ancestries Reported - Swedish (%)
Ancestries Reported - Swiss (%)
Ancestries Reported - Ukrainian (%)
Ancestries Reported - United States (%)
Ancestries Reported - Welsh (%)
Ancestries Reported - West Indian (%)
Ancestries Reported - Other (%)
Educational Attainment - No schooling completed (%)
Educational Attainment - Less than high school (%)
Educational Attainment - High school or equivalent (%)
Educational Attainment - Less than 1 year of college (%)
Educational Attainment - 1 or more years of college (%)
Educational Attainment - Associate degree (%)
Educational Attainment - Bachelor's degree (%)
Educational Attainment - Master's degree (%)
Educational Attainment - Professional school degree (%)
Educational Attainment - Doctorate degree (%)
School Enrollment - Nursery, preschool (%)
School Enrollment - Kindergarten (%)
School Enrollment - Grade 1 to 4 (%)
School Enrollment - Grade 5 to 8 (%)
School Enrollment - Grade 9 to 12 (%)
School Enrollment - College undergrad (%)
School Enrollment - Graduate or professional (%)
School Enrollment - Not enrolled in school (%)
School enrollment - Public schools (%)
School enrollment - Private schools (%)
School enrollment - Not enrolled (%)
Median number of rooms in houses and condos
Median number of rooms in apartments
Housing units lacking complete plumbing facilities (%)
Housing units lacking complete kitchen facilities (%)
Density of houses
Urban houses (%)
Rural houses (%)
Households with people 60 years and over (%)
Households with people 65 years and over (%)
Households with people 75 years and over (%)
Households with one or more nonrelatives (%)
Households with no nonrelatives (%)
Population in households (%)
Family households (%)
Nonfamily households (%)
Population in families (%)
Family households with own children (%)
Median number of bedrooms in owner occupied houses
Mean number of bedrooms in owner occupied houses
Median number of bedrooms in renter occupied houses
Mean number of bedrooms in renter occupied houses
Median number of vehichles in owner occupied houses
Mean number of vehichles in owner occupied houses
Median number of vehichles in renter occupied houses
Mean number of vehichles in renter occupied houses
Mortgage status - with mortgage (%)
Mortgage status - with second mortgage (%)
Mortgage status - with home equity loan (%)
Mortgage status - with both second mortgage and home equity loan (%)
Mortgage status - without a mortgage (%)
Average family size
Average family size - White
Average family size - Black or African American
Average family size - Asian
Average family size - Hispanic or Latino
Average family size - American Indian and Alaska Native
Average family size - Multirace
Average family size - Other Race
Geographical mobility - Same house 1 year ago (%)
Geographical mobility - Moved within same county (%)
Geographical mobility - Moved from different county within same state (%)
Geographical mobility - Moved from different state (%)
Geographical mobility - Moved from abroad (%)
Place of birth - Born in state of residence (%)
Place of birth - Born in other state (%)
Place of birth - Native, outside of US (%)
Place of birth - Foreign born (%)
Housing units in structures - 1, detached (%)
Housing units in structures - 1, attached (%)
Housing units in structures - 2 (%)
Housing units in structures - 3 or 4 (%)
Housing units in structures - 5 to 9 (%)
Housing units in structures - 10 to 19 (%)
Housing units in structures - 20 to 49 (%)
Housing units in structures - 50 or more (%)
Housing units in structures - Mobile home (%)
Housing units in structures - Boat, RV, van, etc. (%)
House/condo owner moved in on average (years ago)
Renter moved in on average (years ago)
Year householder moved into unit - Moved in 1999 to March 2000 (%)
Year householder moved into unit - Moved in 1995 to 1998 (%)
Year householder moved into unit - Moved in 1990 to 1994 (%)
Year householder moved into unit - Moved in 1980 to 1989 (%)
Year householder moved into unit - Moved in 1970 to 1979 (%)
Year householder moved into unit - Moved in 1969 or earlier (%)
Means of transportation to work - Drove car alone (%)
Means of transportation to work - Carpooled (%)
Means of transportation to work - Public transportation (%)
Means of transportation to work - Bus or trolley bus (%)
Means of transportation to work - Streetcar or trolley car (%)
Means of transportation to work - Subway or elevated (%)
Means of transportation to work - Railroad (%)
Means of transportation to work - Ferryboat (%)
Means of transportation to work - Taxicab (%)
Means of transportation to work - Motorcycle (%)
Means of transportation to work - Bicycle (%)
Means of transportation to work - Walked (%)
Means of transportation to work - Other means (%)
Working at home (%)
Industry diversity
Most Common Industries - Agriculture, forestry, fishing and hunting, and mining (%)
Most Common Industries - Agriculture, forestry, fishing and hunting (%)
Most Common Industries - Mining, quarrying, and oil and gas extraction (%)
Most Common Industries - Construction (%)
Most Common Industries - Manufacturing (%)
Most Common Industries - Wholesale trade (%)
Most Common Industries - Retail trade (%)
Most Common Industries - Transportation and warehousing, and utilities (%)
Most Common Industries - Transportation and warehousing (%)
Most Common Industries - Utilities (%)
Most Common Industries - Information (%)
Most Common Industries - Finance and insurance, and real estate and rental and leasing (%)
Most Common Industries - Finance and insurance (%)
Most Common Industries - Real estate and rental and leasing (%)
Most Common Industries - Professional, scientific, and management, and administrative and waste management services (%)
Most Common Industries - Professional, scientific, and technical services (%)
Most Common Industries - Management of companies and enterprises (%)
Most Common Industries - Administrative and support and waste management services (%)
Most Common Industries - Educational services, and health care and social assistance (%)
Most Common Industries - Educational services (%)
Most Common Industries - Health care and social assistance (%)
Most Common Industries - Arts, entertainment, and recreation, and accommodation and food services (%)
Most Common Industries - Arts, entertainment, and recreation (%)
Most Common Industries - Accommodation and food services (%)
Most Common Industries - Other services, except public administration (%)
Most Common Industries - Public administration (%)
Occupation diversity
Most Common Occupations - Management, business, science, and arts occupations (%)
Most Common Occupations - Management, business, and financial occupations (%)
Most Common Occupations - Management occupations (%)
Most Common Occupations - Business and financial operations occupations (%)
Most Common Occupations - Computer, engineering, and science occupations (%)
Most Common Occupations - Computer and mathematical occupations (%)
Most Common Occupations - Architecture and engineering occupations (%)
Most Common Occupations - Life, physical, and social science occupations (%)
Most Common Occupations - Education, legal, community service, arts, and media occupations (%)
Most Common Occupations - Community and social service occupations (%)
Most Common Occupations - Legal occupations (%)
Most Common Occupations - Education, training, and library occupations (%)
Most Common Occupations - Arts, design, entertainment, sports, and media occupations (%)
Most Common Occupations - Healthcare practitioners and technical occupations (%)
Most Common Occupations - Health diagnosing and treating practitioners and other technical occupations (%)
Most Common Occupations - Health technologists and technicians (%)
Most Common Occupations - Service occupations (%)
Most Common Occupations - Healthcare support occupations (%)
Most Common Occupations - Protective service occupations (%)
Most Common Occupations - Fire fighting and prevention, and other protective service workers including supervisors (%)
Most Common Occupations - Law enforcement workers including supervisors (%)
Most Common Occupations - Food preparation and serving related occupations (%)
Most Common Occupations - Building and grounds cleaning and maintenance occupations (%)
Most Common Occupations - Personal care and service occupations (%)
Most Common Occupations - Sales and office occupations (%)
Most Common Occupations - Sales and related occupations (%)
Most Common Occupations - Office and administrative support occupations (%)
Most Common Occupations - Natural resources, construction, and maintenance occupations (%)
Most Common Occupations - Farming, fishing, and forestry occupations (%)
Most Common Occupations - Construction and extraction occupations (%)
Most Common Occupations - Installation, maintenance, and repair occupations (%)
Most Common Occupations - Production, transportation, and material moving occupations (%)
Most Common Occupations - Production occupations (%)
Most Common Occupations - Transportation occupations (%)
Most Common Occupations - Material moving occupations (%)
People in Group quarters - Institutionalized population (%)
People in Group quarters - Correctional institutions (%)
People in Group quarters - Federal prisons and detention centers (%)
People in Group quarters - Halfway houses (%)
People in Group quarters - Local jails and other confinement facilities (including police lockups) (%)
People in Group quarters - Military disciplinary barracks (%)
People in Group quarters - State prisons (%)
People in Group quarters - Other types of correctional institutions (%)
People in Group quarters - Nursing homes (%)
People in Group quarters - Hospitals/wards, hospices, and schools for the handicapped (%)
People in Group quarters - Hospitals/wards and hospices for chronically ill (%)
People in Group quarters - Hospices or homes for chronically ill (%)
People in Group quarters - Military hospitals or wards for chronically ill (%)
People in Group quarters - Other hospitals or wards for chronically ill (%)
People in Group quarters - Hospitals or wards for drug/alcohol abuse (%)
People in Group quarters - Mental (Psychiatric) hospitals or wards (%)
People in Group quarters - Schools, hospitals, or wards for the mentally retarded (%)
People in Group quarters - Schools, hospitals, or wards for the physically handicapped (%)
People in Group quarters - Institutions for the deaf (%)
People in Group quarters - Institutions for the blind (%)
People in Group quarters - Orthopedic wards and institutions for the physically handicapped (%)
People in Group quarters - Wards in general hospitals for patients who have no usual home elsewhere (%)
People in Group quarters - Wards in military hospitals for patients who have no usual home elsewhere (%)
People in Group quarters - Juvenile institutions (%)
People in Group quarters - Long-term care (%)
People in Group quarters - Homes for abused, dependent, and neglected children (%)
People in Group quarters - Residential treatment centers for emotionally disturbed children (%)
People in Group quarters - Training schools for juvenile delinquents (%)
People in Group quarters - Short-term care, detention or diagnostic centers for delinquent children (%)
People in Group quarters - Type of juvenile institution unknown (%)
People in Group quarters - Noninstitutionalized population (%)
People in Group quarters - College dormitories (includes college quarters off campus) (%)
People in Group quarters - Military quarters (%)
People in Group quarters - On base (%)
People in Group quarters - Barracks, unaccompanied personnel housing (UPH), (Enlisted/Officer), ;and similar group living quarters for military personnel (%)
People in Group quarters - Transient quarters for temporary residents (%)
People in Group quarters - Military ships (%)
People in Group quarters - Group homes (%)
People in Group quarters - Homes or halfway houses for drug/alcohol abuse (%)
People in Group quarters - Homes for the mentally ill (%)
People in Group quarters - Homes for the mentally retarded (%)
People in Group quarters - Homes for the physically handicapped (%)
People in Group quarters - Other group homes (%)
People in Group quarters - Religious group quarters (%)
People in Group quarters - Dormitories (%)
People in Group quarters - Agriculture workers' dormitories on farms (%)
People in Group quarters - Job Corps and vocational training facilities (%)
People in Group quarters - Other workers' dormitories (%)
People in Group quarters - Crews of maritime vessels (%)
People in Group quarters - Other nonhousehold living situations (%)
People in Group quarters - Other noninstitutional group quarters (%)
Residents speaking English at home (%)
Residents speaking English at home - Born in the United States (%)
Residents speaking English at home - Native, born elsewhere (%)
Residents speaking English at home - Foreign born (%)
Residents speaking Spanish at home (%)
Residents speaking Spanish at home - Born in the United States (%)
Residents speaking Spanish at home - Native, born elsewhere (%)
Residents speaking Spanish at home - Foreign born (%)
Residents speaking other language at home (%)
Residents speaking other language at home - Born in the United States (%)
Residents speaking other language at home - Native, born elsewhere (%)
Residents speaking other language at home - Foreign born (%)
Class of Workers - Employee of private company (%)
Class of Workers - Self-employed in own incorporated business (%)
Class of Workers - Private not-for-profit wage and salary workers (%)
Class of Workers - Local government workers (%)
Class of Workers - State government workers (%)
Class of Workers - Federal government workers (%)
Class of Workers - Self-employed workers in own not incorporated business and Unpaid family workers (%)
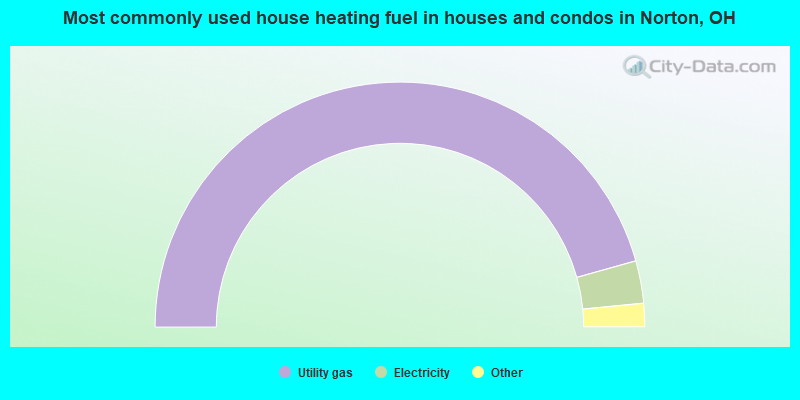
House heating fuel used in houses and condos - Utility gas (%)
House heating fuel used in houses and condos - Bottled, tank, or LP gas (%)
House heating fuel used in houses and condos - Electricity (%)
House heating fuel used in houses and condos - Fuel oil, kerosene, etc. (%)
House heating fuel used in houses and condos - Coal or coke (%)
House heating fuel used in houses and condos - Wood (%)
House heating fuel used in houses and condos - Solar energy (%)
House heating fuel used in houses and condos - Other fuel (%)
House heating fuel used in houses and condos - No fuel used (%)
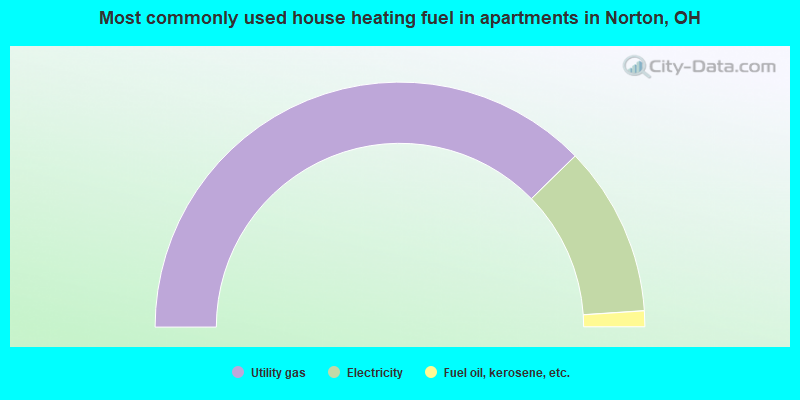
House heating fuel used in apartments - Utility gas (%)
House heating fuel used in apartments - Bottled, tank, or LP gas (%)
House heating fuel used in apartments - Electricity (%)
House heating fuel used in apartments - Fuel oil, kerosene, etc. (%)
House heating fuel used in apartments - Coal or coke (%)
House heating fuel used in apartments - Wood (%)
House heating fuel used in apartments - Solar energy (%)
House heating fuel used in apartments - Other fuel (%)
House heating fuel used in apartments - No fuel used (%)
Armed forces status - In Armed Forces (%)
Armed forces status - Civilian (%)
Armed forces status - Civilian - Veteran (%)
Armed forces status - Civilian - Nonveteran (%)
Fatal accidents locations in years 2005-2021
Fatal accidents locations in 2005
Fatal accidents locations in 2006
Fatal accidents locations in 2007
Fatal accidents locations in 2008
Fatal accidents locations in 2009
Fatal accidents locations in 2010
Fatal accidents locations in 2011
Fatal accidents locations in 2012
Fatal accidents locations in 2013
Fatal accidents locations in 2014
Fatal accidents locations in 2015
Fatal accidents locations in 2016
Fatal accidents locations in 2017
Fatal accidents locations in 2018
Fatal accidents locations in 2019
Fatal accidents locations in 2020
Fatal accidents locations in 2021
Alcohol use - People drinking some alcohol every month (%)
Alcohol use - People not drinking at all (%)
Alcohol use - Average days/month drinking alcohol
Alcohol use - Average drinks/week
Alcohol use - Average days/year people drink much
Audiometry - Average condition of hearing (%)
Audiometry - People that can hear a whisper from across a quiet room (%)
Audiometry - People that can hear normal voice from across a quiet room (%)
Audiometry - Ears ringing, roaring, buzzing (%)
Audiometry - Had a job exposure to loud noise (%)
Audiometry - Had off-work exposure to loud noise (%)
Blood Pressure & Cholesterol - Has high blood pressure (%)
Blood Pressure & Cholesterol - Checking blood pressure at home (%)
Blood Pressure & Cholesterol - Frequently checking blood cholesterol (%)
Blood Pressure & Cholesterol - Has high cholesterol level (%)
Consumer Behavior - Money monthly spent on food at supermarket/grocery store
Consumer Behavior - Money monthly spent on food at other stores
Consumer Behavior - Money monthly spent on eating out
Consumer Behavior - Money monthly spent on carryout/delivered foods
Consumer Behavior - Income spent on food at supermarket/grocery store (%)
Consumer Behavior - Income spent on food at other stores (%)
Consumer Behavior - Income spent on eating out (%)
Consumer Behavior - Income spent on carryout/delivered foods (%)
Current Health Status - General health condition (%)
Current Health Status - Blood donors (%)
Current Health Status - Has blood ever tested for HIV virus (%)
Current Health Status - Left-handed people (%)
Dermatology - People using sunscreen (%)
Diabetes - Diabetics (%)
Diabetes - Had a blood test for high blood sugar (%)
Diabetes - People taking insulin (%)
Diet Behavior & Nutrition - Diet health (%)
Diet Behavior & Nutrition - Milk product consumption (# of products/month)
Diet Behavior & Nutrition - Meals not home prepared (#/week)
Diet Behavior & Nutrition - Meals from fast food or pizza place (#/week)
Diet Behavior & Nutrition - Ready-to-eat foods (#/month)
Diet Behavior & Nutrition - Frozen meals/pizza (#/month)
Drug Use - People that ever used marijuana or hashish (%)
Drug Use - Ever used hard drugs (%)
Drug Use - Ever used any form of cocaine (%)
Drug Use - Ever used heroin (%)
Drug Use - Ever used methamphetamine (%)
Health Insurance - People covered by health insurance (%)
Kidney Conditions-Urology - Avg. # of times urinating at night
Medical Conditions - People with asthma (%)
Medical Conditions - People with anemia (%)
Medical Conditions - People with psoriasis (%)
Medical Conditions - People with overweight (%)
Medical Conditions - Elderly people having difficulties in thinking or remembering (%)
Medical Conditions - People who ever received blood transfusion (%)
Medical Conditions - People having trouble seeing even with glass/contacts (%)
Medical Conditions - People with arthritis (%)
Medical Conditions - People with gout (%)
Medical Conditions - People with congestive heart failure (%)
Medical Conditions - People with coronary heart disease (%)
Medical Conditions - People with angina pectoris (%)
Medical Conditions - People who ever had heart attack (%)
Medical Conditions - People who ever had stroke (%)
Medical Conditions - People with emphysema (%)
Medical Conditions - People with thyroid problem (%)
Medical Conditions - People with chronic bronchitis (%)
Medical Conditions - People with any liver condition (%)
Medical Conditions - People who ever had cancer or malignancy (%)
Mental Health - People who have little interest in doing things (%)
Mental Health - People feeling down, depressed, or hopeless (%)
Mental Health - People who have trouble sleeping or sleeping too much (%)
Mental Health - People feeling tired or having little energy (%)
Mental Health - People with poor appetite or overeating (%)
Mental Health - People feeling bad about themself (%)
Mental Health - People who have trouble concentrating on things (%)
Mental Health - People moving or speaking slowly or too fast (%)
Mental Health - People having thoughts they would be better off dead (%)
Oral Health - Average years since last visit a dentist
Oral Health - People embarrassed because of mouth (%)
Oral Health - People with gum disease (%)
Oral Health - General health of teeth and gums (%)
Oral Health - Average days a week using dental floss/device
Oral Health - Average days a week using mouthwash for dental problem
Oral Health - Average number of teeth
Pesticide Use - Households using pesticides to control insects (%)
Pesticide Use - Households using pesticides to kill weeds (%)
Physical Activity - People doing vigorous-intensity work activities (%)
Physical Activity - People doing moderate-intensity work activities (%)
Physical Activity - People walking or bicycling (%)
Physical Activity - People doing vigorous-intensity recreational activities (%)
Physical Activity - People doing moderate-intensity recreational activities (%)
Physical Activity - Average hours a day doing sedentary activities
Physical Activity - Average hours a day watching TV or videos
Physical Activity - Average hours a day using computer
Physical Functioning - People having limitations keeping them from working (%)
Physical Functioning - People limited in amount of work they can do (%)
Physical Functioning - People that need special equipment to walk (%)
Physical Functioning - People experiencing confusion/memory problems (%)
Physical Functioning - People requiring special healthcare equipment (%)
Prescription Medications - Average number of prescription medicines taking
Preventive Aspirin Use - Adults 40+ taking low-dose aspirin (%)
Reproductive Health - Vaginal deliveries (%)
Reproductive Health - Cesarean deliveries (%)
Reproductive Health - Deliveries resulted in a live birth (%)
Reproductive Health - Pregnancies resulted in a delivery (%)
Reproductive Health - Women breastfeeding newborns (%)
Reproductive Health - Women that had a hysterectomy (%)
Reproductive Health - Women that had both ovaries removed (%)
Reproductive Health - Women that have ever taken birth control pills (%)
Reproductive Health - Women taking birth control pills (%)
Reproductive Health - Women that have ever used Depo-Provera or injectables (%)
Reproductive Health - Women that have ever used female hormones (%)
Sexual Behavior - People 18+ that ever had sex (vaginal, anal, or oral) (%)
Sexual Behavior - Males 18+ that ever had vaginal sex with a woman (%)
Sexual Behavior - Males 18+ that ever performed oral sex on a woman (%)
Sexual Behavior - Males 18+ that ever had anal sex with a woman (%)
Sexual Behavior - Males 18+ that ever had any sex with a man (%)
Sexual Behavior - Females 18+ that ever had vaginal sex with a man (%)
Sexual Behavior - Females 18+ that ever performed oral sex on a man (%)
Sexual Behavior - Females 18+ that ever had anal sex with a man (%)
Sexual Behavior - Females 18+ that ever had any kind of sex with a woman (%)
Sexual Behavior - Average age people first had sex
Sexual Behavior - Average number of female sex partners in lifetime (males 18+)
Sexual Behavior - Average number of female vaginal sex partners in lifetime (males 18+)
Sexual Behavior - Average age people first performed oral sex on a woman (18+)
Sexual Behavior - Average number of woman performed oral sex on in lifetime (18+)
Sexual Behavior - Average number of male sex partners in lifetime (males 18+)
Sexual Behavior - Average number of male anal sex partners in lifetime (males 18+)
Sexual Behavior - Average age people first performed oral sex on a man (18+)
Sexual Behavior - Average number of male oral sex partners in lifetime (18+)
Sexual Behavior - People using protection when performing oral sex (%)
Sexual Behavior - Average number of times people have vaginal or anal sex a year
Sexual Behavior - People having sex without condom (%)
Sexual Behavior - Average number of male sex partners in lifetime (females 18+)
Sexual Behavior - Average number of male vaginal sex partners in lifetime (females 18+)
Sexual Behavior - Average number of female sex partners in lifetime (females 18+)
Sexual Behavior - Circumcised males 18+ (%)
Sleep Disorders - Average hours sleeping at night
Sleep Disorders - People that has trouble sleeping (%)
Smoking-Cigarette Use - People smoking cigarettes (%)
Taste & Smell - People 40+ having problems with smell (%)
Taste & Smell - People 40+ having problems with taste (%)
Taste & Smell - People 40+ that ever had wisdom teeth removed (%)
Taste & Smell - People 40+ that ever had tonsils teeth removed (%)
Taste & Smell - People 40+ that ever had a loss of consciousness because of a head injury (%)
Taste & Smell - People 40+ that ever had a broken nose or other serious injury to face or skull (%)
Taste & Smell - People 40+ that ever had two or more sinus infections (%)
Weight - Average height (inches)
Weight - Average weight (pounds)
Weight - Average BMI
Weight - People that are obese (%)
Weight - People that ever were obese (%)
Weight - People trying to lose weight (%)
According to our research of Ohio and other state lists, there were 7 registered sex offenders living in Norton, Ohio as of June 05, 2024 . The ratio of all residents to sex offenders in Norton is 1,717 to 1.The ratio of registered sex offenders to all residents in this city is much lower than the state average.
Officers per 1,000 residents here:
1.35Ohio average:
2.31
Latest news from Norton, OH collected exclusively by city-data.com from local newspapers, TV, and radio stations
Ancestries: German (19.5%), Irish (10.8%), European (9.2%), American (7.0%), English (4.7%), Italian (3.7%).
Current Local Time:
Land area: 20.1 square miles.
Population density: 572 people per square mile (low).
337 residents are foreign born (1.3% Europe , 1.0% Latin America , 0.4% Asia ).
Median real estate property taxes paid for housing units with mortgages in 2022: $2,645 (1.4%)Median real estate property taxes paid for housing units with no mortgage in 2022: $2,299 (1.3%)
Nearest city with pop. 50,000+: Akron, OH
Nearest city with pop. 1,000,000+: Chicago, IL
Nearest cities:
Latitude: 41.03 N, Longitude: 81.64 W
Daytime population change due to commuting: -824 (-7.1%)Workers who live and work in this city: 1,214 (20.7%)
Property values in Norton, OH
Single-family new house construction building permits:
2015: 12 buildings , average cost: $144,2002014: 11 buildings , average cost: $144,2002013: 4 buildings , average cost: $273,3002012: 2 buildings , average cost: $352,5002011: 5 buildings , average cost: $264,8002010: 13 buildings , average cost: $159,0002009: 10 buildings , average cost: $168,5002008: 23 buildings , average cost: $131,8002007: 37 buildings , average cost: $155,0002006: 36 buildings , average cost: $160,2002005: 40 buildings , average cost: $175,5002004: 41 buildings , average cost: $148,9002003: 40 buildings , average cost: $162,1002002: 75 buildings , average cost: $134,5002001: 39 buildings , average cost: $144,4002000: 49 buildings , average cost: $143,6001999: 49 buildings , average cost: $125,4001998: 40 buildings , average cost: $136,6001997: 36 buildings , average cost: $134,200Unemployment in December 2023:
Population change in the 1990s: +51 (+0.4%).
Most common occupations in Norton, OH (%)
Both Males Females
Other sales and related occupations, including supervisors (5.2%)
Other office and administrative support workers, including supervisors (4.5%)
Other production occupations, including supervisors (4.5%)
Electrical equipment mechanics and other installation, maintenance, and repair workers, including supervisors (4.0%)
Building and grounds cleaning and maintenance occupations (3.6%)
Secretaries and administrative assistants (3.6%)
Metal workers and plastic workers (3.4%)
Electrical equipment mechanics and other installation, maintenance, and repair workers, including supervisors (7.2%)
Other production occupations, including supervisors (6.7%)
Metal workers and plastic workers (6.1%)
Driver/sales workers and truck drivers (5.4%)
Building and grounds cleaning and maintenance occupations (4.7%)
Other sales and related occupations, including supervisors (4.7%)
Sales representatives, services, wholesale and manufacturing (3.6%)
Other office and administrative support workers, including supervisors (7.9%)
Secretaries and administrative assistants (7.8%)
Other sales and related occupations, including supervisors (5.9%)
Registered nurses (4.7%)
Bookkeeping, accounting, and auditing clerks (4.5%)
Information and record clerks, except customer service representatives (4.3%)
Preschool, kindergarten, elementary, and middle school teachers (3.3%)
Tornado activity:
Norton-area historical tornado activity is near Ohio state average. It is 13% greater than the overall U.S. average.
On 5/31/1985, a category F5 (max. wind speeds 261-318 mph) tornado 28.4 miles away from the Norton city center killed 18 people and injured 310 people and caused between $50,000,000 and $500,000,000 in damages.
On 4/11/1965, a category F4 (max. wind speeds 207-260 mph) tornado 23.2 miles away from the city center killed 18 people and injured 200 people and caused between $5,000,000 and $50,000,000 in damages.
Earthquake activity:
Norton-area historical earthquake activity is significantly above Ohio state average. It is 46% smaller than the overall U.S. average. On 9/25/1998 at 19:52:52, a magnitude 5.2 (4.8 MB, 4.3 MS, 5.2 LG, 4.5 MW, Depth: 3.1 mi, Class: Moderate, Intensity: VI - VII) earthquake occurred 72.4 miles away from the city center On 1/31/1986 at 16:46:43, a magnitude 5.0 (5.0 MB) earthquake occurred 47.1 miles away from Norton center On 8/23/2011 at 17:51:04, a magnitude 5.8 (5.8 MW, Depth: 3.7 mi) earthquake occurred 292.6 miles away from Norton center On 7/27/1980 at 18:52:21, a magnitude 5.2 (5.1 MB, 4.7 MS, 5.0 UK, 5.2 UK) earthquake occurred 230.3 miles away from the city center On 7/12/1986 at 08:19:37, a magnitude 4.5 (4.5 MB, Class: Light, Intensity: IV - V) earthquake occurred 146.8 miles away from the city center On 6/10/2019 at 14:50:45, a magnitude 4.0 (4.0 MB, Depth: 1.2 mi) earthquake occurred 46.3 miles away from Norton center Magnitude types: regional Lg-wave magnitude (LG), body-wave magnitude (MB), surface-wave magnitude (MS), moment magnitude (MW) Natural disasters: The number of natural disasters in Summit County (11) is smaller than the US average (15).Major Disasters (Presidential) Declared: 7Emergencies Declared: 3Storms: 6, Tornadoes: 5, Floods: 4, Winds: 2, Blizzard: 1, Hurricane: 1, Power Outage: 1, Snowstorm: 1, Tropical Depression: 1, Other: 1 (Note: some incidents may be assigned to more than one category). Hospitals and medical centers in Norton: IDEAL NURSING HOME (5671 W WOOSTER RD)
Other hospitals and medical centers near Norton: MANOR CARE NURSING CENTER (Nursing Home, about 3 miles away; BARBERTON, OH)
INTENSIVA HOSPITAL OF AKRON (Hospital, about 3 miles away; BARBERTON, OH)
PLEASANT VIEW HEALTH CARE CENTER (Nursing Home, about 4 miles away; BARBERTON, OH)
EVANT / FRANK (Hospital, about 4 miles away; BARBERTON, OH)
MAGNOLIA VILLAGE RETIREMENT COMMUNITY LTD (Nursing Home, about 4 miles away; WADSWORTH, OH)
REM-OHIO, INC, POTTS DRIVE HOM (Hospital, about 5 miles away; BARBERTON, OH)
HOSPICE OF WADSWORTH RITTMAN (Hospital, about 5 miles away; WADSWORTH, OH)
Amtrak station near Norton: 8 miles: AKRON (906 E. BOWERY ST.) Services: enclosed waiting area, public restrooms, public payphones, free short-term parking, free long-term parking, taxi stand.
Colleges/universities with over 2000 students nearest to Norton:
University of Akron Main Campus (about 8 miles; Akron, OH ; Full-time enrollment: 22,216)
Stark State College (about 16 miles; North Canton, OH ; FT enrollment: 7,707)
Kent State University at Stark (about 16 miles; Canton, OH ; FT enrollment: 3,259)
Walsh University (about 18 miles; North Canton, OH ; FT enrollment: 2,553)
Kent State University at Kent (about 18 miles; Kent, OH ; FT enrollment: 25,431)
Malone University (about 20 miles; Canton, OH ; FT enrollment: 2,201)
The College of Wooster (about 22 miles; Wooster, OH ; FT enrollment: 2,112)
Public high school in Norton:
Public elementary/middle schools in Norton:
See full list of schools located in Norton
Notable locations in Norton: (A) , Loyal Oak Golf Club (B) , Barberton Speedway (C) , Brookside Country Club (D) , H and H Farm (E) , Dayton Nurseries (F) , City of Norton Fire Division Station 1 (G) , City of Norton Fire Division Station 2 (H) . Display/hide their locations on the map
Shopping Center: (1) . Display/hide its location on the map
Churches in Norton include: (A) , North Center Church (B) , Mount Summit Church (C) , Saint Matthews Church (D) . Display/hide their locations on the map
Cemeteries: (1) , Norton Center Cemetery (2) . Display/hide their locations on the map
Reservoir: (A) . Display/hide its location on the map
Streams, rivers, and creeks: (A) , Pigeon Creek (B) . Display/hide their locations on the map
Park in Norton: (1) . Display/hide its location on the map
Hotels:
Birthplace of: Dwier Brown - Film actor.
Summit County has a predicted average indoor radon screening level greater than 4 pCi/L (pico curies per liter) - Highest Potential Drinking water stations with addresses in Norton and their reported violations in the past:
BARBERTON CITY (Population served: 29,550, Surface water):
Past health violations:
MCL, Average - Between APR-2014 and JUN-2014, Contaminant: TTHM. Follow-up actions: St Violation/Reminder Notice (JUN-18-2014), St Public Notif requested (JUN-18-2014)
MCL, Average - Between APR-2014 and JUN-2014, Contaminant: Total Haloacetic Acids (HAA5). Follow-up actions: St Violation/Reminder Notice (JUN-18-2014), St Public Notif requested (JUN-18-2014)
MCL, Average - Between JAN-2014 and MAR-2014, Contaminant: TTHM. Follow-up actions: St Public Notif requested (MAR-18-2014), St Violation/Reminder Notice (MAR-18-2014), St Public Notif received (APR-25-2014)
MCL, Average - Between JAN-2014 and MAR-2014, Contaminant: Total Haloacetic Acids (HAA5). Follow-up actions: St Public Notif requested (MAR-18-2014), St Violation/Reminder Notice (MAR-18-2014), St Public Notif received (APR-25-2014)
MCL, Average - Between OCT-2013 and DEC-2013, Contaminant: TTHM. Follow-up actions: St Public Notif requested (NOV-18-2013), St Violation/Reminder Notice (NOV-18-2013), St Public Notif received (DEC-23-2013)
MCL, Average - Between OCT-2013 and DEC-2013, Contaminant: Total Haloacetic Acids (HAA5). Follow-up actions: St Public Notif requested (NOV-18-2013), St Violation/Reminder Notice (NOV-18-2013), St Public Notif received (DEC-23-2013)
5 other older health violations
Past monitoring violations:
9 regular monitoring violations
Population served: 175, Groundwater):
Past health violations:
MCL, Monthly (TCR) - In JAN-2008, Contaminant: Coliform. Follow-up actions: St Public Notif requested (JAN-30-2008), St Violation/Reminder Notice (JAN-30-2008), St Public Notif received (FEB-19-2008)
Population served: 130, Groundwater):
Past monitoring violations:
One routine major monitoring violation
Population served: 108, Groundwater):
Past monitoring violations:
Monitoring, Repeat Major (TCR) - Between OCT-2009 and DEC-2009, Contaminant: Coliform (TCR). Follow-up actions: St Public Notif requested (JAN-13-2010), St Violation/Reminder Notice (JAN-13-2010), St Compliance achieved (AUG-16-2011)
8 routine major monitoring violations
Population served: 100, Groundwater):
Past monitoring violations:
6 routine major monitoring violations
4 regular monitoring violations
Population served: 100, Groundwater):
Past monitoring violations:
One routine major monitoring violation
Population served: 96, Groundwater):
Past health violations:
MCL, Monthly (TCR) - Between JUL-2013 and SEP-2013, Contaminant: Coliform. Follow-up actions: St Violation/Reminder Notice (SEP-24-2013), St Public Notif requested (SEP-24-2013)
Population served: 80, Groundwater):
Past health violations:
MCL, Monthly (TCR) - In OCT-2012, Contaminant: Coliform. Follow-up actions: St Public Notif requested (NOV-08-2012), St Violation/Reminder Notice (NOV-08-2012), St Public Notif received (JAN-07-2013), St Compliance achieved (MAY-21-2013)
MCL, Monthly (TCR) - Between JUL-2012 and SEP-2012, Contaminant: Coliform. Follow-up actions: St Public Notif received (FEB-29-2012), St Public Notif requested (SEP-14-2012), St Violation/Reminder Notice (SEP-14-2012), St Compliance achieved (MAY-21-2013)
Past monitoring violations:
Monitoring, Repeat Major (TCR) - Between APR-2014 and JUN-2014, Contaminant: Coliform (TCR)
Monitoring, Source Water (GWR) - In OCT-11-2012, Contaminant: E. COLI. Follow-up actions: St Public Notif requested (OCT-24-2012), St Violation/Reminder Notice (OCT-24-2012), St Public Notif received (OCT-31-2012), St Compliance achieved (JUN-05-2013)
Monitoring, Repeat Major (TCR) - In OCT-2012, Contaminant: Coliform (TCR). Follow-up actions: St Public Notif requested (OCT-24-2012), St Violation/Reminder Notice (OCT-24-2012), St Public Notif received (OCT-31-2012), St Compliance achieved (JUN-05-2013)
Drinking water stations with addresses in Norton that have no violations reported:
LOYAL OAK LAKE PARK-KITCHEN (Population served: 250, Primary Water Source Type: Groundwater)
SWEET HENRIES PWS (Population served: 200, Primary Water Source Type: Groundwater)
OLD STONE JAIL (Population served: 100, Primary Water Source Type: Groundwater)
LOYAL OAK LAKE PARK-BATHHOUSE (Population served: 70, Primary Water Source Type: Groundwater)
LOYAL OAK LAKE PARK-WELL 2 PWS (Population served: 60, Primary Water Source Type: Groundwater)
Average household size: This city:
2.5 peopleOhio:
2.4 people
Percentage of family households: This city:
73.0%Whole state:
65.0%
Percentage of households with unmarried partners: This city:
5.7%Whole state:
6.8%
Likely homosexual households (counted as self-reported same-sex unmarried-partner households)
Lesbian couples: 0.3% of all households Gay men: 0.2% of all households
People in group quarters in Norton in 2010:
137 people in other noninstitutional facilities
5 people in group homes for juveniles (non-correctional)
4 people in group homes intended for adults
People in group quarters in Norton in 2000:
58 people in other noninstitutional group quarters
16 people in other group homes
2 people in religious group quarters
Banks with branches in Norton (2011 data):
JPMorgan Chase Bank, National Association: Norton Branch at 4169 South Cleveland-Massillon Road, branch established on 1972/12/28. Info updated 2011/11/10: Bank assets: $1,811,678.0 mil, Deposits: $1,190,738.0 mil, headquarters in Columbus, OH, positive income , International Specialization, 5577 total offices , Holding Company: Jpmorgan Chase & Co.
North Akron Savings Bank: Norton Branch at 3340 Greenwich Road, branch established on 2005/12/05. Info updated 2006/11/03: Bank assets: $157.6 mil, Deposits: $112.0 mil, headquarters in Akron, OH, negative income in the last year , Mortgage Lending Specialization, 5 total offices
RBS Citizens, National Association: Norton / Acme at 3200 Greenwich Road, branch established on 1998/09/01. Info updated 2007/09/19: Bank assets: $106,940.6 mil, Deposits: $75,690.2 mil, headquarters in Providence, RI, positive income , 1135 total offices , Holding Company: Uk Financial Investments Limited
For population 15 years and over in Norton:
Never married: 26.3%Now married: 54.3%Separated: 0.3%Widowed: 7.7%Divorced: 11.4% For population 25 years and over in Norton:
High school or higher: 92.1%Bachelor's degree or higher: 25.5%Graduate or professional degree: 9.1%Unemployed: 2.9%Mean travel time to work (commute): 19.8 minutes
Education Gini index (Inequality in education) Here:
9.8Ohio average:
11.0
Religion statistics for Norton, OH (based on Summit County data)
Religion Adherents Congregations Catholic 116,941 33 Evangelical Protestant 73,586 254 Mainline Protestant 46,521 127 Other 7,347 34 Black Protestant 6,129 26 Orthodox 4,230 12 None 287,027 -
Source: Clifford Grammich, Kirk Hadaway, Richard Houseal, Dale E.Jones, Alexei Krindatch, Richie Stanley and Richard H.Taylor. 2012. 2010 U.S.Religion Census: Religious Congregations & Membership Study. Association of Statisticians of American Religious Bodies. Jones, Dale E., et al. 2002. Congregations and Membership in the United States 2000. Nashville, TN: Glenmary Research Center. Graphs represent county-level data
Food Environment Statistics: Number of grocery stores : 84Here :
1.54 / 10,000 pop.State :
1.89 / 10,000 pop.
Number of supercenters and club stores : 4Summit County :
0.07 / 10,000 pop.Ohio :
0.13 / 10,000 pop.
Number of convenience stores (no gas) : 42Here :
0.77 / 10,000 pop.Ohio :
1.25 / 10,000 pop.
Number of convenience stores (with gas) : 145Summit County :
2.67 / 10,000 pop.Ohio :
2.93 / 10,000 pop.
Number of full-service restaurants : 337Here :
6.20 / 10,000 pop.Ohio :
6.25 / 10,000 pop.
Adult diabetes rate : Summit County :
10.7%Ohio :
10.3%
Adult obesity rate : Summit County :
27.6%State :
29.1%
Low-income preschool obesity rate : Health and Nutrition: Healthy diet rate : This city:
51.1%State:
50.4%
Average overall health of teeth and gums : People feeling badly about themselves : People not drinking alcohol at all : Average hours sleeping at night : General health condition : Average condition of hearing : This city:
77.5%State:
79.1%
More about Health and Nutrition of Norton, OH Residents
Local government employment and payroll (March 2022)
Function
Full-time employees
Monthly full-time payroll
Average yearly full-time wage
Part-time employees
Monthly part-time payroll
Police Protection - Officers
16 $110,265 $82,699 9 $11,669 Firefighters
12 $78,699 $78,699 17 $26,351 Streets and Highways
11 $54,948 $59,943 0 $0 Other Government Administration
4 $19,226 $57,678 9 $6,679 Financial Administration
2 $10,661 $63,966 1 $2,436 Police - Other
1 $3,686 $44,232 0 $0 Fire - Other
1 $3,686 $44,232 0 $0 Judicial and Legal
0 $0 3 $3,903
Totals for Government
47 $281,171 $71,788 39 $51,037
Norton government finances - Expenditure in 2017 (per resident):
Current Operations - Regular Highways: $2,190,000 ($190.17)
Police Protection: $2,168,000 ($188.26)Local Fire Protection: $1,989,000 ($172.72)Sewerage: $876,000 ($76.07)Financial Administration: $722,000 ($62.70)General Public Buildings: $557,000 ($48.37)Central Staff Services: $463,000 ($40.20)Judicial and Legal Services: $330,000 ($28.66)Parks and Recreation: $238,000 ($20.67)Natural Resources - Other: $140,000 ($12.16)Solid Waste Management: $39,000 ($3.39)Housing and Community Development: $35,000 ($3.04)Protective Inspection and Regulation - Other: $29,000 ($2.52)Water Utilities: $8,000 ($0.69)General - Interest on Debt: $422,000 ($36.64)
Other Capital Outlay - Local Fire Protection: $112,000 ($9.73)
Financial Administration: $33,000 ($2.87)
Norton government finances - Revenue in 2017 (per resident):
Charges - Sewerage: $81,000 ($7.03)
Parks and Recreation: $19,000 ($1.65)Solid Waste Management: $4,000 ($0.35)Local Intergovernmental - Highways: $830,000 ($72.07)
Housing and Community Development: $35,000 ($3.04)Miscellaneous - Special Assessments: $215,000 ($18.67)
Sale of Property: $33,000 ($2.87)Rents: $27,000 ($2.34)Fines and Forfeits: $26,000 ($2.26)Interest Earnings: $13,000 ($1.13)Revenue - Water Utilities: $170,000 ($14.76)
State Intergovernmental - Highways: $456,000 ($39.60)
General Local Government Support: $318,000 ($27.61)Tax - Individual Income: $5,205,000 ($451.98)
Property: $2,248,000 ($195.21)Corporation Net Income: $712,000 ($61.83)Motor Vehicle License: $238,000 ($20.67)Alcoholic Beverage License: $20,000 ($1.74)Occupation and Business License - Other: $16,000 ($1.39)Death and Gift: $1,000 ($0.09)
Norton government finances - Debt in 2017 (per resident):
Long Term Debt - Outstanding Unspecified Public Purpose: $11,808,000 ($1025.36)
Beginning Outstanding - Unspecified Public Purpose: $10,546,000 ($915.77)Issue, Unspecified Public Purpose: $1,263,000 ($109.67)
Norton government finances - Cash and Securities in 2017 (per resident):
Bond Funds - Cash and Securities: $1,117,000 ($97.00)
Other Funds - Cash and Securities: $10,500,000 ($911.77)
5.57% of this county's 2021 resident taxpayers lived in other counties in 2020 ($56,230 average adjusted gross income )
Here:
5.57%Ohio average:
5.68%
0.01% of residents moved from foreign countries ($80 average AGI )Summit County:
0.01%Ohio average:
0.01%
Top counties from which taxpayers relocated into this county between 2020 and 2021:
Businesses in Norton, OH
Name Count Name Count
Ace Hardware 1 McDonald's 1 Advance Auto Parts 1 Pizza Hut 1 Arby's 1 RadioShack 1 CVS 1 Subway 1 Circle K 2 T-Mobile 1 Decora Cabinetry 2 U-Haul 1 H&R Block 1 Wendy's 1 MasterBrand Cabinets 2
Strongest AM radio stations in Norton:
WHLO (640 AM; 5 kW; AKRON, OH; Owner: CLEAR CHANNEL BROADCASTING LICENSES, INC.)
WTAM (1100 AM; 50 kW; CLEVELAND, OH; Owner: JACOR BROADCASTING CORPORATION)
WKNR (850 AM; 50 kW; CLEVELAND, OH; Owner: CARON BROADCASTING, INC.)
WHK (1220 AM; 50 kW; CLEVELAND, OH; Owner: CARON BROADCASTING, INC.)
WAKR (1590 AM; 5 kW; AKRON, OH; Owner: RUBBER CITY RADIO GROUP, INC.)
WHBC (1480 AM; 15 kW; CANTON, OH; Owner: NM LICENSING, LLC)
WTOU (1350 AM; 5 kW; AKRON, OH)
WWMK (1260 AM; 10 kW; CLEVELAND, OH; Owner: ABC, INC.)
WCUE (1150 AM; 5 kW; CUYAHOGA FALLS, OH; Owner: FAMILY STATIONS, INC.)
WRCW (1060 AM; daytime; 5 kW; CANTON, OH)
WWVA (1170 AM; 53 kW; WHEELING, WV; Owner: CAPSTAR TX LIMITED PARTNERSHIP)
WERE (1300 AM; 5 kW; CLEVELAND, OH)
WRMR (1420 AM; 5 kW; CLEVELAND, OH; Owner: CLEVELAND CLASSICAL RADIO, LLC)
Strongest FM radio stations in Norton:
WKSU-FM (89.7 FM; KENT, OH; Owner: KENT STATE UNIVERSITY)
WQMX (94.9 FM; MEDINA, OH; Owner: RUBBER CITY RADIO GROUP, INC)
WONE-FM (97.5 FM; AKRON, OH; Owner: RUBBER CITY RADIO GROUP, INC.)
WZIP (88.1 FM; AKRON, OH; Owner: THE UNIVERSITY OF AKRON)
WAPS (91.3 FM; AKRON, OH; Owner: BOARD OF EDUCATION, AKRON CITY SCHOOL DISTRICT)
WAKS (96.5 FM; AKRON, OH; Owner: CAPSTAR TX LIMITED PARTNERSHIP)
WMJI (105.7 FM; CLEVELAND, OH; Owner: CITICASTERS LICENSES, L.P.)
WNCX (98.5 FM; CLEVELAND, OH; Owner: INFINITY RADIO OF CLEVELAND INC.)
WQAL (104.1 FM; CLEVELAND, OH; Owner: INFINITY RADIO OPERATIONS INC.)
WKDD (98.1 FM; CANTON, OH; Owner: CITICASTERS LICENSES, L.P.)
WMVX (106.5 FM; CLEVELAND, OH; Owner: JACOR BROADCASTING CORPORATION)
WDOK (102.1 FM; CLEVELAND, OH; Owner: INFINITY RADIO OPERATIONS INC.)
WZAK (93.1 FM; CLEVELAND, OH; Owner: RADIO ONE LICENSES, LLC)
WCRF-FM (103.3 FM; CLEVELAND, OH; Owner: THE MOODY BIBLE INSTITUTE OF CHICAGO)
WNWV (107.3 FM; ELYRIA, OH; Owner: ELYRIA-LORAIN BROADCASTING CO.)
WHBC-FM (94.1 FM; CANTON, OH; Owner: NM LICENSING, LLC)
WNIR (100.1 FM; KENT, OH; Owner: MEDIA-COM, INC.)
WMMS (100.7 FM; CLEVELAND, OH; Owner: CITICASTERS LICENSES, L.P.)
WENZ (107.9 FM; CLEVELAND, OH; Owner: RADIO ONE LICENSES, LLC)
WRQK-FM (106.9 FM; CANTON, OH; Owner: CUMULUS LICENSING CORP.)
TV broadcast stations around Norton:
WEAO (Channel 49; AKRON, OH; Owner: NORTHEASTERN EDUCATIONAL TELEVISION OF OHIO, INC.)
WVPX (Channel 23; AKRON, OH; Owner: PAXSON AKRON LICENSE, INC.)
WAKN-LP (Channel 11; AKRON, OH; Owner: AKRON TELEVISION, INC.)
WAOH-LP (Channel 29; AKRON, OH; Owner: MEDIA-COM TELEVISION, INC.)
WDLI (Channel 17; CANTON, OH; Owner: TRINITY BROADCASTING NETWORK, INC.)
WKYC-TV (Channel 3; CLEVELAND, OH; Owner: WKYC-TV, INC.)
WBNX-TV (Channel 55; AKRON, OH; Owner: WINSTON BROADCASTING NETWORK, INC.)
WOIO (Channel 19; SHAKER HEIGHTS, OH; Owner: RAYCOM NATIONAL, INC.)
WEWS-TV (Channel 5; CLEVELAND, OH; Owner: SCRIPPS HOWARD BROADCASTING COMPANY)
WQHS-TV (Channel 61; CLEVELAND, OH; Owner: UNIVISION CLEVELAND LLC)
W35AX (Channel 35; CLEVELAND, OH; Owner: MEDIA-COM TELEVISION, INC.)
WVIZ (Channel 25; CLEVELAND, OH; Owner: IDEASTREAM)
WUAB (Channel 43; LORAIN, OH; Owner: RAYCOM NATIONAL, INC.)
WJW (Channel 8; CLEVELAND, OH; Owner: WJW LICENSE, INC.)
WOAC (Channel 67; CANTON, OH; Owner: WRAY, INC.)
WRAP-CA (Channel 32; CLEVELAND, OH; Owner: COMMERCIAL BROADCASTING CORP.)
WMFD-TV (Channel 68; MANSFIELD, OH; Owner: MID-STATE TELEVISION,INC.)
WKBN-TV (Channel 27; YOUNGSTOWN, OH; Owner: PIEDMONT TELEVISION OF YOUNGSTOWN LICENSE LLC)
WXOX-LP (Channel 65; CLEVELAND, OH; Owner: VENTURE TECHNOLOGIES GROUP, LLC)
W53AX (Channel 53; CLEVELAND, OH; Owner: WORD OF GOD FELLOWSHIP, INC.)
WIVM-LP (Channel 52; CANTON, OH; Owner: LUCINDA DeVAUL-TONGES)
National Bridge Inventory (NBI) Statistics 59 Number of bridges541ft / 165m Total length $964,926,000 Total costs1,098,661 Total average daily traffic131,362 Total average daily truck traffic
New bridges - historical statistics
2 1920-1929 1 1930-1939 3 1940-1949 28 1950-1959 10 1960-1969 2 1970-1979 2 1990-1999 1 2000-2009 10 2010-2019
See full National Bridge Inventory statistics for Norton, OH
FCC Registered Cell Phone Towers: 1 (
See the full list of FCC Registered Cell Phone Towers in Norton )
FCC Registered Antenna Towers: 51 (
See the full list of FCC Registered Antenna Towers )
FCC Registered Broadcast Land Mobile Towers: 8 (
See the full list of FCC Registered Broadcast Land Mobile Towers in Norton, OH )
FCC Registered Microwave Towers: 3
WDLI DT XMTR, Sr 261, 1.1 Km. West Of Romig Rd. (Lat: 41.055556 Lon: -81.593611), Type: Tower, Structure height: 327 m, Call Sign: WPXE695, Assigned Frequencies: 7075.00 MHz, Grant Date: 03/18/2003, Expiration Date: 10/01/2013, Cancellation Date: 06/24/2009, Certifier: Terrence M Hickey, Registrant: Vice President, Engineering, 2442 Michelle Drive, Tustin, CA 92780, Phone: (714) 665-2145, Fax: (714) 730-0661, Email:
CLE0113, I-76 At Cleveland-Massilon Rd (Lat: 41.040278 Lon: -81.633333), Type: Tower, Structure height: 76.2 m, Call Sign: WQBI671, Licensee ID: L01728370, Assigned Frequencies: 18120.0 MHz, Grant Date: 10/15/2004, Expiration Date: 10/15/2014, Cancellation Date: 09/11/2013, Certifier: Joseph M Sandri Jr., Registrant: Fibertower Network Services, Corp., Debtor-In-Possession, 1875 Eye Street, Nw, 5th Floor, Room 505, Washington, DC 20006, Phone: (202) 223-1028, Email:
Gertenslager, I-76 At Cleveland-Massilon Rd (Lat: 41.040306 Lon: -81.633222), Type: Ltower, Structure height: 76.5 m, Overall height: 81.4 m, Call Sign: WQPV858, Assigned Frequencies: 17815.0 MHz, Grant Date: 07/26/2022, Expiration Date: 08/27/2032, Certifier: John E Monday, Registrant: At&t Services, Inc., 208 S Akard St, 20f, Dallas, TX 75202, Phone: (855) 699-7073, Email:
FCC Registered Amateur Radio Licenses: 102 (
See the full list of FCC Registered Amateur Radio Licenses in Norton )
FAA Registered Aircraft: 15 (
See the full list of FAA Registered Aircraft in Norton )
Home Mortgage Disclosure Act Aggregated Statistics For Year 2009(Based on 4 full tracts) A) FHA, FSA/RHS & VA B) Conventional C) Refinancings D) Home Improvement Loans F) Non-occupant Loans on Number Average Value Number Average Value Number Average Value Number Average Value Number Average Value
LOANS ORIGINATED 79 $112,678 47 $117,283 282 $119,197 14 $15,569 1 $105,000 APPLICATIONS APPROVED, NOT ACCEPTED 1 $123,000 0 $0 19 $128,994 7 $14,207 1 $148,000 APPLICATIONS DENIED 18 $89,640 3 $236,667 120 $129,277 29 $27,818 4 $40,168 APPLICATIONS WITHDRAWN 12 $95,642 5 $118,686 46 $132,946 6 $29,343 3 $44,783 FILES CLOSED FOR INCOMPLETENESS 2 $143,420 0 $0 6 $171,333 0 $0 0 $0
Aggregated Statistics For Year 2008(Based on 4 full tracts) A) FHA, FSA/RHS & VA B) Conventional C) Refinancings D) Home Improvement Loans F) Non-occupant Loans on G) Loans On Manufactured Number Average Value Number Average Value Number Average Value Number Average Value Number Average Value Number Average Value
LOANS ORIGINATED 46 $128,283 86 $123,261 169 $111,455 30 $24,548 13 $68,588 0 $0 APPLICATIONS APPROVED, NOT ACCEPTED 0 $0 12 $108,892 13 $92,388 5 $61,942 0 $0 2 $64,290 APPLICATIONS DENIED 13 $132,310 12 $157,725 164 $130,279 41 $38,971 7 $39,009 0 $0 APPLICATIONS WITHDRAWN 6 $108,483 8 $210,864 66 $141,892 7 $98,894 2 $64,000 0 $0 FILES CLOSED FOR INCOMPLETENESS 3 $128,403 0 $0 12 $122,107 3 $176,170 1 $115,000 0 $0
Aggregated Statistics For Year 2007(Based on 4 full tracts) A) FHA, FSA/RHS & VA B) Conventional C) Refinancings D) Home Improvement Loans E) Loans on Dwellings For 5+ Families F) Non-occupant Loans on G) Loans On Manufactured Number Average Value Number Average Value Number Average Value Number Average Value Number Average Value Number Average Value Number Average Value
LOANS ORIGINATED 30 $130,619 202 $130,110 228 $105,771 48 $30,509 2 $8,555,715 14 $92,287 0 $0 APPLICATIONS APPROVED, NOT ACCEPTED 0 $0 19 $110,792 76 $93,181 15 $38,561 0 $0 6 $144,500 0 $0 APPLICATIONS DENIED 8 $101,878 49 $88,673 208 $114,817 69 $53,525 0 $0 17 $86,123 5 $36,208 APPLICATIONS WITHDRAWN 3 $93,667 21 $123,628 88 $127,876 16 $79,956 0 $0 4 $53,598 0 $0 FILES CLOSED FOR INCOMPLETENESS 2 $137,000 8 $112,594 23 $116,653 1 $50,000 0 $0 1 $120,000 0 $0
Aggregated Statistics For Year 2006(Based on 4 full tracts) A) FHA, FSA/RHS & VA B) Conventional C) Refinancings D) Home Improvement Loans E) Loans on Dwellings For 5+ Families F) Non-occupant Loans on G) Loans On Manufactured Number Average Value Number Average Value Number Average Value Number Average Value Number Average Value Number Average Value Number Average Value
LOANS ORIGINATED 28 $125,045 251 $129,567 338 $93,919 65 $35,544 0 $0 32 $82,305 1 $3,000 APPLICATIONS APPROVED, NOT ACCEPTED 0 $0 26 $97,864 78 $93,154 19 $46,434 1 $500,000 6 $120,262 0 $0 APPLICATIONS DENIED 5 $123,202 79 $74,850 280 $105,985 59 $34,738 0 $0 8 $92,808 2 $27,695 APPLICATIONS WITHDRAWN 5 $119,220 31 $124,179 161 $115,529 10 $17,678 0 $0 2 $84,075 0 $0 FILES CLOSED FOR INCOMPLETENESS 0 $0 12 $160,543 60 $104,832 1 $70,000 0 $0 3 $68,563 0 $0
Aggregated Statistics For Year 2005(Based on 4 full tracts) A) FHA, FSA/RHS & VA B) Conventional C) Refinancings D) Home Improvement Loans F) Non-occupant Loans on G) Loans On Manufactured Number Average Value Number Average Value Number Average Value Number Average Value Number Average Value Number Average Value
LOANS ORIGINATED 34 $123,953 336 $112,097 409 $104,108 62 $46,222 30 $79,433 2 $139,465 APPLICATIONS APPROVED, NOT ACCEPTED 0 $0 18 $82,417 105 $96,697 17 $51,659 1 $29,000 2 $112,755 APPLICATIONS DENIED 3 $103,087 63 $91,512 312 $107,903 67 $58,480 14 $75,736 5 $57,878 APPLICATIONS WITHDRAWN 4 $138,792 41 $102,315 213 $125,853 23 $147,533 13 $67,089 0 $0 FILES CLOSED FOR INCOMPLETENESS 2 $124,625 13 $100,869 42 $134,151 2 $40,555 2 $59,345 0 $0
Aggregated Statistics For Year 2004(Based on 4 full tracts) A) FHA, FSA/RHS & VA B) Conventional C) Refinancings D) Home Improvement Loans E) Loans on Dwellings For 5+ Families F) Non-occupant Loans on G) Loans On Manufactured Number Average Value Number Average Value Number Average Value Number Average Value Number Average Value Number Average Value Number Average Value
LOANS ORIGINATED 29 $119,743 230 $109,302 410 $101,564 65 $40,546 1 $141,000 25 $88,994 1 $23,000 APPLICATIONS APPROVED, NOT ACCEPTED 1 $41,000 29 $104,777 100 $102,662 13 $26,838 0 $0 5 $66,734 3 $60,780 APPLICATIONS DENIED 1 $118,000 32 $97,941 308 $110,025 34 $26,899 0 $0 10 $75,963 8 $88,525 APPLICATIONS WITHDRAWN 8 $115,478 23 $111,081 216 $111,942 15 $29,604 0 $0 3 $67,543 0 $0 FILES CLOSED FOR INCOMPLETENESS 0 $0 9 $120,403 52 $97,282 3 $95,333 0 $0 8 $93,172 0 $0
Aggregated Statistics For Year 2003(Based on 4 full tracts) A) FHA, FSA/RHS & VA B) Conventional C) Refinancings D) Home Improvement Loans F) Non-occupant Loans on Number Average Value Number Average Value Number Average Value Number Average Value Number Average Value
LOANS ORIGINATED 43 $118,772 231 $112,865 948 $101,343 43 $30,831 52 $76,143 APPLICATIONS APPROVED, NOT ACCEPTED 1 $111,000 36 $118,838 135 $96,805 14 $25,201 6 $78,448 APPLICATIONS DENIED 12 $104,153 47 $116,526 312 $106,346 20 $23,248 11 $67,966 APPLICATIONS WITHDRAWN 3 $118,730 27 $118,819 238 $122,536 8 $11,674 4 $71,215 FILES CLOSED FOR INCOMPLETENESS 0 $0 7 $97,719 49 $119,803 0 $0 0 $0
Aggregated Statistics For Year 2002(Based on 2 full tracts) A) FHA, FSA/RHS & VA B) Conventional C) Refinancings D) Home Improvement Loans F) Non-occupant Loans on Number Average Value Number Average Value Number Average Value Number Average Value Number Average Value
LOANS ORIGINATED 24 $99,570 65 $104,571 279 $83,531 24 $14,425 20 $103,559 APPLICATIONS APPROVED, NOT ACCEPTED 2 $124,625 4 $171,610 69 $83,256 2 $6,925 0 $0 APPLICATIONS DENIED 2 $68,250 4 $72,205 129 $75,080 24 $27,860 0 $0 APPLICATIONS WITHDRAWN 6 $52,422 4 $112,758 109 $97,186 2 $11,870 0 $0 FILES CLOSED FOR INCOMPLETENESS 0 $0 6 $66,600 18 $70,666 0 $0 2 $55,390
Aggregated Statistics For Year 2001(Based on 2 full tracts) A) FHA, FSA/RHS & VA B) Conventional C) Refinancings D) Home Improvement Loans E) Loans on Dwellings For 5+ Families F) Non-occupant Loans on Number Average Value Number Average Value Number Average Value Number Average Value Number Average Value Number Average Value
LOANS ORIGINATED 38 $96,932 65 $99,853 287 $88,006 32 $18,051 2 $8,407,350 8 $75,666 APPLICATIONS APPROVED, NOT ACCEPTED 2 $83,085 2 $102,865 69 $78,497 10 $16,221 0 $0 0 $0 APPLICATIONS DENIED 2 $93,965 14 $67,683 182 $84,900 20 $20,969 0 $0 4 $58,358 APPLICATIONS WITHDRAWN 0 $0 4 $72,700 71 $83,001 8 $11,375 0 $0 2 $33,630 FILES CLOSED FOR INCOMPLETENESS 2 $84,075 0 $0 26 $99,062 0 $0 0 $0 0 $0
Aggregated Statistics For Year 2000(Based on 2 full tracts) A) FHA, FSA/RHS & VA B) Conventional C) Refinancings D) Home Improvement Loans F) Non-occupant Loans on Number Average Value Number Average Value Number Average Value Number Average Value Number Average Value
LOANS ORIGINATED 32 $89,884 93 $107,908 164 $73,362 30 $19,848 6 $55,720 APPLICATIONS APPROVED, NOT ACCEPTED 0 $0 8 $123,390 24 $82,013 16 $24,728 0 $0 APPLICATIONS DENIED 2 $95,945 18 $59,896 140 $72,317 22 $10,700 2 $12,860 APPLICATIONS WITHDRAWN 2 $53,410 6 $100,228 42 $75,784 4 $57,862 0 $0 FILES CLOSED FOR INCOMPLETENESS 0 $0 12 $108,801 16 $87,288 0 $0 2 $83,085
Aggregated Statistics For Year 1999(Based on 3 full tracts) A) FHA, FSA/RHS & VA B) Conventional C) Refinancings D) Home Improvement Loans F) Non-occupant Loans on Number Average Value Number Average Value Number Average Value Number Average Value Number Average Value
LOANS ORIGINATED 38 $100,248 179 $100,582 402 $78,364 65 $13,874 11 $68,196 APPLICATIONS APPROVED, NOT ACCEPTED 6 $104,653 14 $67,816 120 $76,298 29 $8,984 7 $83,430 APPLICATIONS DENIED 3 $109,953 37 $68,070 168 $77,622 59 $15,186 5 $38,756 APPLICATIONS WITHDRAWN 2 $144,585 32 $97,118 115 $68,066 5 $61,212 0 $0 FILES CLOSED FOR INCOMPLETENESS 0 $0 4 $66,740 26 $75,501 0 $0 2 $56,470
Detailed HMDA statistics for the following Tracts:
5320.01
, 5320.03 , 5320.04
Private Mortgage Insurance Companies Aggregated Statistics For Year 2009(Based on 4 full tracts) A) Conventional B) Refinancings Number Average Value Number Average Value
LOANS ORIGINATED 10 $169,985 13 $131,201 APPLICATIONS APPROVED, NOT ACCEPTED 5 $105,972 4 $133,102 APPLICATIONS DENIED 1 $98,000 6 $151,280 APPLICATIONS WITHDRAWN 4 $98,910 0 $0 FILES CLOSED FOR INCOMPLETENESS 0 $0 0 $0
Aggregated Statistics For Year 2008(Based on 4 full tracts) A) Conventional B) Refinancings C) Non-occupant Loans on Number Average Value Number Average Value Number Average Value
LOANS ORIGINATED 42 $140,312 6 $176,367 2 $102,000 APPLICATIONS APPROVED, NOT ACCEPTED 16 $118,168 10 $222,347 0 $0 APPLICATIONS DENIED 3 $138,177 0 $0 0 $0 APPLICATIONS WITHDRAWN 3 $136,323 0 $0 0 $0 FILES CLOSED FOR INCOMPLETENESS 2 $116,715 0 $0 0 $0
Aggregated Statistics For Year 2007(Based on 4 full tracts) A) Conventional B) Refinancings C) Non-occupant Loans on Number Average Value Number Average Value Number Average Value
LOANS ORIGINATED 81 $140,242 24 $164,769 1 $132,000 APPLICATIONS APPROVED, NOT ACCEPTED 13 $171,679 11 $149,776 1 $132,000 APPLICATIONS DENIED 2 $99,500 0 $0 1 $132,000 APPLICATIONS WITHDRAWN 2 $133,000 1 $148,000 1 $124,000 FILES CLOSED FOR INCOMPLETENESS 0 $0 0 $0 0 $0
Aggregated Statistics For Year 2006(Based on 4 full tracts) A) Conventional B) Refinancings C) Non-occupant Loans on Number Average Value Number Average Value Number Average Value
LOANS ORIGINATED 68 $158,855 27 $139,780 2 $59,345 APPLICATIONS APPROVED, NOT ACCEPTED 6 $198,358 8 $125,919 1 $63,000 APPLICATIONS DENIED 1 $142,000 0 $0 0 $0 APPLICATIONS WITHDRAWN 0 $0 3 $186,200 0 $0 FILES CLOSED FOR INCOMPLETENESS 0 $0 0 $0 0 $0
Aggregated Statistics For Year 2005(Based on 4 full tracts) A) Conventional B) Refinancings C) Non-occupant Loans on Number Average Value Number Average Value Number Average Value
LOANS ORIGINATED 63 $139,578 32 $139,666 6 $103,982 APPLICATIONS APPROVED, NOT ACCEPTED 5 $215,794 19 $135,372 1 $122,000 APPLICATIONS DENIED 0 $0 0 $0 0 $0 APPLICATIONS WITHDRAWN 1 $95,000 7 $126,956 1 $135,000 FILES CLOSED FOR INCOMPLETENESS 0 $0 0 $0 0 $0
Aggregated Statistics For Year 2004(Based on 4 full tracts) A) Conventional B) Refinancings C) Non-occupant Loans on Number Average Value Number Average Value Number Average Value
LOANS ORIGINATED 44 $130,128 21 $133,206 1 $76,000 APPLICATIONS APPROVED, NOT ACCEPTED 9 $163,996 24 $125,316 1 $80,000 APPLICATIONS DENIED 1 $75,000 2 $114,735 3 $101,490 APPLICATIONS WITHDRAWN 3 $148,670 4 $102,868 0 $0 FILES CLOSED FOR INCOMPLETENESS 0 $0 0 $0 0 $0
Aggregated Statistics For Year 2003(Based on 4 full tracts) A) Conventional B) Refinancings C) Non-occupant Loans on Number Average Value Number Average Value Number Average Value
LOANS ORIGINATED 53 $135,206 83 $127,441 3 $96,947 APPLICATIONS APPROVED, NOT ACCEPTED 7 $142,580 37 $133,363 0 $0 APPLICATIONS DENIED 2 $121,660 2 $128,585 2 $128,585 APPLICATIONS WITHDRAWN 2 $92,000 14 $126,775 0 $0 FILES CLOSED FOR INCOMPLETENESS 1 $228,000 0 $0 0 $0
Aggregated Statistics For Year 2002(Based on 2 full tracts) A) Conventional B) Refinancings Number Average Value Number Average Value
LOANS ORIGINATED 26 $97,388 34 $106,416 APPLICATIONS APPROVED, NOT ACCEPTED 2 $125,615 12 $102,207 APPLICATIONS DENIED 0 $0 0 $0 APPLICATIONS WITHDRAWN 0 $0 4 $91,492 FILES CLOSED FOR INCOMPLETENESS 0 $0 4 $123,142
Aggregated Statistics For Year 2001(Based on 2 full tracts) A) Conventional B) Refinancings Number Average Value Number Average Value
LOANS ORIGINATED 22 $108,261 34 $115,957 APPLICATIONS APPROVED, NOT ACCEPTED 4 $110,780 16 $98,044 APPLICATIONS DENIED 0 $0 0 $0 APPLICATIONS WITHDRAWN 0 $0 2 $64,290 FILES CLOSED FOR INCOMPLETENESS 0 $0 0 $0
Aggregated Statistics For Year 2000(Based on 2 full tracts) A) Conventional B) Refinancings Number Average Value Number Average Value
LOANS ORIGINATED 34 $107,463 6 $92,317 APPLICATIONS APPROVED, NOT ACCEPTED 4 $116,715 2 $73,195 APPLICATIONS DENIED 2 $64,290 0 $0 APPLICATIONS WITHDRAWN 0 $0 0 $0 FILES CLOSED FOR INCOMPLETENESS 2 $100,890 0 $0
Aggregated Statistics For Year 1999(Based on 3 full tracts) A) Conventional B) Refinancings C) Non-occupant Loans on Number Average Value Number Average Value Number Average Value
LOANS ORIGINATED 43 $105,806 21 $103,410 4 $82,090 APPLICATIONS APPROVED, NOT ACCEPTED 4 $122,970 2 $141,600 0 $0 APPLICATIONS DENIED 2 $76,515 6 $119,793 0 $0 APPLICATIONS WITHDRAWN 0 $0 0 $0 0 $0 FILES CLOSED FOR INCOMPLETENESS 0 $0 0 $0 0 $0
Detailed PMIC statistics for the following Tracts:
5320.01
, 5320.03 , 5320.04 Norton compared to Ohio state average:
Unemployed percentage significantly below state average. Black race population percentage significantly below state average. Hispanic race population percentage below state average. Foreign-born population percentage below state average. Renting percentage below state average. Length of stay since moving in significantly above state average.
Top Patent Applicants
Todd A. Buxton (8)
John Blosco (7)
Leonard James Reiter (6)
Jason A. Belton (6)
Nathan Yensho (5)
David Mark Frantz (5)
Ronald D. Stevens (4)
John Martin Blosco (4)
Jason Anthony Belton (4)
Todd Alan Buxton (3)
Total of 107 patent applications in 2008-2024.


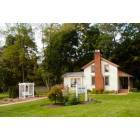
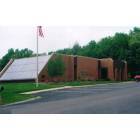
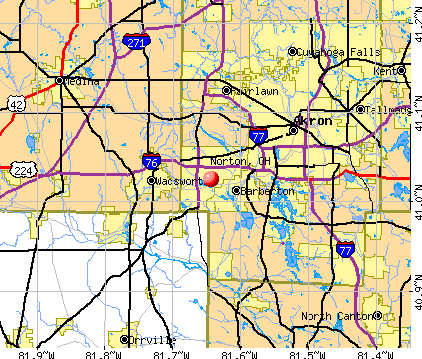


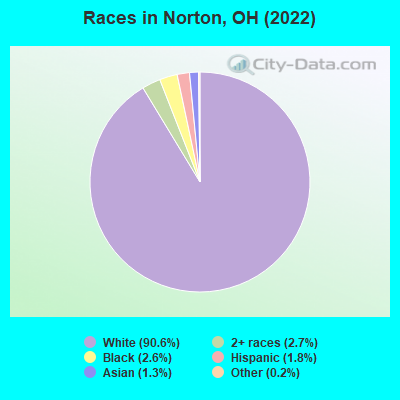
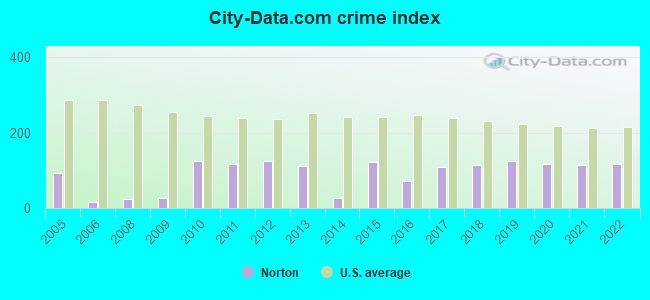
 Recent articles from our blog. Our writers, many of them Ph.D. graduates or candidates, create easy-to-read articles on a wide variety of topics.

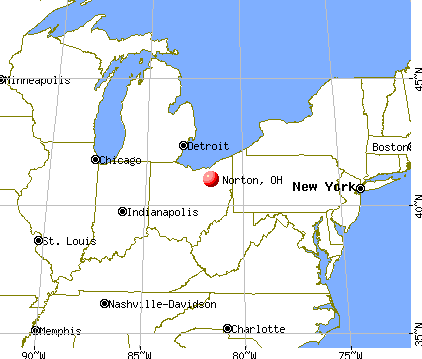
 (7.4 miles
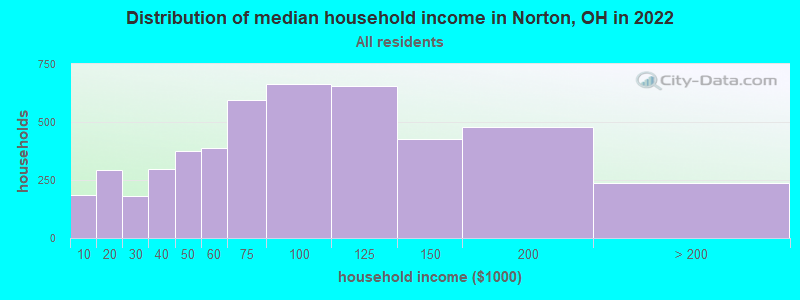
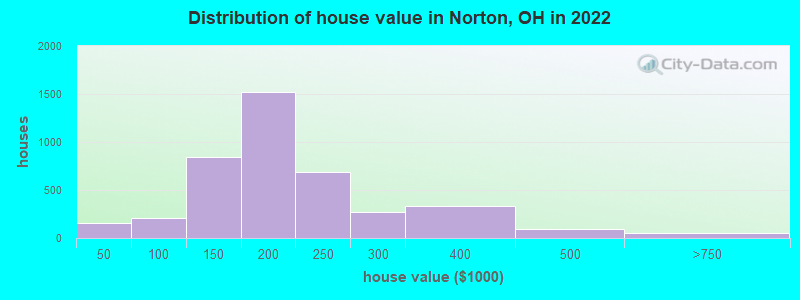

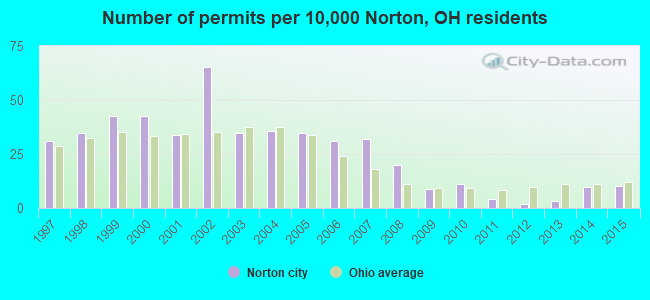
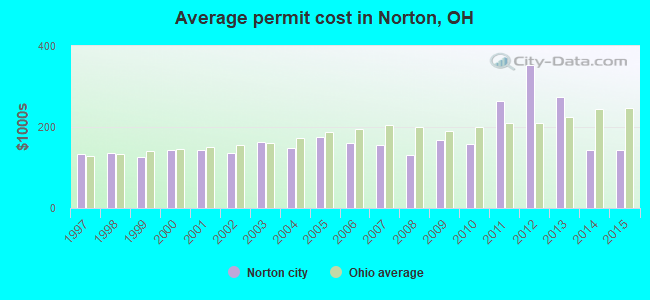
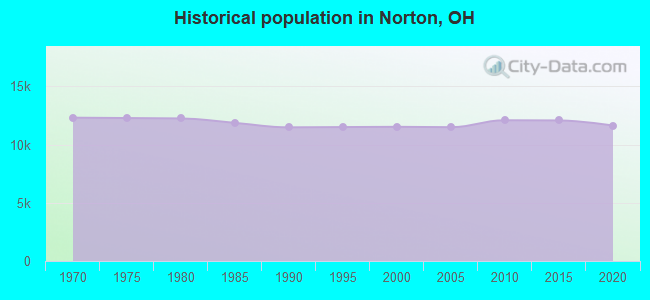
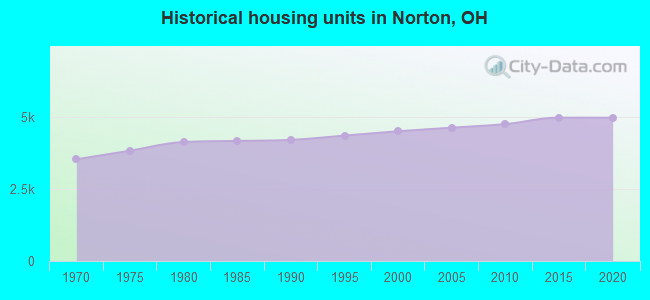
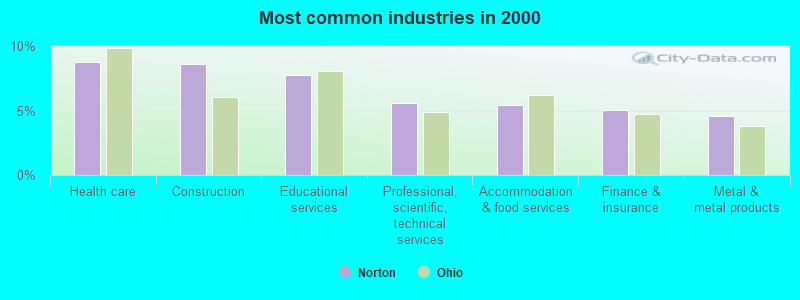
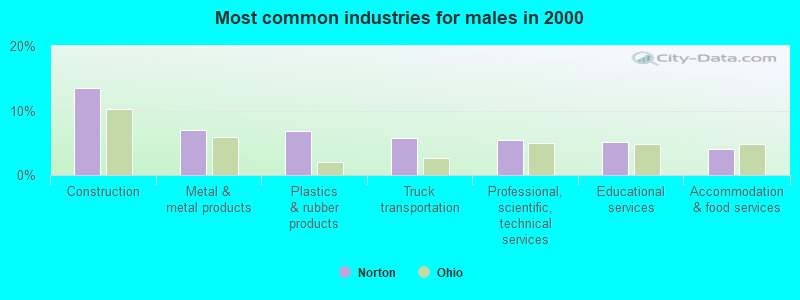
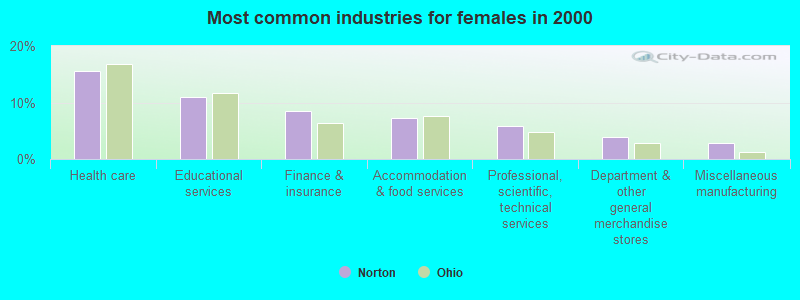
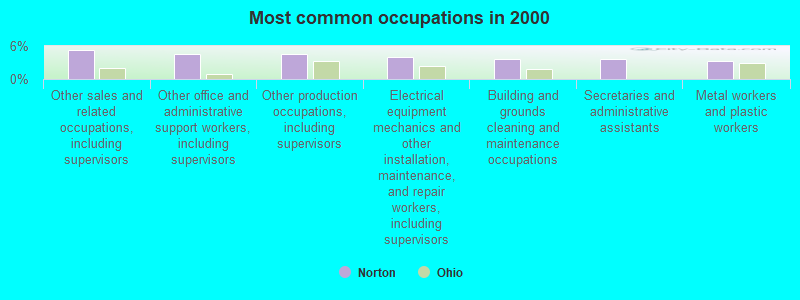
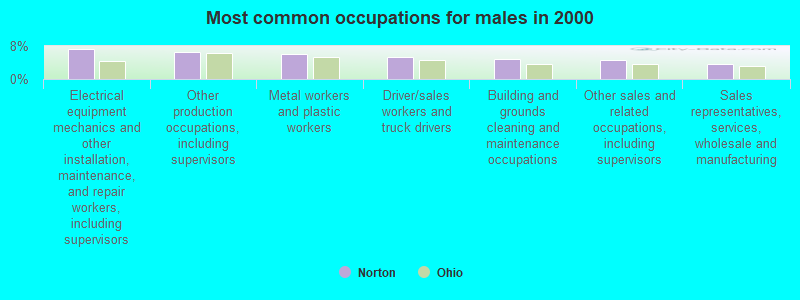
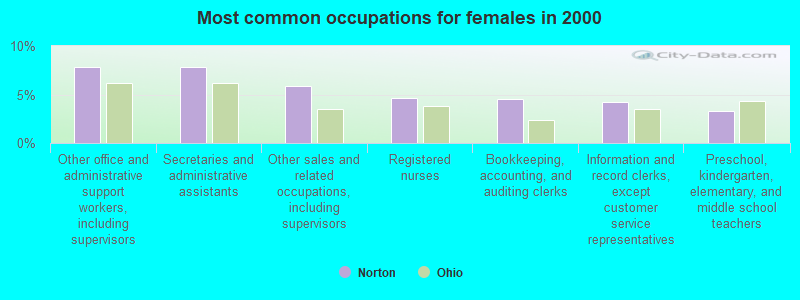


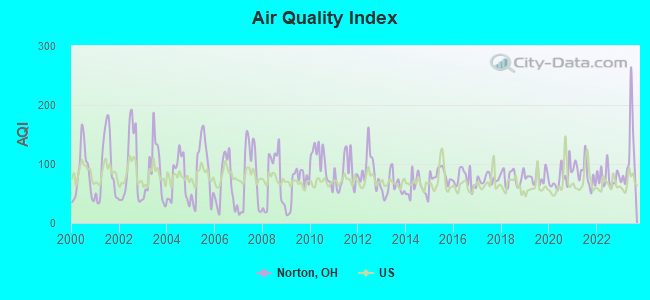
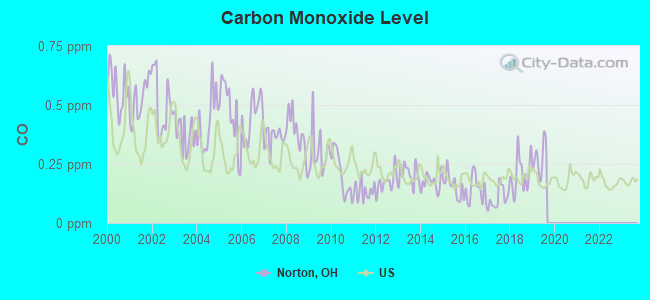
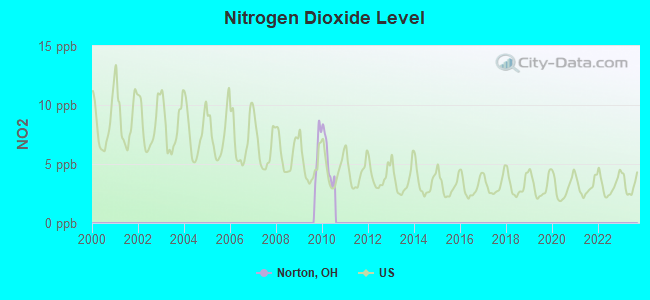
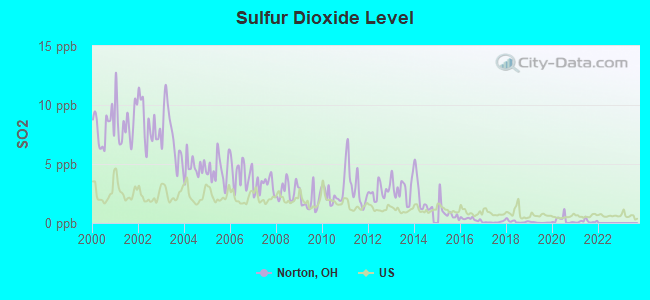
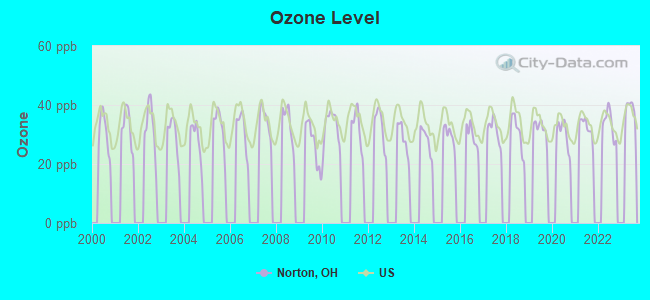
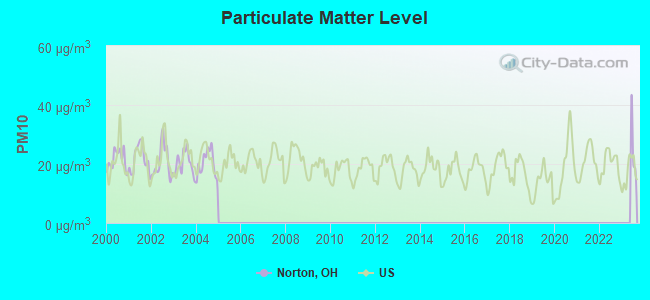
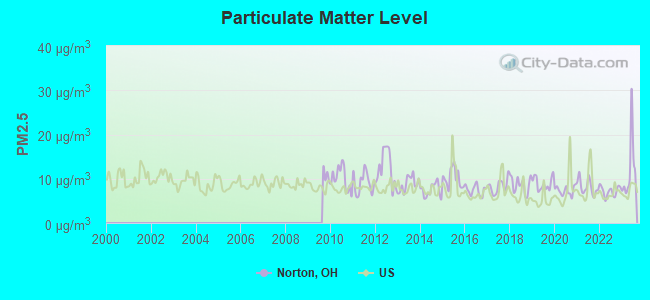

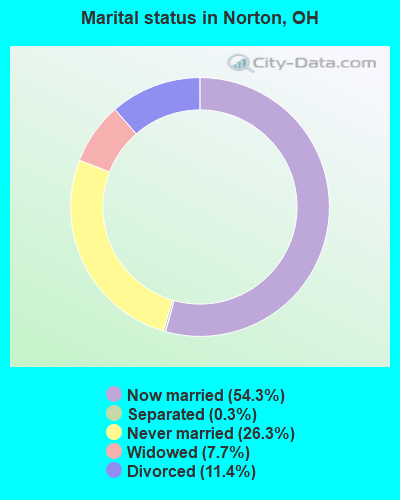
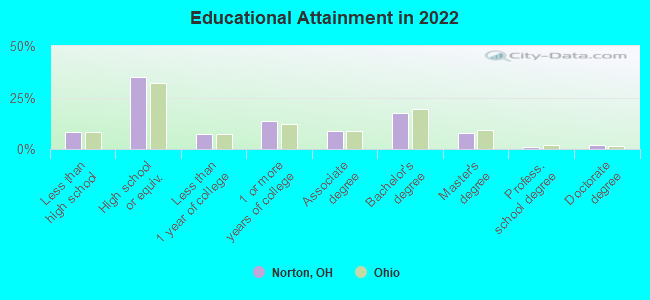
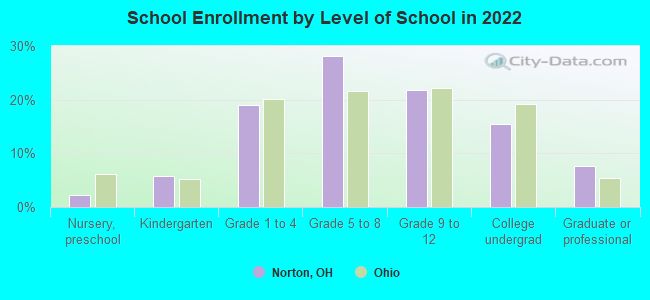
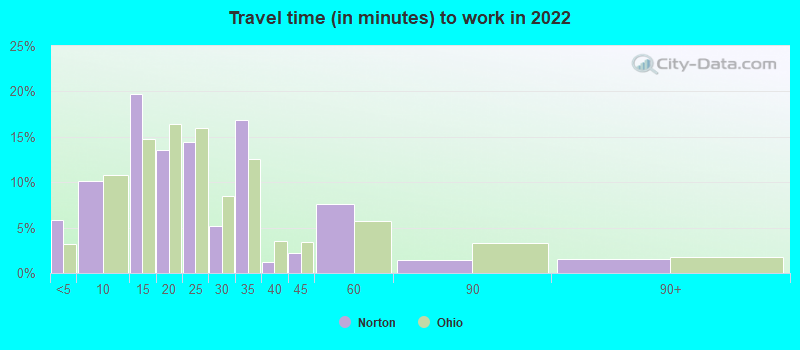
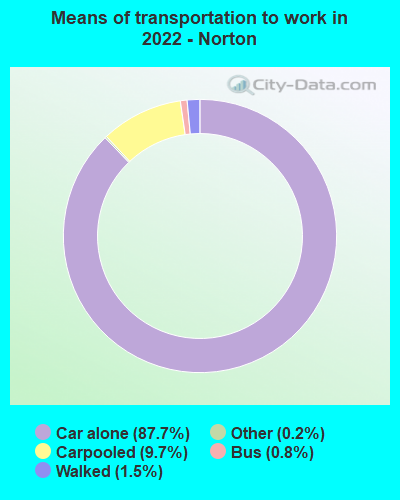
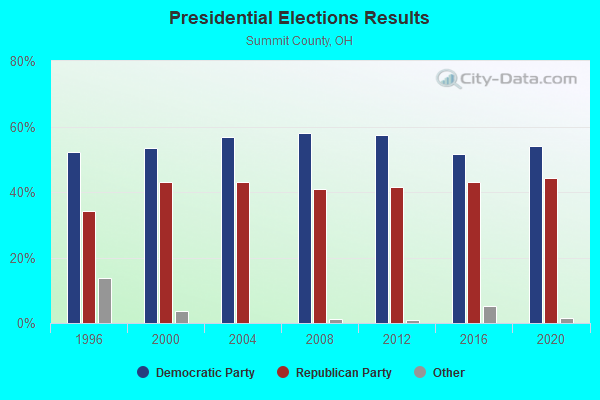
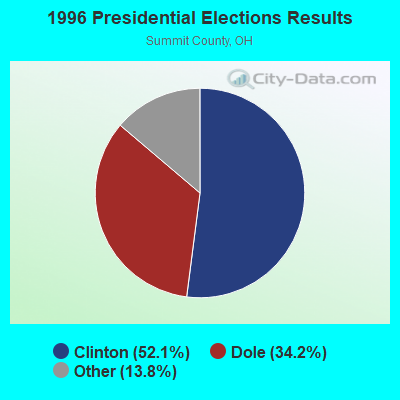
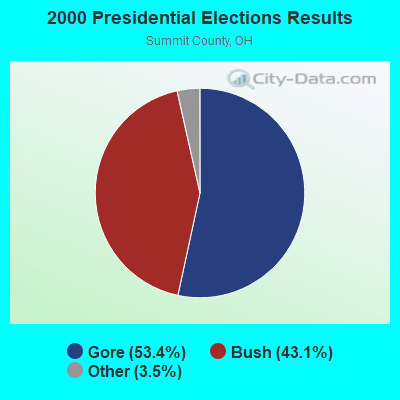
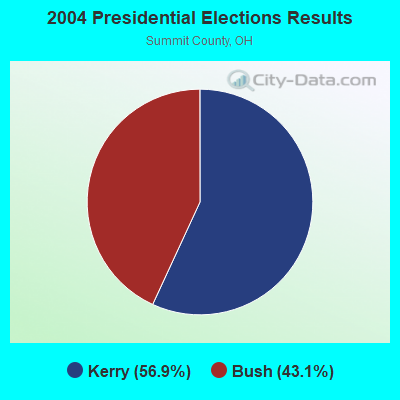
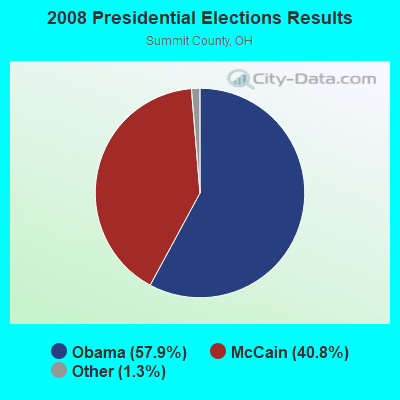
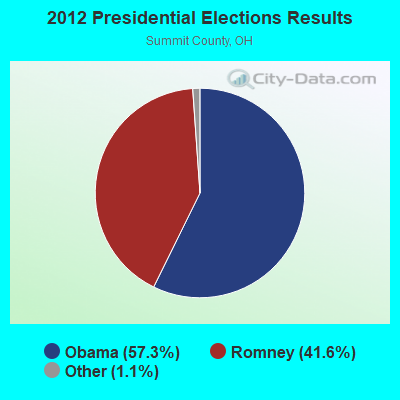
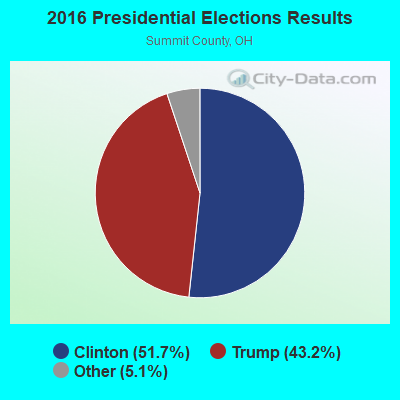
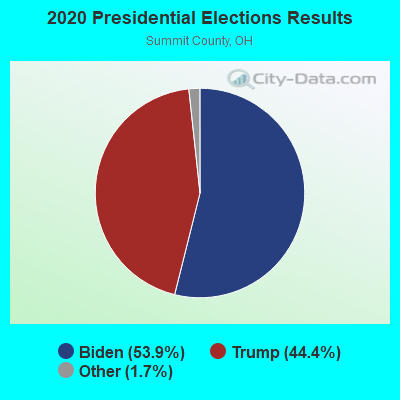
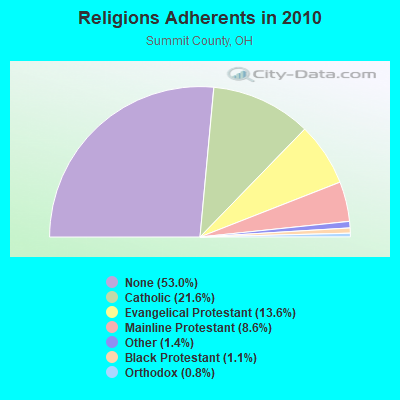
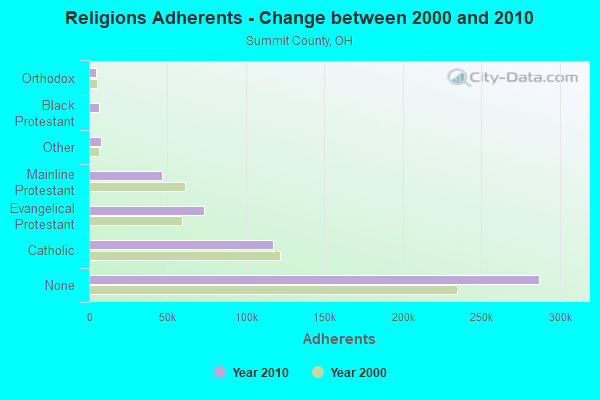
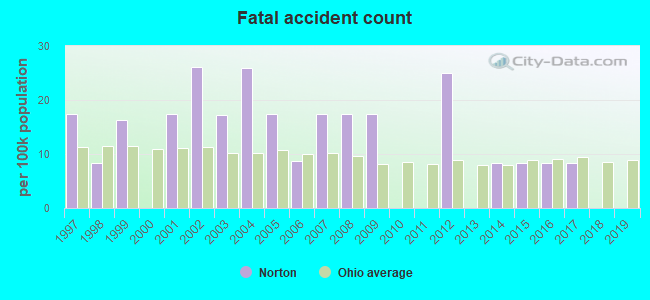
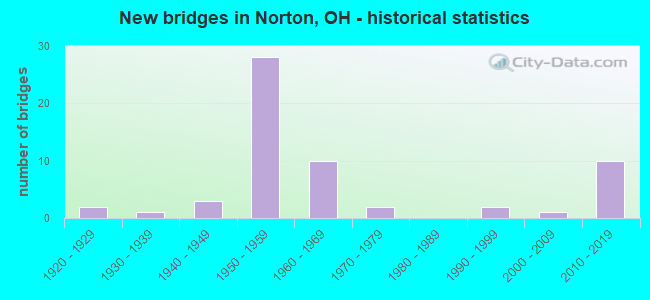
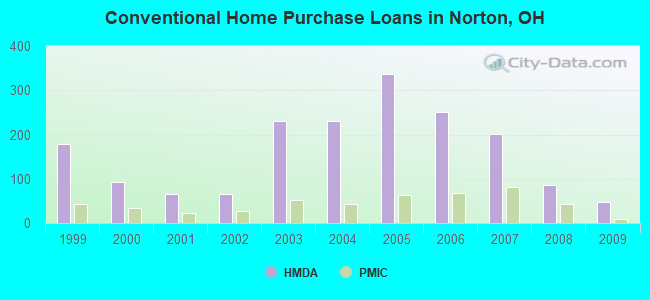
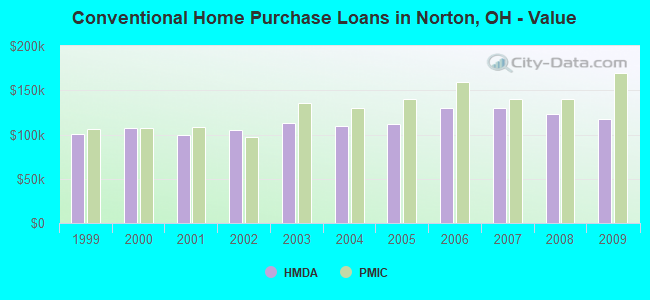
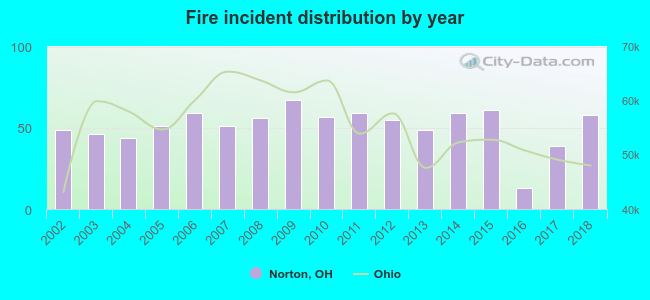 Based on the data from the years 2002 - 2018 the average number of fires per year is 51. The highest number of fires - 67 took place in 2009, and the least - 13 in 2016. The data has a growing trend.
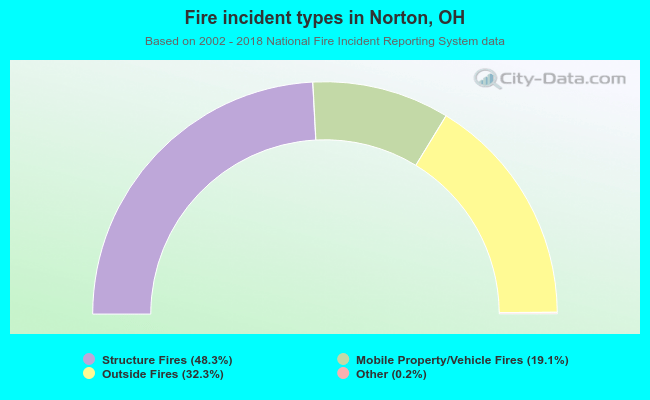 When looking into fire subcategories, the most reports belonged to: Structure Fires (48.3%), and Outside Fires (32.3%).