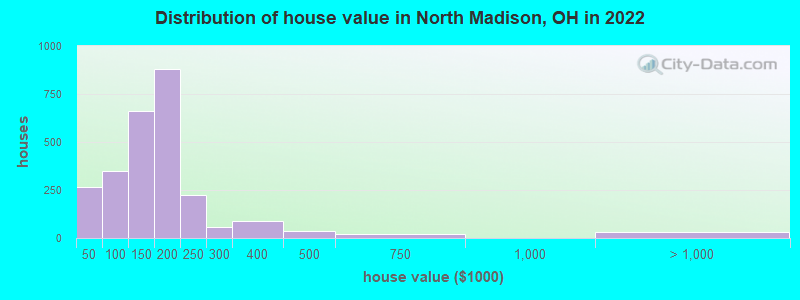
Estimated median house or condo value in 2022: $155,975 (it was $96,000 in 2000)
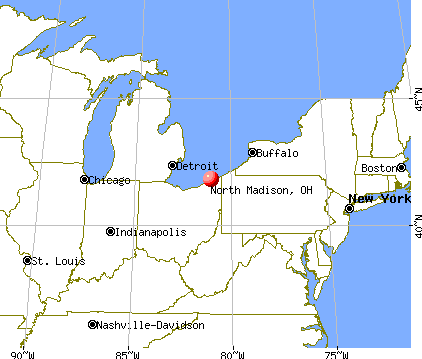
North Madison:
$155,975
OH:
$204,100
Mean prices in 2022:all housing units: $260,731; detached houses: $276,972; townhouses or other attached units: $198,798; in 2-unit structures: $173,830; in 3-to-4-unit structures: $139,925; in 5-or-more-unit structures: $157,060; mobile homes: $26,834
Median gross rent in 2022: $1,069.
March 2022 cost of living index in North Madison: 94.4 (less than average, U.S. average is 100)
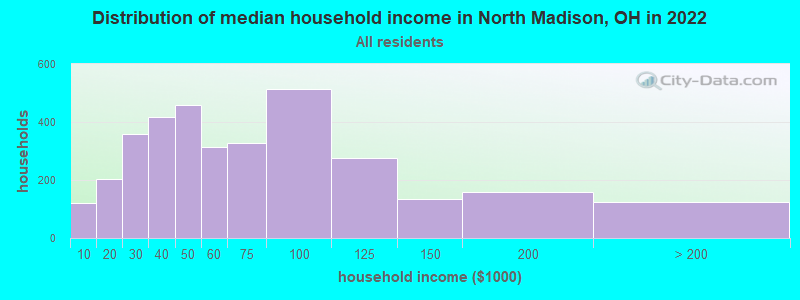
Percentage of residents living in poverty in 2022: 6.4%
(6.4% for White Non-Hispanic residents, 3.0% for Black residents, 10.2% for Hispanic or Latino residents)
Latest news from North Madison, OH collected exclusively by city-data.com from local newspapers, TV, and radio stations
Ancestries: German (20.0%), English (8.9%), Irish (7.9%), Italian (7.5%), American (7.1%), Hungarian (5.3%).
Current Local Time: EST time zone
Elevation: 676 feet
Land area: 4.01 square miles.
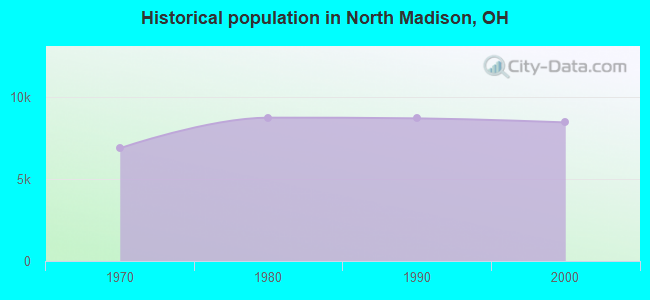
Population density: 2,132 people per square mile (low).
104 residents are foreign born
This place:
1.3%
Ohio:
4.9%
Median real estate property taxes paid for housing units with mortgages in 2022: $2,935 (1.6%) Median real estate property taxes paid for housing units with no mortgage in 2022: $2,324 (1.8%)
Nearest city with pop. 50,000+: Mentor, OH (17.6 miles , pop. 50,278).
Nearest city with pop. 200,000+: Cleveland, OH (39.8 miles , pop. 478,403).
Nearest city with pop. 1,000,000+: Philadelphia, PA (334.0 miles , pop. 1,517,550).
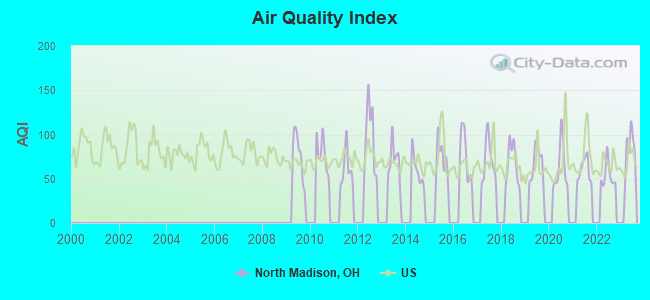
Air Quality Index (AQI) level in 2022 was 53.7. This is better than average.
City:
53.7
U.S.:
72.6
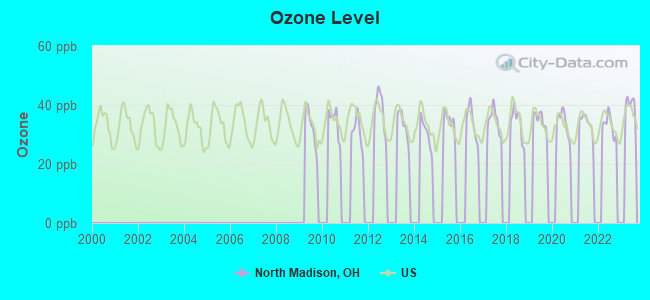
Ozone [ppb] level in 2022 was 33.3. This is about average.Closest monitor was 12.0 miles away from the city center.
City:
33.3
U.S.:
33.3
Tornado activity:
North Madison-area historical tornado activity is below Ohio state average. It is 31% smaller than the overall U.S. average.
On 5/31/1985, a category F4 (max. wind speeds 207-260 mph) tornado 26.2 miles away from the North Madison place center killed 12 peopleand injured 82 peopleand causedbetween $5,000,000 and $50,000,000 in damages.
On 5/31/1985, a category F5 (max. wind speeds 261-318 mph) tornado 44.0 miles away from the place center killed 18 peopleand injured 310 peopleand causedbetween $50,000,000 and $500,000,000 in damages.
Earthquake activity:
North Madison-area historical earthquake activity is significantly above Ohio state average. It is 57% smaller than the overall U.S. average.
On 9/25/1998 at 19:52:52, a magnitude 5.2 (4.8 MB, 4.3 MS, 5.2 LG, 4.5 MW, Depth: 3.1 mi, Class: Moderate, Intensity: VI - VII) earthquake occurred 41.5 miles away from the city center On 1/31/1986 at 16:46:43, a magnitude 5.0 (5.0 MB) earthquake occurred 16.8 miles away from the city center On 8/23/2011 at 17:51:04, a magnitude 5.8 (5.8 MW, Depth: 3.7 mi) earthquake occurred 317.8 miles away from North Madison center On 6/10/2019 at 14:50:45, a magnitude 4.0 (4.0 MB, Depth: 1.2 mi, Class: Light, Intensity: IV - V) earthquake occurred 23.1 miles away from the city center On 1/26/2001 at 03:03:20, a magnitude 3.9 (3.9 MB, Depth: 3.1 mi, Class: Light, Intensity: II - III) earthquake occurred 15.2 miles away from North Madison center On 12/31/2011 at 20:05:01, a magnitude 4.0 (4.0 ML, Depth: 3.1 mi) earthquake occurred 52.8 miles away from North Madison center Magnitude types: regional Lg-wave magnitude (LG), body-wave magnitude (MB), local magnitude (ML), surface-wave magnitude (MS), moment magnitude (MW)
Natural disasters:
The number of natural disasters in Lake County (12) is smaller than the US average (15). Major Disasters (Presidential) Declared: 7 Emergencies Declared: 4
Causes of natural disasters: Floods: 6, Storms: 5, Tornadoes: 2, Winds: 2, Blizzard: 1, Heavy Rain: 1, Hurricane: 1, Power Outage: 1, Snow: 1, Snowstorm: 1, Tropical Storm: 1, Other: 1 (Note: some incidents may be assigned to more than one category).
Hospitals and medical centers near North Madison:
LAKE COUNTY DIALYSIS (Dialysis Facility, about 1 miles away; MADISON, OH)
CARDINAL WOODS SKILLED NURSING AND REHAB CTR (Nursing Home, about 1 miles away; MADISON, OH)
NORTHEASTERN OHIO GENERAL HOSPITAL (Hospital, about 1 miles away; MADISON, OH)
GABLES,THE (Hospital, about 4 miles away; MADISON, OH)
BROADFIELD CARE CENTER (Nursing Home, about 4 miles away; MADISON, OH)
BROADFIELD MANOR NURSING AND CONV HME (Nursing Home, about 4 miles away; MADISON, OH)
MADISON VILLAGE MANOR (Hospital, about 5 miles away; MADISON, OH)
Operable nuclear power plant near North Madison:
4 miles: Perry 1 in North Perry, OH.
Colleges/universities with over 2000 students nearest to North Madison:
Lakeland Community College (about 21 miles; Kirtland, OH; Full-time enrollment: 6,170)
John Carroll University (about 35 miles; University Heights, OH; FT enrollment: 3,546)
Case Western Reserve University (about 37 miles; Cleveland, OH; FT enrollment: 7,034)
Cleveland State University (about 40 miles; Cleveland, OH; FT enrollment: 14,161)
Cuyahoga Community College District (about 40 miles; Cleveland, OH; FT enrollment: 20,271)
Edinboro University of Pennsylvania (about 49 miles; Edinboro, PA; FT enrollment: 6,746)
Allegheny College (about 49 miles; Meadville, PA; FT enrollment: 2,249)
Notable locations in North Madison: Madison Country Club (A), Erie Shores Golf Course (B), Camp Wingfoot (C), Madison Fire District Station 2 (D). Display/hide their locations on the map
Lake County has a predicted average indoor radon screening level between 2 and 4 pCi/L (pico curies per liter) - Moderate Potential
Average household size:
This place:
2.6 people
Ohio:
2.4 people
Percentage of family households:
This place:
69.4%
Whole state:
65.0%
Percentage of households with unmarried partners:
This place:
8.3%
Whole state:
6.8%
Likely homosexual households (counted as self-reported same-sex unmarried-partner households)
Lesbian couples: 0.2% of all households
Gay men: 0.2% of all households
7 people in residential treatment centers for adults in 2010
6 people in workers' group living quarters and job corps centers in 2010
9 people in homes for the physically handicapped in 2000
8 people in homes for the mentally ill in 2000
Banks with branches in North Madison (2011 data):
Northwest Savings Bank: Hubbard Branch at 1903 Hubbard Road, branch established on 1999/06/10. Info updated 2009/11/23: Bank assets: $7,975.9 mil, Deposits: $5,985.6 mil, headquarters in Warren, PA, positive income, Mortgage Lending Specialization, 172 total offices
KeyBank National Association: Madison Mall Branch at 6666 North Ridge Road, branch established on 1966/12/19. Info updated 2008/03/03: Bank assets: $86,198.8 mil, Deposits: $64,214.8 mil, headquarters in Cleveland, OH, positive income, Commercial Lending Specialization, 1067 total offices, Holding Company: Keycorp
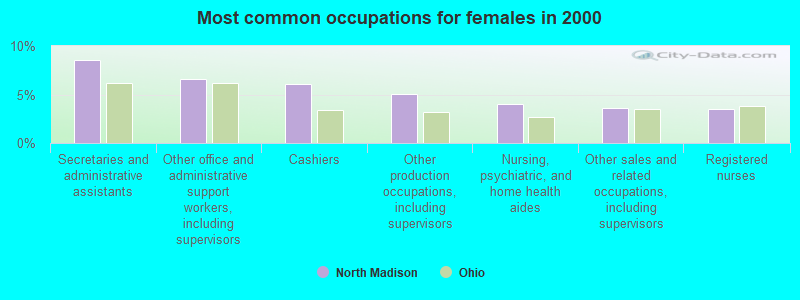
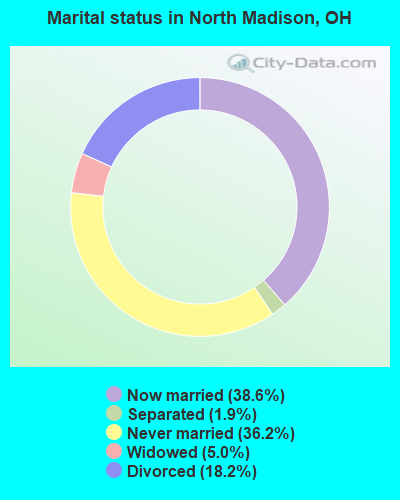
For population 15 years and over in North Madison:
Never married: 36.2%
Now married: 38.6%
Separated: 1.9%
Widowed: 5.0%
Divorced: 18.2%
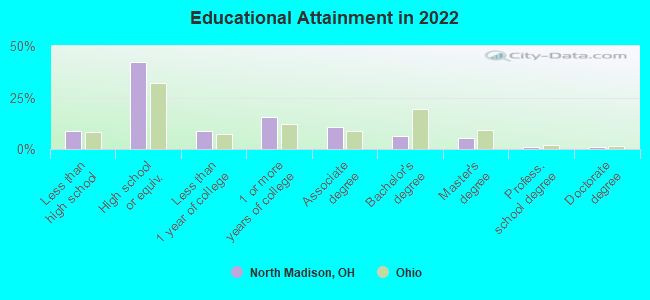
For population 25 years and over in North Madison:
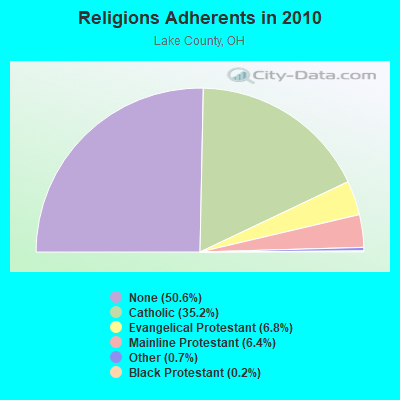
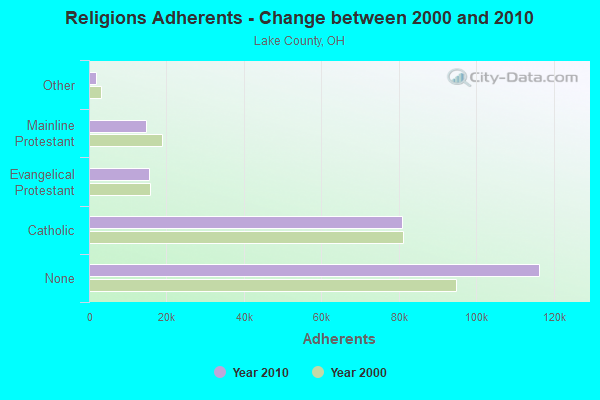
Religion statistics for North Madison, OH (based on Lake County data)
Religion
Adherents
Congregations
Catholic
80,869
16
Evangelical Protestant
15,598
88
Mainline Protestant
14,757
40
Other
1,715
16
Black Protestant
552
6
Orthodox
216
1
None
116,334
-
Source: Clifford Grammich, Kirk Hadaway, Richard Houseal, Dale E.Jones, Alexei Krindatch, Richie Stanley and Richard H.Taylor. 2012. 2010 U.S.Religion Census: Religious Congregations & Membership Study. Association of Statisticians of American Religious Bodies. Jones, Dale E., et al. 2002. Congregations and Membership in the United States 2000. Nashville, TN: Glenmary Research Center. Graphs represent county-level data
Call Sign: KB8EB, Licensee ID: L00282641, Grant Date: 08/18/2020, Expiration Date: 11/13/2030, Registrant: L William Somrak, 6322 Scotland St, North Madison, OH 44057
Call Sign: KB8SZQ, Licensee ID: L00840331, Grant Date: 04/04/2014, Expiration Date: 06/28/2024, Certifier: Joseph R Lefezhocz, Registrant: Joseph R Lefezhocz, 6287 Berwick Ln, North Madison, OH 44057
Home Mortgage Disclosure Act Aggregated Statistics For Year 2009 (Based on 1 full and 2 partial tracts)
A) FHA, FSA/RHS & VA Home Purchase Loans
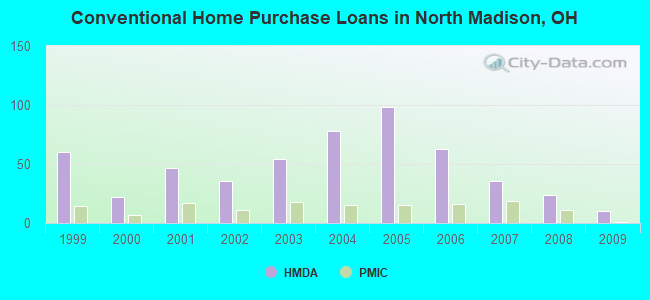
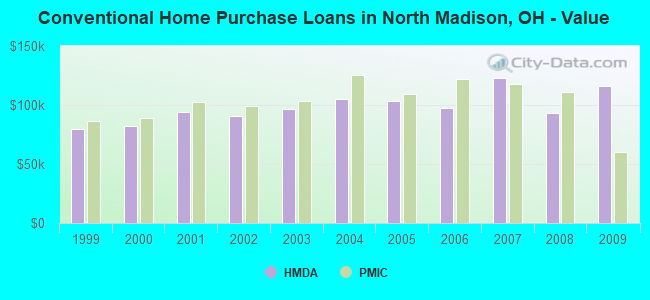
B) Conventional Home Purchase Loans
C) Refinancings
D) Home Improvement Loans
F) Non-occupant Loans on < 5 Family Dwellings (A B C & D)
G) Loans On Manufactured Home Dwelling (A B C & D)
Number
Average Value
Number
Average Value
Number
Average Value
Number
Average Value
Number
Average Value
Number
Average Value
LOANS ORIGINATED
18
$110,983
10
$116,477
59
$125,513
3
$52,883
6
$117,533
0
$0
APPLICATIONS APPROVED, NOT ACCEPTED
0
$0
1
$79,420
11
$63,721
1
$12,660
0
$0
0
$0
APPLICATIONS DENIED
0
$0
1
$151,570
34
$113,769
7
$50,870
2
$108,590
1
$26,850
APPLICATIONS WITHDRAWN
3
$75,700
2
$171,205
14
$126,676
0
$0
1
$222,850
0
$0
FILES CLOSED FOR INCOMPLETENESS
0
$0
0
$0
3
$79,020
0
$0
0
$0
0
$0
Aggregated Statistics For Year 2008 (Based on 1 full and 2 partial tracts)
A) FHA, FSA/RHS & VA Home Purchase Loans
B) Conventional Home Purchase Loans
C) Refinancings
D) Home Improvement Loans
F) Non-occupant Loans on < 5 Family Dwellings (A B C & D)
G) Loans On Manufactured Home Dwelling (A B C & D)
Number
Average Value
Number
Average Value
Number
Average Value
Number
Average Value
Number
Average Value
Number
Average Value
LOANS ORIGINATED
24
$110,294
24
$93,443
55
$150,441
4
$14,360
12
$79,875
0
$0
APPLICATIONS APPROVED, NOT ACCEPTED
0
$0
1
$108,030
9
$82,178
1
$15,120
0
$0
0
$0
APPLICATIONS DENIED
2
$143,070
3
$77,227
47
$127,409
8
$27,881
1
$140,850
1
$25,570
APPLICATIONS WITHDRAWN
1
$149,270
2
$126,000
13
$127,517
1
$57,410
1
$50,000
0
$0
FILES CLOSED FOR INCOMPLETENESS
1
$82,000
0
$0
4
$143,735
0
$0
0
$0
0
$0
Aggregated Statistics For Year 2007 (Based on 1 full and 2 partial tracts)
A) FHA, FSA/RHS & VA Home Purchase Loans
B) Conventional Home Purchase Loans
C) Refinancings
D) Home Improvement Loans
F) Non-occupant Loans on < 5 Family Dwellings (A B C & D)
G) Loans On Manufactured Home Dwelling (A B C & D)
Number
Average Value
Number
Average Value
Number
Average Value
Number
Average Value
Number
Average Value
Number
Average Value
LOANS ORIGINATED
10
$124,920
36
$122,684
77
$105,790
17
$33,860
17
$126,422
0
$0
APPLICATIONS APPROVED, NOT ACCEPTED
0
$0
4
$147,208
17
$113,302
2
$84,055
2
$105,445
0
$0
APPLICATIONS DENIED
3
$135,890
11
$105,033
89
$112,164
17
$48,469
6
$92,108
2
$40,855
APPLICATIONS WITHDRAWN
1
$164,600
6
$173,047
31
$115,160
1
$23,120
5
$76,604
0
$0
FILES CLOSED FOR INCOMPLETENESS
0
$0
2
$134,420
5
$126,978
0
$0
1
$155,430
0
$0
Aggregated Statistics For Year 2006 (Based on 1 full and 2 partial tracts)
A) FHA, FSA/RHS & VA Home Purchase Loans
B) Conventional Home Purchase Loans
C) Refinancings
D) Home Improvement Loans
F) Non-occupant Loans on < 5 Family Dwellings (A B C & D)
G) Loans On Manufactured Home Dwelling (A B C & D)
Number
Average Value
Number
Average Value
Number
Average Value
Number
Average Value
Number
Average Value
Number
Average Value
LOANS ORIGINATED
16
$129,482
63
$97,597
113
$98,448
21
$40,223
13
$99,031
1
$19,980
APPLICATIONS APPROVED, NOT ACCEPTED
0
$0
10
$100,013
28
$111,318
6
$72,067
5
$128,118
0
$0
APPLICATIONS DENIED
2
$131,015
16
$107,679
90
$110,276
22
$38,205
4
$237,650
3
$67,753
APPLICATIONS WITHDRAWN
0
$0
6
$75,908
44
$120,576
5
$66,534
1
$121,360
0
$0
FILES CLOSED FOR INCOMPLETENESS
0
$0
1
$60,000
16
$112,899
0
$0
0
$0
0
$0
Aggregated Statistics For Year 2005 (Based on 1 full and 2 partial tracts)
A) FHA, FSA/RHS & VA Home Purchase Loans
B) Conventional Home Purchase Loans
C) Refinancings
D) Home Improvement Loans
F) Non-occupant Loans on < 5 Family Dwellings (A B C & D)
G) Loans On Manufactured Home Dwelling (A B C & D)
Number
Average Value
Number
Average Value
Number
Average Value
Number
Average Value
Number
Average Value
Number
Average Value
LOANS ORIGINATED
18
$118,327
98
$103,246
147
$101,148
12
$43,942
16
$133,049
1
$50,690
APPLICATIONS APPROVED, NOT ACCEPTED
1
$168,000
9
$79,087
32
$102,789
3
$13,250
2
$93,165
0
$0
APPLICATIONS DENIED
5
$141,746
15
$102,543
144
$105,460
22
$37,614
2
$85,345
4
$26,590
APPLICATIONS WITHDRAWN
1
$100,000
10
$87,134
74
$122,942
12
$131,629
3
$69,210
3
$94,333
FILES CLOSED FOR INCOMPLETENESS
0
$0
4
$120,248
26
$111,902
1
$5,000
0
$0
0
$0
Aggregated Statistics For Year 2004 (Based on 1 full and 2 partial tracts)
A) FHA, FSA/RHS & VA Home Purchase Loans
B) Conventional Home Purchase Loans
C) Refinancings
D) Home Improvement Loans
F) Non-occupant Loans on < 5 Family Dwellings (A B C & D)
G) Loans On Manufactured Home Dwelling (A B C & D)
Number
Average Value
Number
Average Value
Number
Average Value
Number
Average Value
Number
Average Value
Number
Average Value
LOANS ORIGINATED
22
$119,728
78
$105,122
137
$101,534
15
$65,753
15
$118,993
2
$18,955
APPLICATIONS APPROVED, NOT ACCEPTED
1
$136,160
8
$104,164
35
$108,011
1
$53,550
2
$100,050
0
$0
APPLICATIONS DENIED
4
$108,360
18
$106,676
123
$106,737
18
$18,165
4
$82,148
4
$40,520
APPLICATIONS WITHDRAWN
8
$136,515
6
$117,515
62
$110,039
6
$62,102
4
$57,922
0
$0
FILES CLOSED FOR INCOMPLETENESS
0
$0
2
$102,475
13
$112,166
0
$0
0
$0
0
$0
Aggregated Statistics For Year 2003 (Based on 1 full and 2 partial tracts)
A) FHA, FSA/RHS & VA Home Purchase Loans
B) Conventional Home Purchase Loans
C) Refinancings
D) Home Improvement Loans
F) Non-occupant Loans on < 5 Family Dwellings (A B C & D)
Number
Average Value
Number
Average Value
Number
Average Value
Number
Average Value
Number
Average Value
LOANS ORIGINATED
27
$115,903
54
$96,935
238
$97,263
10
$17,045
19
$86,819
APPLICATIONS APPROVED, NOT ACCEPTED
1
$142,000
11
$71,602
41
$95,356
6
$20,565
2
$60,910
APPLICATIONS DENIED
1
$124,310
8
$82,525
112
$99,183
18
$16,046
3
$118,020
APPLICATIONS WITHDRAWN
3
$86,647
6
$79,942
74
$108,186
4
$42,995
4
$102,248
FILES CLOSED FOR INCOMPLETENESS
0
$0
2
$104,435
19
$111,188
1
$34,000
1
$87,000
Aggregated Statistics For Year 2002 (Based on 1 full and 1 partial tracts)
A) FHA, FSA/RHS & VA Home Purchase Loans
B) Conventional Home Purchase Loans
C) Refinancings
D) Home Improvement Loans
F) Non-occupant Loans on < 5 Family Dwellings (A B C & D)
Number
Average Value
Number
Average Value
Number
Average Value
Number
Average Value
Number
Average Value
LOANS ORIGINATED
19
$108,781
36
$90,374
137
$95,334
14
$22,663
13
$72,339
APPLICATIONS APPROVED, NOT ACCEPTED
1
$81,490
3
$51,710
36
$87,577
9
$14,839
1
$40,860
APPLICATIONS DENIED
0
$0
6
$61,307
73
$88,277
13
$9,176
4
$82,625
APPLICATIONS WITHDRAWN
1
$86,000
3
$96,480
45
$97,192
1
$15,990
0
$0
FILES CLOSED FOR INCOMPLETENESS
2
$96,000
1
$49,850
15
$101,152
0
$0
0
$0
Aggregated Statistics For Year 2001 (Based on 1 full and 1 partial tracts)
A) FHA, FSA/RHS & VA Home Purchase Loans
B) Conventional Home Purchase Loans
C) Refinancings
D) Home Improvement Loans
F) Non-occupant Loans on < 5 Family Dwellings (A B C & D)
Number
Average Value
Number
Average Value
Number
Average Value
Number
Average Value
Number
Average Value
LOANS ORIGINATED
21
$107,792
47
$94,345
149
$87,701
22
$12,470
10
$72,482
APPLICATIONS APPROVED, NOT ACCEPTED
0
$0
5
$77,696
26
$87,791
5
$21,494
0
$0
APPLICATIONS DENIED
1
$139,000
5
$91,614
99
$94,393
16
$12,562
7
$118,160
APPLICATIONS WITHDRAWN
2
$59,885
4
$84,205
57
$92,445
3
$35,077
4
$86,000
FILES CLOSED FOR INCOMPLETENESS
1
$62,000
2
$112,700
11
$95,291
0
$0
0
$0
Aggregated Statistics For Year 2000 (Based on 1 full and 1 partial tracts)
A) FHA, FSA/RHS & VA Home Purchase Loans
B) Conventional Home Purchase Loans
C) Refinancings
D) Home Improvement Loans
F) Non-occupant Loans on < 5 Family Dwellings (A B C & D)
Number
Average Value
Number
Average Value
Number
Average Value
Number
Average Value
Number
Average Value
LOANS ORIGINATED
27
$92,415
22
$82,240
70
$76,261
17
$14,251
4
$61,125
APPLICATIONS APPROVED, NOT ACCEPTED
0
$0
10
$48,027
18
$71,200
7
$11,447
1
$49,440
APPLICATIONS DENIED
2
$136,460
10
$50,741
63
$77,931
7
$19,451
4
$56,488
APPLICATIONS WITHDRAWN
1
$123,610
2
$107,390
19
$81,117
2
$23,760
0
$0
FILES CLOSED FOR INCOMPLETENESS
0
$0
1
$71,000
5
$87,850
0
$0
0
$0
Aggregated Statistics For Year 1999 (Based on 1 full and 2 partial tracts)
A) FHA, FSA/RHS & VA Home Purchase Loans
B) Conventional Home Purchase Loans
C) Refinancings
D) Home Improvement Loans
F) Non-occupant Loans on < 5 Family Dwellings (A B C & D)
#3 on the list of "Top 101 cities with the highest percentage of English-only speaking households, population 5,000+"
#79 on the list of "Top 101 cities that people commute from (largest negative percentage daily daytime population change due to commuting) (population 5,000+)"
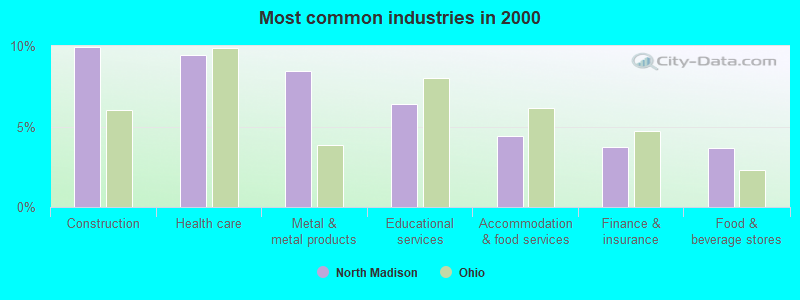
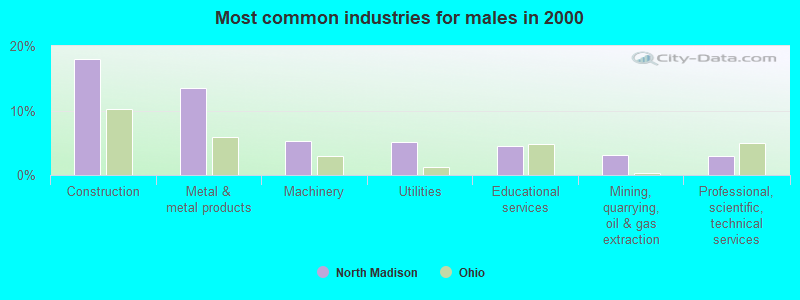
#100 on the list of "Top 101 cities with largest percentage of males in industries: manufacturing (population 5,000+)"
#63 on the list of "Top 101 counties with the largest number of people without health insurance coverage in 2000 (pop. 50,000+)"
#66 on the list of "Top 101 counties with the lowest number of births per 1000 residents 2007-2013"
#84 on the list of "Top 101 counties with the lowest percentage of residents relocating to foreign countries in 2011"
#86 on the list of "Top 101 counties with the lowest percentage of residents relocating to other counties in 2011 (pop. 50,000+)"
#95 on the list of "Top 101 counties with the largest increase in the number of deaths per 1000 residents 2000-2006 to 2007-2013 (pop. 50,000+)"


 Recent articles from our blog. Our writers, many of them Ph.D. graduates or candidates, create easy-to-read articles on a wide variety of topics.

 (17.6 miles