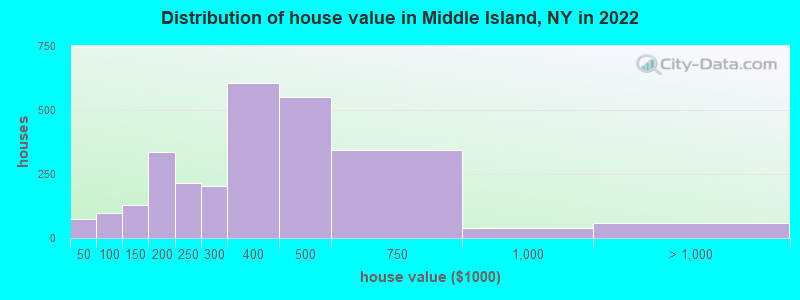
Estimated median house or condo value in 2022: $358,797 (it was $130,700 in 2000)
Middle Island:
$358,797
NY:
$400,400
Mean prices in 2022:all housing units: $367,298; detached houses: $464,735; townhouses or other attached units: $289,560; in 2-unit structures: $191,383; in 3-to-4-unit structures: $269,843; in 5-or-more-unit structures: $131,200
Median gross rent in 2022: $1,793.
March 2022 cost of living index in Middle Island: 149.1 (very high, U.S. average is 100)
Percentage of residents living in poverty in 2022: 10.8%
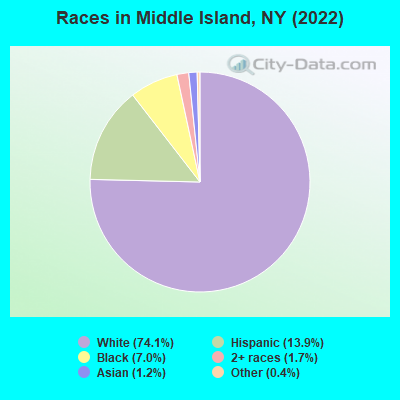
(8.1% for White Non-Hispanic residents, 30.8% for Black residents, 14.5% for Hispanic or Latino residents, 100.0% for American Indian residents, 1.7% for other race residents, 24.6% for two or more races residents)
Latest news from Middle Island, NY collected exclusively by city-data.com from local newspapers, TV, and radio stations
Ancestries: Italian (30.2%), American (17.1%), Polish (6.7%), German (5.4%), Irish (4.1%), English (1.8%).
Current Local Time: EST time zone
Elevation: 80 feet
Land area: 8.25 square miles.
Population density: 1,271 people per square mile (low).
1,198 residents are foreign born (6.1% Latin America, 3.1% Europe, 1.2% Asia).
This place:
11.2%
New York:
22.6%
Median real estate property taxes paid for housing units with mortgages in 2022: $8,295 (2.2%) Median real estate property taxes paid for housing units with no mortgage in 2022: $6,605 (2.0%)
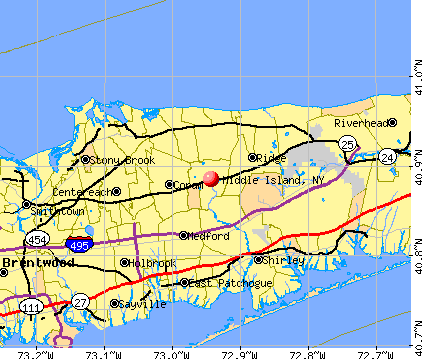
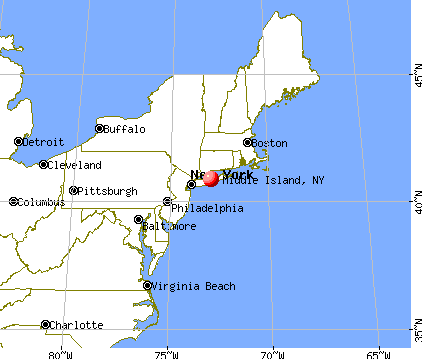
Nearest city with pop. 50,000+: Brentwood, NY (17.3 miles , pop. 53,917).
Nearest city with pop. 200,000+: North Hempstead, NY (38.6 miles , pop. 222,611).
Nearest city with pop. 1,000,000+: Queens, NY (47.4 miles , pop. 2,229,379).
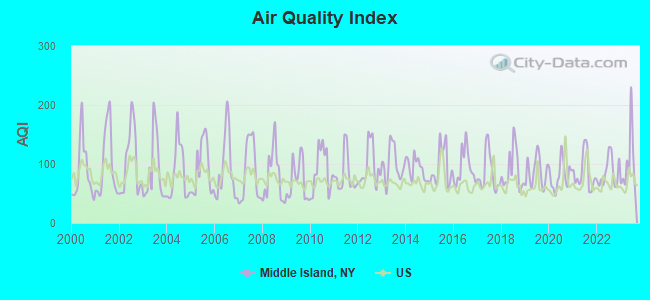
Air Quality Index (AQI) level in 2023 was 101. This is worse than average.
City:
101
U.S.:
73
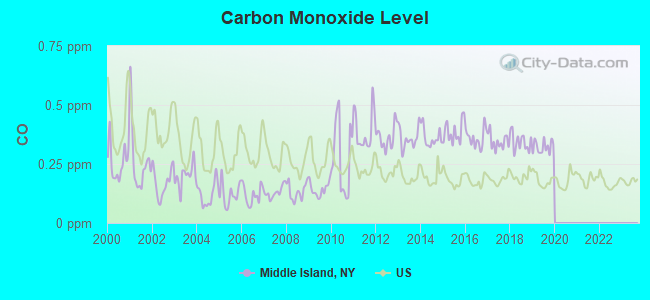
Carbon Monoxide (CO) [ppm] level in 2019 was 0.322. This is worse than average.Closest monitor was 7.2 miles away from the city center.
City:
0.322
U.S.:
0.251
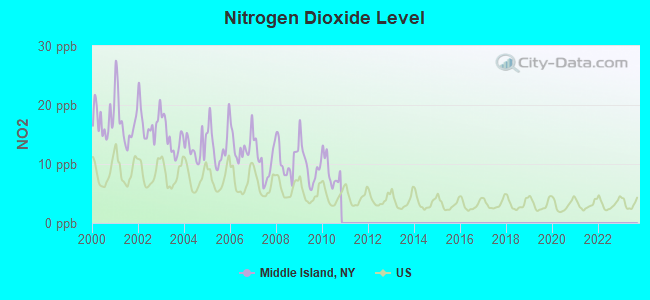
Nitrogen Dioxide (NO2) [ppb] level in 2010 was 8.78. This is significantly worse than average.Closest monitor was 7.2 miles away from the city center.
City:
8.78
U.S.:
5.11
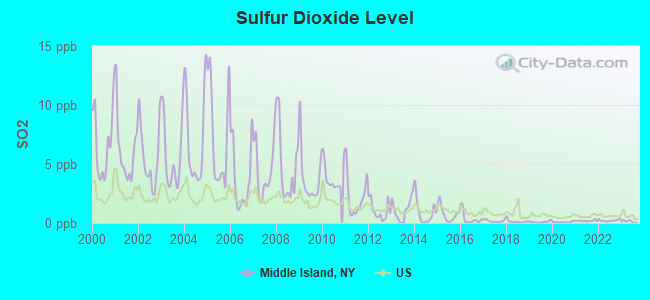
Sulfur Dioxide (SO2) [ppb] level in 2022 was 0.221. This is significantly better than average.Closest monitor was 7.0 miles away from the city center.
City:
0.221
U.S.:
1.515
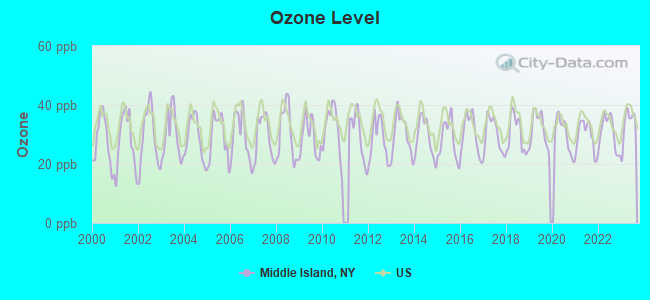
Ozone [ppb] level in 2023 was 33.8. This is about average.Closest monitor was 7.2 miles away from the city center.
City:
33.8
U.S.:
33.3
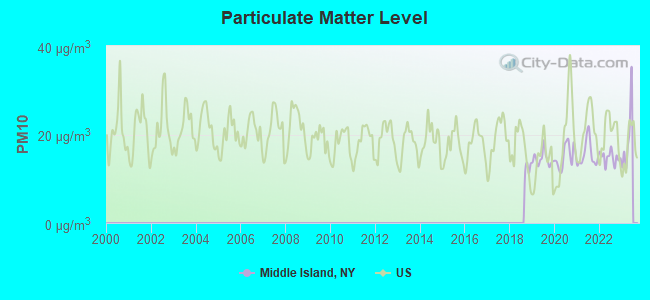
Particulate Matter (PM10) [µg/m3] level in 2022 was 14.8. This is better than average.Closest monitor was 23.1 miles away from the city center.
City:
14.8
U.S.:
19.2
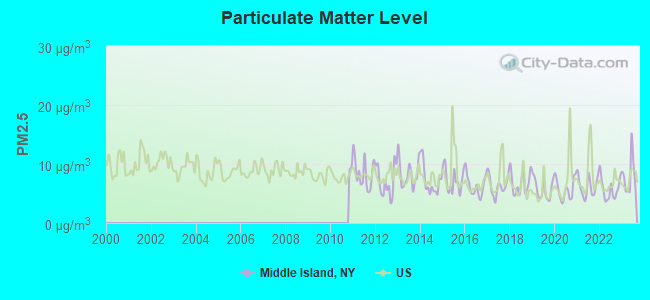
Particulate Matter (PM2.5) [µg/m3] level in 2023 was 7.98. This is about average.Closest monitor was 23.7 miles away from the city center.
City:
7.98
U.S.:
8.11
Tornado activity:
Middle Island-area historical tornado activity is near New York state average. It is 60% smaller than the overall U.S. average.
On 7/10/1989, a category F4 (max. wind speeds 207-260 mph) tornado 30.1 miles away from the Middle Island place center injured 40 peopleand causedbetween $50,000,000 and $500,000,000 in damages.
On 7/10/1989, a category F2 (max. wind speeds 113-157 mph) tornado 9.7 miles away from the place center injured one person.
Earthquake activity:
Middle Island-area historical earthquake activity is significantly above New York state average. It is 71% smaller than the overall U.S. average.
On 10/7/1983 at 10:18:46, a magnitude 5.3 (5.1 MB, 5.3 LG, 5.1 ML, Class: Moderate, Intensity: VI - VII) earthquake occurred 223.9 miles away from Middle Island center On 8/23/2011 at 17:51:04, a magnitude 5.8 (5.8 MW, Depth: 3.7 mi) earthquake occurred 336.9 miles away from Middle Island center On 4/20/2002 at 10:50:47, a magnitude 5.3 (5.3 ML, Depth: 3.0 mi) earthquake occurred 253.8 miles away from Middle Island center On 4/20/2002 at 10:50:47, a magnitude 5.2 (5.2 MB, 4.2 MS, 5.2 MW, 5.0 MW) earthquake occurred 252.2 miles away from the city center On 8/22/1992 at 12:20:32, a magnitude 4.8 (4.8 MB, 3.8 MS, 4.7 LG, Depth: 6.2 mi, Class: Light, Intensity: IV - V) earthquake occurred 185.7 miles away from the city center On 1/16/1994 at 01:49:16, a magnitude 4.6 (4.6 MB, 4.6 LG, Depth: 3.1 mi) earthquake occurred 166.9 miles away from Middle Island center Magnitude types: regional Lg-wave magnitude (LG), body-wave magnitude (MB), local magnitude (ML), surface-wave magnitude (MS), moment magnitude (MW)
Natural disasters:
The number of natural disasters in Suffolk County (28) is a lot greater than the US average (15). Major Disasters (Presidential) Declared: 19 Emergencies Declared: 7
Causes of natural disasters: Hurricanes: 9, Floods: 7, Storms: 7, Snowstorms: 4, Winter Storms: 3, Blizzards: 2, Heavy Rain: 1, Power Outage: 1, Tropical Depression: 1, Tropical Storm: 1, Water Shortage: 1, Other: 3 (Note: some incidents may be assigned to more than one category).
Hospitals and medical centers in Middle Island:
FREE, INC (29 CORAM SWEEZYTOWN RD)
INDEPENDENT GROUP HOME LIVING PROGRAM, INC (29 LONGWOOD RD)
CREST HALL HEALTH RELATED (OAKCREST AVE CHURCH LANE)
LAKEVIEW REHABILITATION AND CARE CENTER (63 OAKCREST AVENUE)
OAK HOLLOW NURSING CENTER (49 OAKCREST AVE)
Colleges/universities with over 2000 students nearest to Middle Island:
Suffolk County Community College (about 7 miles; Selden, NY; Full-time enrollment: 18,540)
Stony Brook University (about 10 miles; Stony Brook, NY; FT enrollment: 22,071)
Dowling College (about 16 miles; Oakdale, NY; FT enrollment: 2,598)
Porter and Chester Institute of Stratford (about 23 miles; Stratford, CT; FT enrollment: 2,822)
University of Bridgeport (about 24 miles; Bridgeport, CT; FT enrollment: 3,708)
Housatonic Community College (about 24 miles; Bridgeport, CT; FT enrollment: 3,677)
Fairfield University (about 26 miles; Fairfield, CT; FT enrollment: 4,640)
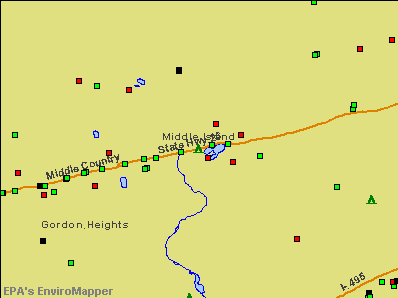
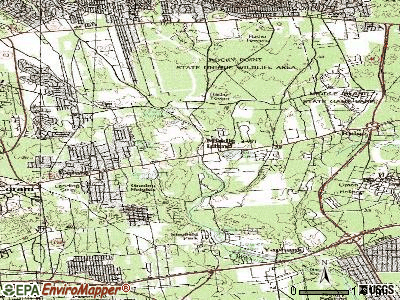
Notable locations in Middle Island: Camp Wilderness (A), Longwood Public Library (B), Crest Hall Care Center (C), Oak Hollow Nursing Center (D), Middle Island Fire Department (E). Display/hide their locations on the map
Birthplace of: Nicole Kaczmarski - WNBA player (Los Angeles Sparks, born: Apr 30, 1981).
Suffolk County has a predicted average indoor radon screening level less than 2 pCi/L (pico curies per liter) - Low Potential
Drinking water stations with addresses in Middle Island and their reported violations in the past:
MIDDLE ISLAND COUNTRY CLUB (Population served: 1,000, Groundwater):
Past health violations:
MCL, Monthly (TCR) - In JUL-2013, Contaminant: Coliform. Follow-up actions: St Public Notif requested (JUL-29-2013), St Formal NOV issued (JUL-29-2013), St Compliance achieved (AUG-21-2013)
MCL, Monthly (TCR) - Between JUL-2007 and SEP-2007, Contaminant: Coliform. Follow-up actions: St Public Notif requested (SEP-07-2007), St Formal NOV issued (SEP-07-2007), St Compliance achieved (JAN-29-2008)
Likely homosexual households (counted as self-reported same-sex unmarried-partner households)
Lesbian couples: 0.6% of all households
Gay men: 0.5% of all households
People in group quarters in Middle Island in 2010:
265 people in nursing facilities/skilled-nursing facilities
38 people in group homes intended for adults
18 people in emergency and transitional shelters (with sleeping facilities) for people experiencing homelessness
People in group quarters in Middle Island in 2000:
159 people in nursing homes
123 people in other noninstitutional group quarters
11 people in homes for the mentally retarded
Banks with branches in Middle Island (2011 data):
The Suffolk County National Bank of Riverhead: Middle Island Branch at 900 Middle Country Road, branch established on 2008/04/14. Info updated 2012/01/10: Bank assets: $1,483.9 mil, Deposits: $1,312.3 mil, headquarters in Riverhead, NY, positive income, Commercial Lending Specialization, 30 total offices, Holding Company: Suffolk Bancorp
Astoria Federal Savings and Loan Association: Middle Island Branch at 599 Middle Country Rd, branch established on 1923/01/01. Info updated 2011/07/21: Bank assets: $16,975.1 mil, Deposits: $11,426.8 mil, headquarters in Long Island City, NY, positive income, Mortgage Lending Specialization, 86 total offices
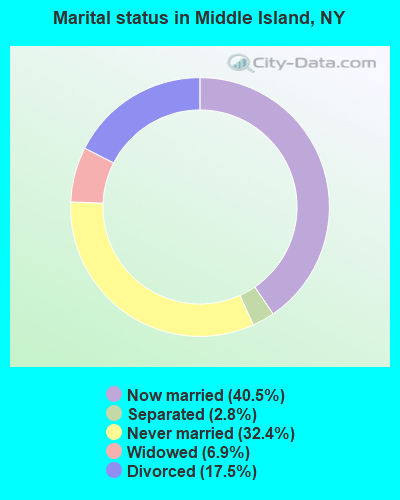
For population 15 years and over in Middle Island:
Never married: 32.4%
Now married: 40.5%
Separated: 2.8%
Widowed: 6.9%
Divorced: 17.5%
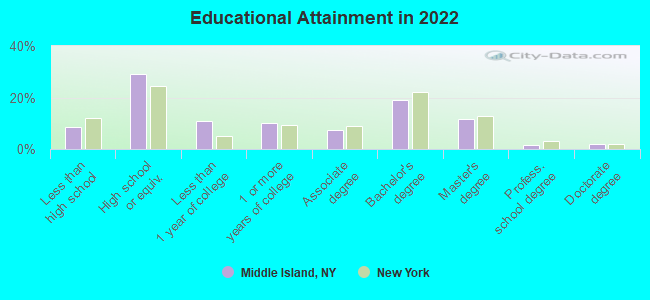
For population 25 years and over in Middle Island:
Religion statistics for Middle Island, NY (based on Suffolk County data)
Religion
Adherents
Congregations
Catholic
879,457
75
Mainline Protestant
69,205
182
Evangelical Protestant
58,909
264
Other
50,771
124
Orthodox
10,190
10
Black Protestant
8,298
49
None
416,520
-
Source: Clifford Grammich, Kirk Hadaway, Richard Houseal, Dale E.Jones, Alexei Krindatch, Richie Stanley and Richard H.Taylor. 2012. 2010 U.S.Religion Census: Religious Congregations & Membership Study. Association of Statisticians of American Religious Bodies. Jones, Dale E., et al. 2002. Congregations and Membership in the United States 2000. Nashville, TN: Glenmary Research Center. Graphs represent county-level data
Aircraft: TIGER AIRCRAFT LLC AG-5B (Category: Land, Seats: 4, Weight: Up to 12,499 Pounds), Engine: LYCOMING O-360 SERIES (180 HP) (Reciprocating) N-Number: 2848, N2848, N-2848, Serial Number: 10207, Year manufactured: 2002, Airworthiness Date: 07/05/2002, Certificate Issue Date: 11/06/2013 Registrant (Individual): John Picerno, Po Box 398, Middle Island, NY 11953
Aircraft: PIPER PA-22-135 (Category: Land, Seats: 4, Weight: Up to 12,499 Pounds, Speed: 94 mph), Engine: LYCOMING 0-290 SERIES (140 HP) (Reciprocating) N-Number: 8637C, N8637C, N-8637C, Serial Number: 22-1310, Year manufactured: 1953, Airworthiness Date: 03/31/1956, Certificate Issue Date: 07/30/1996 Registrant (Individual): John M Lamphere, 24 White Oak St, Middle Island, NY 11953
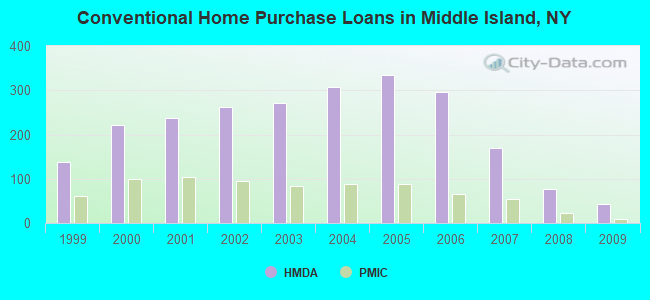
Home Mortgage Disclosure Act Aggregated Statistics For Year 2009 (Based on 3 full tracts)
A) FHA, FSA/RHS & VA Home Purchase Loans
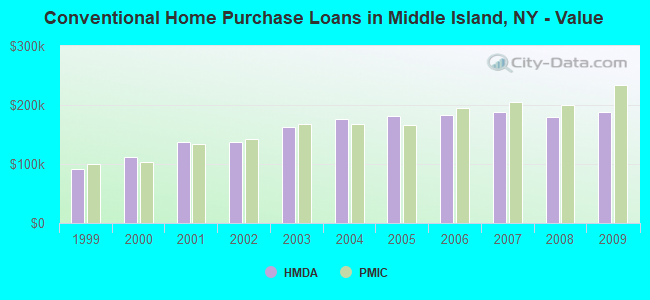
B) Conventional Home Purchase Loans
C) Refinancings
D) Home Improvement Loans
F) Non-occupant Loans on < 5 Family Dwellings (A B C & D)
Number
Average Value
Number
Average Value
Number
Average Value
Number
Average Value
Number
Average Value
LOANS ORIGINATED
42
$234,381
44
$187,614
124
$206,008
3
$74,333
7
$144,286
APPLICATIONS APPROVED, NOT ACCEPTED
3
$164,667
5
$127,600
15
$226,867
3
$70,667
1
$129,000
APPLICATIONS DENIED
6
$278,667
18
$120,667
70
$220,057
12
$42,333
3
$155,667
APPLICATIONS WITHDRAWN
12
$225,583
8
$139,500
50
$233,660
1
$70,000
2
$104,000
FILES CLOSED FOR INCOMPLETENESS
0
$0
4
$278,250
13
$191,923
0
$0
2
$60,500
Aggregated Statistics For Year 2008 (Based on 3 full tracts)
A) FHA, FSA/RHS & VA Home Purchase Loans
B) Conventional Home Purchase Loans
C) Refinancings
D) Home Improvement Loans
E) Loans on Dwellings For 5+ Families
F) Non-occupant Loans on < 5 Family Dwellings (A B C & D)
G) Loans On Manufactured Home Dwelling (A B C & D)
Number
Average Value
Number
Average Value
Number
Average Value
Number
Average Value
Number
Average Value
Number
Average Value
Number
Average Value
LOANS ORIGINATED
38
$226,842
77
$180,247
88
$176,057
23
$73,478
1
$193,000
8
$129,000
1
$48,000
APPLICATIONS APPROVED, NOT ACCEPTED
3
$176,667
16
$167,562
23
$179,565
0
$0
0
$0
1
$95,000
0
$0
APPLICATIONS DENIED
5
$264,000
29
$198,621
81
$238,383
26
$52,192
0
$0
5
$171,200
0
$0
APPLICATIONS WITHDRAWN
4
$196,500
9
$177,556
49
$246,429
6
$75,500
0
$0
0
$0
0
$0
FILES CLOSED FOR INCOMPLETENESS
0
$0
6
$194,167
14
$222,857
0
$0
0
$0
0
$0
0
$0
Aggregated Statistics For Year 2007 (Based on 3 full tracts)
A) FHA, FSA/RHS & VA Home Purchase Loans
B) Conventional Home Purchase Loans
C) Refinancings
D) Home Improvement Loans
F) Non-occupant Loans on < 5 Family Dwellings (A B C & D)
Number
Average Value
Number
Average Value
Number
Average Value
Number
Average Value
Number
Average Value
LOANS ORIGINATED
7
$249,286
170
$187,476
172
$207,052
43
$90,047
11
$190,182
APPLICATIONS APPROVED, NOT ACCEPTED
0
$0
17
$212,529
43
$222,279
14
$106,714
1
$257,000
APPLICATIONS DENIED
2
$316,500
68
$195,441
158
$246,146
43
$84,884
4
$127,000
APPLICATIONS WITHDRAWN
2
$167,000
20
$291,600
77
$221,961
6
$94,500
2
$228,000
FILES CLOSED FOR INCOMPLETENESS
0
$0
4
$233,250
28
$236,714
2
$55,000
0
$0
Aggregated Statistics For Year 2006 (Based on 3 full tracts)
A) FHA, FSA/RHS & VA Home Purchase Loans
B) Conventional Home Purchase Loans
C) Refinancings
D) Home Improvement Loans
E) Loans on Dwellings For 5+ Families
F) Non-occupant Loans on < 5 Family Dwellings (A B C & D)
G) Loans On Manufactured Home Dwelling (A B C & D)
Number
Average Value
Number
Average Value
Number
Average Value
Number
Average Value
Number
Average Value
Number
Average Value
Number
Average Value
LOANS ORIGINATED
4
$236,000
297
$183,178
258
$198,322
48
$119,854
1
$750,000
15
$247,533
2
$47,000
APPLICATIONS APPROVED, NOT ACCEPTED
0
$0
32
$184,531
41
$220,098
6
$41,333
0
$0
3
$75,333
0
$0
APPLICATIONS DENIED
0
$0
68
$227,515
166
$241,398
27
$97,444
0
$0
6
$220,167
0
$0
APPLICATIONS WITHDRAWN
3
$214,333
28
$212,286
95
$238,295
15
$218,200
0
$0
7
$188,000
0
$0
FILES CLOSED FOR INCOMPLETENESS
0
$0
13
$198,462
50
$255,520
2
$70,000
0
$0
1
$272,000
0
$0
Aggregated Statistics For Year 2005 (Based on 3 full tracts)
A) FHA, FSA/RHS & VA Home Purchase Loans
B) Conventional Home Purchase Loans
C) Refinancings
D) Home Improvement Loans
F) Non-occupant Loans on < 5 Family Dwellings (A B C & D)
Number
Average Value
Number
Average Value
Number
Average Value
Number
Average Value
Number
Average Value
LOANS ORIGINATED
3
$182,000
335
$181,600
330
$189,542
39
$82,846
39
$159,795
APPLICATIONS APPROVED, NOT ACCEPTED
0
$0
36
$166,167
67
$205,761
10
$39,500
6
$88,833
APPLICATIONS DENIED
1
$263,000
84
$179,250
167
$225,329
37
$61,892
10
$216,100
APPLICATIONS WITHDRAWN
0
$0
50
$234,600
138
$229,254
19
$205,368
10
$197,900
FILES CLOSED FOR INCOMPLETENESS
0
$0
24
$218,083
75
$233,907
2
$52,500
3
$145,667
Aggregated Statistics For Year 2004 (Based on 3 full tracts)
A) FHA, FSA/RHS & VA Home Purchase Loans
B) Conventional Home Purchase Loans
C) Refinancings
D) Home Improvement Loans
E) Loans on Dwellings For 5+ Families
F) Non-occupant Loans on < 5 Family Dwellings (A B C & D)
G) Loans On Manufactured Home Dwelling (A B C & D)
Number
Average Value
Number
Average Value
Number
Average Value
Number
Average Value
Number
Average Value
Number
Average Value
Number
Average Value
LOANS ORIGINATED
6
$158,500
308
$175,909
391
$167,146
76
$91,408
1
$3,800,000
31
$133,258
3
$18,667
APPLICATIONS APPROVED, NOT ACCEPTED
1
$212,000
40
$171,875
83
$182,470
10
$78,700
0
$0
5
$158,800
0
$0
APPLICATIONS DENIED
2
$125,500
71
$196,944
150
$201,740
48
$84,438
0
$0
10
$157,600
1
$19,000
APPLICATIONS WITHDRAWN
0
$0
30
$192,700
151
$168,834
16
$94,500
0
$0
6
$152,833
0
$0
FILES CLOSED FOR INCOMPLETENESS
1
$252,000
12
$218,750
77
$201,273
7
$64,714
0
$0
4
$130,000
0
$0
Aggregated Statistics For Year 2003 (Based on 3 full tracts)
A) FHA, FSA/RHS & VA Home Purchase Loans
B) Conventional Home Purchase Loans
C) Refinancings
D) Home Improvement Loans
E) Loans on Dwellings For 5+ Families
F) Non-occupant Loans on < 5 Family Dwellings (A B C & D)
Number
Average Value
Number
Average Value
Number
Average Value
Number
Average Value
Number
Average Value
Number
Average Value
LOANS ORIGINATED
22
$188,227
271
$162,893
654
$146,601
51
$45,529
1
$24,000,000
37
$110,324
APPLICATIONS APPROVED, NOT ACCEPTED
3
$126,333
32
$193,281
112
$149,268
10
$40,200
0
$0
2
$166,000
APPLICATIONS DENIED
3
$127,333
60
$150,867
227
$156,868
37
$28,919
0
$0
5
$103,600
APPLICATIONS WITHDRAWN
2
$167,500
37
$189,568
163
$143,362
11
$31,636
0
$0
1
$270,000
FILES CLOSED FOR INCOMPLETENESS
0
$0
9
$125,444
30
$160,433
4
$59,250
0
$0
2
$137,000
Aggregated Statistics For Year 2002 (Based on 3 full tracts)
A) FHA, FSA/RHS & VA Home Purchase Loans
B) Conventional Home Purchase Loans
C) Refinancings
D) Home Improvement Loans
F) Non-occupant Loans on < 5 Family Dwellings (A B C & D)
Number
Average Value
Number
Average Value
Number
Average Value
Number
Average Value
Number
Average Value
LOANS ORIGINATED
35
$130,514
262
$137,057
380
$124,689
59
$35,424
18
$101,333
APPLICATIONS APPROVED, NOT ACCEPTED
2
$161,500
34
$138,147
79
$117,316
11
$27,818
1
$100,000
APPLICATIONS DENIED
4
$157,500
56
$109,625
130
$121,677
30
$33,400
11
$84,182
APPLICATIONS WITHDRAWN
5
$121,200
31
$125,323
107
$110,953
11
$24,000
5
$116,400
FILES CLOSED FOR INCOMPLETENESS
2
$49,000
9
$119,556
52
$138,923
0
$0
2
$141,500
Aggregated Statistics For Year 2001 (Based on 3 full tracts)
A) FHA, FSA/RHS & VA Home Purchase Loans
B) Conventional Home Purchase Loans
C) Refinancings
D) Home Improvement Loans
F) Non-occupant Loans on < 5 Family Dwellings (A B C & D)
Number
Average Value
Number
Average Value
Number
Average Value
Number
Average Value
Number
Average Value
LOANS ORIGINATED
67
$130,328
237
$136,840
237
$116,802
42
$34,143
12
$185,083
APPLICATIONS APPROVED, NOT ACCEPTED
4
$143,500
36
$144,972
56
$97,429
11
$45,545
2
$174,000
APPLICATIONS DENIED
4
$125,500
50
$99,340
146
$101,274
41
$23,829
9
$63,333
APPLICATIONS WITHDRAWN
12
$124,667
34
$133,882
115
$110,626
17
$26,118
2
$63,500
FILES CLOSED FOR INCOMPLETENESS
1
$177,000
5
$124,200
29
$145,241
1
$10,000
3
$104,667
Aggregated Statistics For Year 2000 (Based on 3 full tracts)
A) FHA, FSA/RHS & VA Home Purchase Loans
B) Conventional Home Purchase Loans
C) Refinancings
D) Home Improvement Loans
E) Loans on Dwellings For 5+ Families
F) Non-occupant Loans on < 5 Family Dwellings (A B C & D)
Number
Average Value
Number
Average Value
Number
Average Value
Number
Average Value
Number
Average Value
Number
Average Value
LOANS ORIGINATED
59
$117,237
221
$111,570
77
$81,532
38
$22,026
1
$15,000,000
7
$69,857
APPLICATIONS APPROVED, NOT ACCEPTED
3
$100,333
25
$130,640
19
$93,526
17
$24,706
0
$0
1
$67,000
APPLICATIONS DENIED
6
$120,500
54
$114,241
82
$82,390
47
$29,766
0
$0
3
$84,000
APPLICATIONS WITHDRAWN
8
$120,375
17
$92,588
65
$85,231
7
$38,571
0
$0
1
$90,000
FILES CLOSED FOR INCOMPLETENESS
0
$0
8
$92,250
7
$258,714
3
$17,667
0
$0
0
$0
Aggregated Statistics For Year 1999 (Based on 3 full tracts)
A) FHA, FSA/RHS & VA Home Purchase Loans
B) Conventional Home Purchase Loans
C) Refinancings
D) Home Improvement Loans
F) Non-occupant Loans on < 5 Family Dwellings (A B C & D)
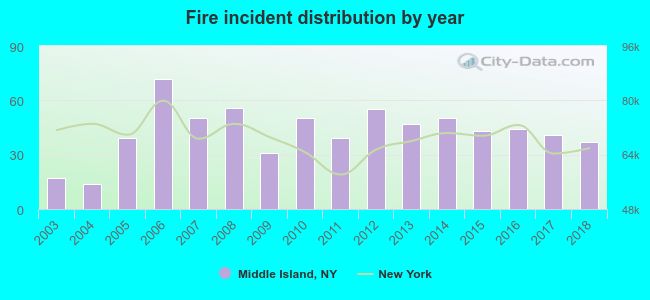
2003 - 2018 National Fire Incident Reporting System (NFIRS) incidents
According to the data from the years 2003 - 2018 the average number of fire incidents per year is 43. The highest number of reported fires - 72 took place in 2006, and the least - 14 in 2004. The data has a growing trend.
When looking into fire subcategories, the most reports belonged to: Outside Fires (46.9%), and Structure Fires (36.6%).
Fire incident types reported to NFIRS in Middle Island, NY


 Recent articles from our blog. Our writers, many of them Ph.D. graduates or candidates, create easy-to-read articles on a wide variety of topics.

 (17.3 miles
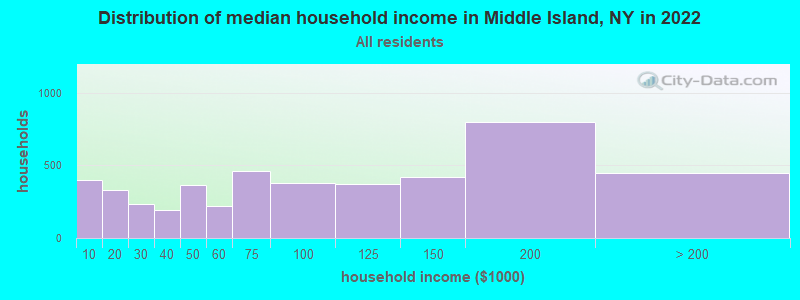


 According to the data from the years 2003 - 2018 the average number of fire incidents per year is 43. The highest number of reported fires - 72 took place in 2006, and the least - 14 in 2004. The data has a growing trend.
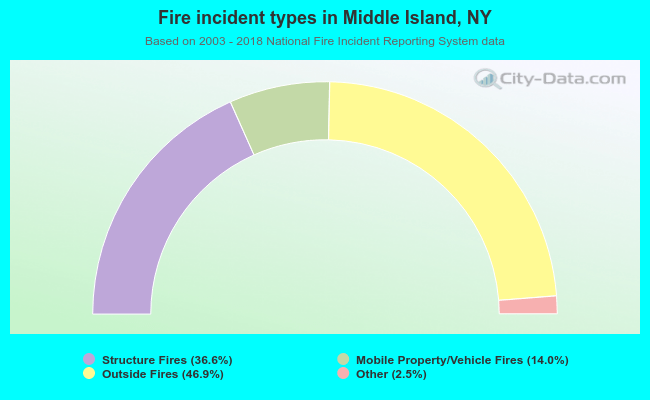 When looking into fire subcategories, the most reports belonged to: Outside Fires (46.9%), and Structure Fires (36.6%).