Keizer, Oregon Submit your own pictures of this city and show them to the world
OSM Map
General Map
Google Map
MSN Map
OSM Map
General Map
Google Map
MSN Map
OSM Map
General Map
Google Map
MSN Map
OSM Map
General Map
Google Map
MSN Map
Please wait while loading the map...
Population in 2022: 38,704 (100% urban, 0% rural). Population change since 2000: +20.2%Males: 17,926 Females: 20,778
March 2022 cost of living index in Keizer: 97.0 (near average, U.S. average is 100) Percentage of residents living in poverty in 2022: 9.4%for White Non-Hispanic residents , 25.7% for Black residents , 9.9% for Hispanic or Latino residents , 2.5% for American Indian residents , 14.3% for Native Hawaiian and other Pacific Islander residents , 20.4% for other race residents , 8.4% for two or more races residents )
Profiles of local businesses
Business Search - 14 Million verified businesses
Data:
Median household income ($)
Median household income (% change since 2000)
Household income diversity
Ratio of average income to average house value (%)
Ratio of average income to average rent
Median household income ($) - White
Median household income ($) - Black or African American
Median household income ($) - Asian
Median household income ($) - Hispanic or Latino
Median household income ($) - American Indian and Alaska Native
Median household income ($) - Multirace
Median household income ($) - Other Race
Median household income for houses/condos with a mortgage ($)
Median household income for apartments without a mortgage ($)
Races - White alone (%)
Races - White alone (% change since 2000)
Races - Black alone (%)
Races - Black alone (% change since 2000)
Races - American Indian alone (%)
Races - American Indian alone (% change since 2000)
Races - Asian alone (%)
Races - Asian alone (% change since 2000)
Races - Hispanic (%)
Races - Hispanic (% change since 2000)
Races - Native Hawaiian and Other Pacific Islander alone (%)
Races - Native Hawaiian and Other Pacific Islander alone (% change since 2000)
Races - Two or more races (%)
Races - Two or more races (% change since 2000)
Races - Other race alone (%)
Races - Other race alone (% change since 2000)
Racial diversity
Unemployment (%)
Unemployment (% change since 2000)
Unemployment (%) - White
Unemployment (%) - Black or African American
Unemployment (%) - Asian
Unemployment (%) - Hispanic or Latino
Unemployment (%) - American Indian and Alaska Native
Unemployment (%) - Multirace
Unemployment (%) - Other Race
Population density (people per square mile)
Population - Males (%)
Population - Females (%)
Population - Males (%) - White
Population - Males (%) - Black or African American
Population - Males (%) - Asian
Population - Males (%) - Hispanic or Latino
Population - Males (%) - American Indian and Alaska Native
Population - Males (%) - Multirace
Population - Males (%) - Other Race
Population - Females (%) - White
Population - Females (%) - Black or African American
Population - Females (%) - Asian
Population - Females (%) - Hispanic or Latino
Population - Females (%) - American Indian and Alaska Native
Population - Females (%) - Multirace
Population - Females (%) - Other Race
Coronavirus confirmed cases (Jun 05, 2024)
Deaths caused by coronavirus (Jun 05, 2024)
Coronavirus confirmed cases (per 100k population) (Jun 05, 2024)
Deaths caused by coronavirus (per 100k population) (Jun 05, 2024)
Daily increase in number of cases (Jun 05, 2024)
Weekly increase in number of cases (Jun 05, 2024)
Cases doubled (in days) (Jun 05, 2024)
Hospitalized patients (Apr 18, 2022)
Negative test results (Apr 18, 2022)
Total test results (Apr 18, 2022)
COVID Vaccine doses distributed (per 100k population) (Sep 19, 2023)
COVID Vaccine doses administered (per 100k population) (Sep 19, 2023)
COVID Vaccine doses distributed (Sep 19, 2023)
COVID Vaccine doses administered (Sep 19, 2023)
Likely homosexual households (%)
Likely homosexual households (% change since 2000)
Likely homosexual households - Lesbian couples (%)
Likely homosexual households - Lesbian couples (% change since 2000)
Likely homosexual households - Gay men (%)
Likely homosexual households - Gay men (% change since 2000)
Cost of living index
Median gross rent ($)
Median contract rent ($)
Median monthly housing costs ($)
Median house or condo value ($)
Median house or condo value ($ change since 2000)
Mean house or condo value by units in structure - 1, detached ($)
Mean house or condo value by units in structure - 1, attached ($)
Mean house or condo value by units in structure - 2 ($)
Mean house or condo value by units in structure by units in structure - 3 or 4 ($)
Mean house or condo value by units in structure - 5 or more ($)
Mean house or condo value by units in structure - Boat, RV, van, etc. ($)
Mean house or condo value by units in structure - Mobile home ($)
Median house or condo value ($) - White
Median house or condo value ($) - Black or African American
Median house or condo value ($) - Asian
Median house or condo value ($) - Hispanic or Latino
Median house or condo value ($) - American Indian and Alaska Native
Median house or condo value ($) - Multirace
Median house or condo value ($) - Other Race
Median resident age
Resident age diversity
Median resident age - Males
Median resident age - Females
Median resident age - White
Median resident age - Black or African American
Median resident age - Asian
Median resident age - Hispanic or Latino
Median resident age - American Indian and Alaska Native
Median resident age - Multirace
Median resident age - Other Race
Median resident age - Males - White
Median resident age - Males - Black or African American
Median resident age - Males - Asian
Median resident age - Males - Hispanic or Latino
Median resident age - Males - American Indian and Alaska Native
Median resident age - Males - Multirace
Median resident age - Males - Other Race
Median resident age - Females - White
Median resident age - Females - Black or African American
Median resident age - Females - Asian
Median resident age - Females - Hispanic or Latino
Median resident age - Females - American Indian and Alaska Native
Median resident age - Females - Multirace
Median resident age - Females - Other Race
Commute - mean travel time to work (minutes)
Travel time to work - Less than 5 minutes (%)
Travel time to work - Less than 5 minutes (% change since 2000)
Travel time to work - 5 to 9 minutes (%)
Travel time to work - 5 to 9 minutes (% change since 2000)
Travel time to work - 10 to 19 minutes (%)
Travel time to work - 10 to 19 minutes (% change since 2000)
Travel time to work - 20 to 29 minutes (%)
Travel time to work - 20 to 29 minutes (% change since 2000)
Travel time to work - 30 to 39 minutes (%)
Travel time to work - 30 to 39 minutes (% change since 2000)
Travel time to work - 40 to 59 minutes (%)
Travel time to work - 40 to 59 minutes (% change since 2000)
Travel time to work - 60 to 89 minutes (%)
Travel time to work - 60 to 89 minutes (% change since 2000)
Travel time to work - 90 or more minutes (%)
Travel time to work - 90 or more minutes (% change since 2000)
Marital status - Never married (%)
Marital status - Now married (%)
Marital status - Separated (%)
Marital status - Widowed (%)
Marital status - Divorced (%)
Median family income ($)
Median family income (% change since 2000)
Median non-family income ($)
Median non-family income (% change since 2000)
Median per capita income ($)
Median per capita income (% change since 2000)
Median family income ($) - White
Median family income ($) - Black or African American
Median family income ($) - Asian
Median family income ($) - Hispanic or Latino
Median family income ($) - American Indian and Alaska Native
Median family income ($) - Multirace
Median family income ($) - Other Race
Median year house/condo built
Median year apartment built
Year house built - Built 2005 or later (%)
Year house built - Built 2000 to 2004 (%)
Year house built - Built 1990 to 1999 (%)
Year house built - Built 1980 to 1989 (%)
Year house built - Built 1970 to 1979 (%)
Year house built - Built 1960 to 1969 (%)
Year house built - Built 1950 to 1959 (%)
Year house built - Built 1940 to 1949 (%)
Year house built - Built 1939 or earlier (%)
Average household size
Household density (households per square mile)
Average household size - White
Average household size - Black or African American
Average household size - Asian
Average household size - Hispanic or Latino
Average household size - American Indian and Alaska Native
Average household size - Multirace
Average household size - Other Race
Occupied housing units (%)
Vacant housing units (%)
Owner occupied housing units (%)
Renter occupied housing units (%)
Vacancy status - For rent (%)
Vacancy status - For sale only (%)
Vacancy status - Rented or sold, not occupied (%)
Vacancy status - For seasonal, recreational, or occasional use (%)
Vacancy status - For migrant workers (%)
Vacancy status - Other vacant (%)
Residents with income below the poverty level (%)
Residents with income below 50% of the poverty level (%)
Children below poverty level (%)
Poor families by family type - Married-couple family (%)
Poor families by family type - Male, no wife present (%)
Poor families by family type - Female, no husband present (%)
Poverty status for native-born residents (%)
Poverty status for foreign-born residents (%)
Poverty among high school graduates not in families (%)
Poverty among people who did not graduate high school not in families (%)
Residents with income below the poverty level (%) - White
Residents with income below the poverty level (%) - Black or African American
Residents with income below the poverty level (%) - Asian
Residents with income below the poverty level (%) - Hispanic or Latino
Residents with income below the poverty level (%) - American Indian and Alaska Native
Residents with income below the poverty level (%) - Multirace
Residents with income below the poverty level (%) - Other Race
Air pollution - Air Quality Index (AQI)
Air pollution - CO
Air pollution - NO2
Air pollution - SO2
Air pollution - Ozone
Air pollution - PM10
Air pollution - PM25
Air pollution - Pb
Crime - Murders per 100,000 population
Crime - Rapes per 100,000 population
Crime - Robberies per 100,000 population
Crime - Assaults per 100,000 population
Crime - Burglaries per 100,000 population
Crime - Thefts per 100,000 population
Crime - Auto thefts per 100,000 population
Crime - Arson per 100,000 population
Crime - City-data.com crime index
Crime - Violent crime index
Crime - Property crime index
Crime - Murders per 100,000 population (5 year average)
Crime - Rapes per 100,000 population (5 year average)
Crime - Robberies per 100,000 population (5 year average)
Crime - Assaults per 100,000 population (5 year average)
Crime - Burglaries per 100,000 population (5 year average)
Crime - Thefts per 100,000 population (5 year average)
Crime - Auto thefts per 100,000 population (5 year average)
Crime - Arson per 100,000 population (5 year average)
Crime - City-data.com crime index (5 year average)
Crime - Violent crime index (5 year average)
Crime - Property crime index (5 year average)
1996 Presidential Elections Results (%) - Democratic Party (Clinton)
1996 Presidential Elections Results (%) - Republican Party (Dole)
1996 Presidential Elections Results (%) - Other
2000 Presidential Elections Results (%) - Democratic Party (Gore)
2000 Presidential Elections Results (%) - Republican Party (Bush)
2000 Presidential Elections Results (%) - Other
2004 Presidential Elections Results (%) - Democratic Party (Kerry)
2004 Presidential Elections Results (%) - Republican Party (Bush)
2004 Presidential Elections Results (%) - Other
2008 Presidential Elections Results (%) - Democratic Party (Obama)
2008 Presidential Elections Results (%) - Republican Party (McCain)
2008 Presidential Elections Results (%) - Other
2012 Presidential Elections Results (%) - Democratic Party (Obama)
2012 Presidential Elections Results (%) - Republican Party (Romney)
2012 Presidential Elections Results (%) - Other
2016 Presidential Elections Results (%) - Democratic Party (Clinton)
2016 Presidential Elections Results (%) - Republican Party (Trump)
2016 Presidential Elections Results (%) - Other
2020 Presidential Elections Results (%) - Democratic Party (Biden)
2020 Presidential Elections Results (%) - Republican Party (Trump)
2020 Presidential Elections Results (%) - Other
Ancestries Reported - Arab (%)
Ancestries Reported - Czech (%)
Ancestries Reported - Danish (%)
Ancestries Reported - Dutch (%)
Ancestries Reported - English (%)
Ancestries Reported - French (%)
Ancestries Reported - French Canadian (%)
Ancestries Reported - German (%)
Ancestries Reported - Greek (%)
Ancestries Reported - Hungarian (%)
Ancestries Reported - Irish (%)
Ancestries Reported - Italian (%)
Ancestries Reported - Lithuanian (%)
Ancestries Reported - Norwegian (%)
Ancestries Reported - Polish (%)
Ancestries Reported - Portuguese (%)
Ancestries Reported - Russian (%)
Ancestries Reported - Scotch-Irish (%)
Ancestries Reported - Scottish (%)
Ancestries Reported - Slovak (%)
Ancestries Reported - Subsaharan African (%)
Ancestries Reported - Swedish (%)
Ancestries Reported - Swiss (%)
Ancestries Reported - Ukrainian (%)
Ancestries Reported - United States (%)
Ancestries Reported - Welsh (%)
Ancestries Reported - West Indian (%)
Ancestries Reported - Other (%)
Educational Attainment - No schooling completed (%)
Educational Attainment - Less than high school (%)
Educational Attainment - High school or equivalent (%)
Educational Attainment - Less than 1 year of college (%)
Educational Attainment - 1 or more years of college (%)
Educational Attainment - Associate degree (%)
Educational Attainment - Bachelor's degree (%)
Educational Attainment - Master's degree (%)
Educational Attainment - Professional school degree (%)
Educational Attainment - Doctorate degree (%)
School Enrollment - Nursery, preschool (%)
School Enrollment - Kindergarten (%)
School Enrollment - Grade 1 to 4 (%)
School Enrollment - Grade 5 to 8 (%)
School Enrollment - Grade 9 to 12 (%)
School Enrollment - College undergrad (%)
School Enrollment - Graduate or professional (%)
School Enrollment - Not enrolled in school (%)
School enrollment - Public schools (%)
School enrollment - Private schools (%)
School enrollment - Not enrolled (%)
Median number of rooms in houses and condos
Median number of rooms in apartments
Housing units lacking complete plumbing facilities (%)
Housing units lacking complete kitchen facilities (%)
Density of houses
Urban houses (%)
Rural houses (%)
Households with people 60 years and over (%)
Households with people 65 years and over (%)
Households with people 75 years and over (%)
Households with one or more nonrelatives (%)
Households with no nonrelatives (%)
Population in households (%)
Family households (%)
Nonfamily households (%)
Population in families (%)
Family households with own children (%)
Median number of bedrooms in owner occupied houses
Mean number of bedrooms in owner occupied houses
Median number of bedrooms in renter occupied houses
Mean number of bedrooms in renter occupied houses
Median number of vehichles in owner occupied houses
Mean number of vehichles in owner occupied houses
Median number of vehichles in renter occupied houses
Mean number of vehichles in renter occupied houses
Mortgage status - with mortgage (%)
Mortgage status - with second mortgage (%)
Mortgage status - with home equity loan (%)
Mortgage status - with both second mortgage and home equity loan (%)
Mortgage status - without a mortgage (%)
Average family size
Average family size - White
Average family size - Black or African American
Average family size - Asian
Average family size - Hispanic or Latino
Average family size - American Indian and Alaska Native
Average family size - Multirace
Average family size - Other Race
Geographical mobility - Same house 1 year ago (%)
Geographical mobility - Moved within same county (%)
Geographical mobility - Moved from different county within same state (%)
Geographical mobility - Moved from different state (%)
Geographical mobility - Moved from abroad (%)
Place of birth - Born in state of residence (%)
Place of birth - Born in other state (%)
Place of birth - Native, outside of US (%)
Place of birth - Foreign born (%)
Housing units in structures - 1, detached (%)
Housing units in structures - 1, attached (%)
Housing units in structures - 2 (%)
Housing units in structures - 3 or 4 (%)
Housing units in structures - 5 to 9 (%)
Housing units in structures - 10 to 19 (%)
Housing units in structures - 20 to 49 (%)
Housing units in structures - 50 or more (%)
Housing units in structures - Mobile home (%)
Housing units in structures - Boat, RV, van, etc. (%)
House/condo owner moved in on average (years ago)
Renter moved in on average (years ago)
Year householder moved into unit - Moved in 1999 to March 2000 (%)
Year householder moved into unit - Moved in 1995 to 1998 (%)
Year householder moved into unit - Moved in 1990 to 1994 (%)
Year householder moved into unit - Moved in 1980 to 1989 (%)
Year householder moved into unit - Moved in 1970 to 1979 (%)
Year householder moved into unit - Moved in 1969 or earlier (%)
Means of transportation to work - Drove car alone (%)
Means of transportation to work - Carpooled (%)
Means of transportation to work - Public transportation (%)
Means of transportation to work - Bus or trolley bus (%)
Means of transportation to work - Streetcar or trolley car (%)
Means of transportation to work - Subway or elevated (%)
Means of transportation to work - Railroad (%)
Means of transportation to work - Ferryboat (%)
Means of transportation to work - Taxicab (%)
Means of transportation to work - Motorcycle (%)
Means of transportation to work - Bicycle (%)
Means of transportation to work - Walked (%)
Means of transportation to work - Other means (%)
Working at home (%)
Industry diversity
Most Common Industries - Agriculture, forestry, fishing and hunting, and mining (%)
Most Common Industries - Agriculture, forestry, fishing and hunting (%)
Most Common Industries - Mining, quarrying, and oil and gas extraction (%)
Most Common Industries - Construction (%)
Most Common Industries - Manufacturing (%)
Most Common Industries - Wholesale trade (%)
Most Common Industries - Retail trade (%)
Most Common Industries - Transportation and warehousing, and utilities (%)
Most Common Industries - Transportation and warehousing (%)
Most Common Industries - Utilities (%)
Most Common Industries - Information (%)
Most Common Industries - Finance and insurance, and real estate and rental and leasing (%)
Most Common Industries - Finance and insurance (%)
Most Common Industries - Real estate and rental and leasing (%)
Most Common Industries - Professional, scientific, and management, and administrative and waste management services (%)
Most Common Industries - Professional, scientific, and technical services (%)
Most Common Industries - Management of companies and enterprises (%)
Most Common Industries - Administrative and support and waste management services (%)
Most Common Industries - Educational services, and health care and social assistance (%)
Most Common Industries - Educational services (%)
Most Common Industries - Health care and social assistance (%)
Most Common Industries - Arts, entertainment, and recreation, and accommodation and food services (%)
Most Common Industries - Arts, entertainment, and recreation (%)
Most Common Industries - Accommodation and food services (%)
Most Common Industries - Other services, except public administration (%)
Most Common Industries - Public administration (%)
Occupation diversity
Most Common Occupations - Management, business, science, and arts occupations (%)
Most Common Occupations - Management, business, and financial occupations (%)
Most Common Occupations - Management occupations (%)
Most Common Occupations - Business and financial operations occupations (%)
Most Common Occupations - Computer, engineering, and science occupations (%)
Most Common Occupations - Computer and mathematical occupations (%)
Most Common Occupations - Architecture and engineering occupations (%)
Most Common Occupations - Life, physical, and social science occupations (%)
Most Common Occupations - Education, legal, community service, arts, and media occupations (%)
Most Common Occupations - Community and social service occupations (%)
Most Common Occupations - Legal occupations (%)
Most Common Occupations - Education, training, and library occupations (%)
Most Common Occupations - Arts, design, entertainment, sports, and media occupations (%)
Most Common Occupations - Healthcare practitioners and technical occupations (%)
Most Common Occupations - Health diagnosing and treating practitioners and other technical occupations (%)
Most Common Occupations - Health technologists and technicians (%)
Most Common Occupations - Service occupations (%)
Most Common Occupations - Healthcare support occupations (%)
Most Common Occupations - Protective service occupations (%)
Most Common Occupations - Fire fighting and prevention, and other protective service workers including supervisors (%)
Most Common Occupations - Law enforcement workers including supervisors (%)
Most Common Occupations - Food preparation and serving related occupations (%)
Most Common Occupations - Building and grounds cleaning and maintenance occupations (%)
Most Common Occupations - Personal care and service occupations (%)
Most Common Occupations - Sales and office occupations (%)
Most Common Occupations - Sales and related occupations (%)
Most Common Occupations - Office and administrative support occupations (%)
Most Common Occupations - Natural resources, construction, and maintenance occupations (%)
Most Common Occupations - Farming, fishing, and forestry occupations (%)
Most Common Occupations - Construction and extraction occupations (%)
Most Common Occupations - Installation, maintenance, and repair occupations (%)
Most Common Occupations - Production, transportation, and material moving occupations (%)
Most Common Occupations - Production occupations (%)
Most Common Occupations - Transportation occupations (%)
Most Common Occupations - Material moving occupations (%)
People in Group quarters - Institutionalized population (%)
People in Group quarters - Correctional institutions (%)
People in Group quarters - Federal prisons and detention centers (%)
People in Group quarters - Halfway houses (%)
People in Group quarters - Local jails and other confinement facilities (including police lockups) (%)
People in Group quarters - Military disciplinary barracks (%)
People in Group quarters - State prisons (%)
People in Group quarters - Other types of correctional institutions (%)
People in Group quarters - Nursing homes (%)
People in Group quarters - Hospitals/wards, hospices, and schools for the handicapped (%)
People in Group quarters - Hospitals/wards and hospices for chronically ill (%)
People in Group quarters - Hospices or homes for chronically ill (%)
People in Group quarters - Military hospitals or wards for chronically ill (%)
People in Group quarters - Other hospitals or wards for chronically ill (%)
People in Group quarters - Hospitals or wards for drug/alcohol abuse (%)
People in Group quarters - Mental (Psychiatric) hospitals or wards (%)
People in Group quarters - Schools, hospitals, or wards for the mentally retarded (%)
People in Group quarters - Schools, hospitals, or wards for the physically handicapped (%)
People in Group quarters - Institutions for the deaf (%)
People in Group quarters - Institutions for the blind (%)
People in Group quarters - Orthopedic wards and institutions for the physically handicapped (%)
People in Group quarters - Wards in general hospitals for patients who have no usual home elsewhere (%)
People in Group quarters - Wards in military hospitals for patients who have no usual home elsewhere (%)
People in Group quarters - Juvenile institutions (%)
People in Group quarters - Long-term care (%)
People in Group quarters - Homes for abused, dependent, and neglected children (%)
People in Group quarters - Residential treatment centers for emotionally disturbed children (%)
People in Group quarters - Training schools for juvenile delinquents (%)
People in Group quarters - Short-term care, detention or diagnostic centers for delinquent children (%)
People in Group quarters - Type of juvenile institution unknown (%)
People in Group quarters - Noninstitutionalized population (%)
People in Group quarters - College dormitories (includes college quarters off campus) (%)
People in Group quarters - Military quarters (%)
People in Group quarters - On base (%)
People in Group quarters - Barracks, unaccompanied personnel housing (UPH), (Enlisted/Officer), ;and similar group living quarters for military personnel (%)
People in Group quarters - Transient quarters for temporary residents (%)
People in Group quarters - Military ships (%)
People in Group quarters - Group homes (%)
People in Group quarters - Homes or halfway houses for drug/alcohol abuse (%)
People in Group quarters - Homes for the mentally ill (%)
People in Group quarters - Homes for the mentally retarded (%)
People in Group quarters - Homes for the physically handicapped (%)
People in Group quarters - Other group homes (%)
People in Group quarters - Religious group quarters (%)
People in Group quarters - Dormitories (%)
People in Group quarters - Agriculture workers' dormitories on farms (%)
People in Group quarters - Job Corps and vocational training facilities (%)
People in Group quarters - Other workers' dormitories (%)
People in Group quarters - Crews of maritime vessels (%)
People in Group quarters - Other nonhousehold living situations (%)
People in Group quarters - Other noninstitutional group quarters (%)
Residents speaking English at home (%)
Residents speaking English at home - Born in the United States (%)
Residents speaking English at home - Native, born elsewhere (%)
Residents speaking English at home - Foreign born (%)
Residents speaking Spanish at home (%)
Residents speaking Spanish at home - Born in the United States (%)
Residents speaking Spanish at home - Native, born elsewhere (%)
Residents speaking Spanish at home - Foreign born (%)
Residents speaking other language at home (%)
Residents speaking other language at home - Born in the United States (%)
Residents speaking other language at home - Native, born elsewhere (%)
Residents speaking other language at home - Foreign born (%)
Class of Workers - Employee of private company (%)
Class of Workers - Self-employed in own incorporated business (%)
Class of Workers - Private not-for-profit wage and salary workers (%)
Class of Workers - Local government workers (%)
Class of Workers - State government workers (%)
Class of Workers - Federal government workers (%)
Class of Workers - Self-employed workers in own not incorporated business and Unpaid family workers (%)
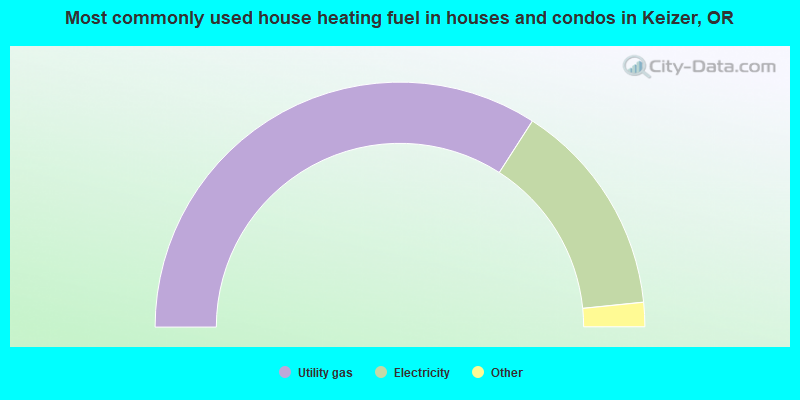
House heating fuel used in houses and condos - Utility gas (%)
House heating fuel used in houses and condos - Bottled, tank, or LP gas (%)
House heating fuel used in houses and condos - Electricity (%)
House heating fuel used in houses and condos - Fuel oil, kerosene, etc. (%)
House heating fuel used in houses and condos - Coal or coke (%)
House heating fuel used in houses and condos - Wood (%)
House heating fuel used in houses and condos - Solar energy (%)
House heating fuel used in houses and condos - Other fuel (%)
House heating fuel used in houses and condos - No fuel used (%)
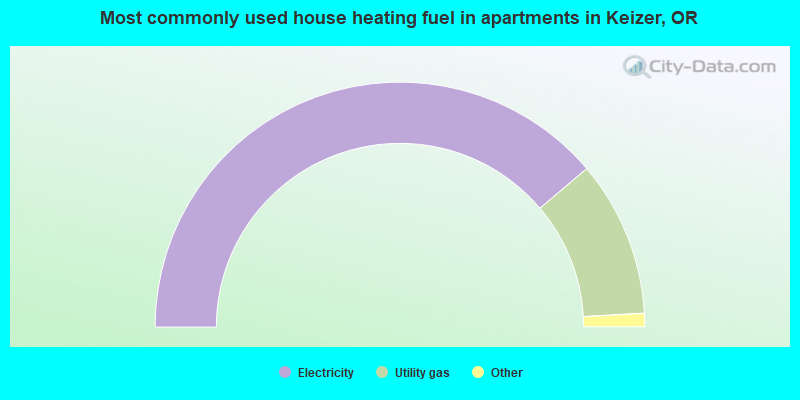
House heating fuel used in apartments - Utility gas (%)
House heating fuel used in apartments - Bottled, tank, or LP gas (%)
House heating fuel used in apartments - Electricity (%)
House heating fuel used in apartments - Fuel oil, kerosene, etc. (%)
House heating fuel used in apartments - Coal or coke (%)
House heating fuel used in apartments - Wood (%)
House heating fuel used in apartments - Solar energy (%)
House heating fuel used in apartments - Other fuel (%)
House heating fuel used in apartments - No fuel used (%)
Armed forces status - In Armed Forces (%)
Armed forces status - Civilian (%)
Armed forces status - Civilian - Veteran (%)
Armed forces status - Civilian - Nonveteran (%)
Fatal accidents locations in years 2005-2021
Fatal accidents locations in 2005
Fatal accidents locations in 2006
Fatal accidents locations in 2007
Fatal accidents locations in 2008
Fatal accidents locations in 2009
Fatal accidents locations in 2010
Fatal accidents locations in 2011
Fatal accidents locations in 2012
Fatal accidents locations in 2013
Fatal accidents locations in 2014
Fatal accidents locations in 2015
Fatal accidents locations in 2016
Fatal accidents locations in 2017
Fatal accidents locations in 2018
Fatal accidents locations in 2019
Fatal accidents locations in 2020
Fatal accidents locations in 2021
Alcohol use - People drinking some alcohol every month (%)
Alcohol use - People not drinking at all (%)
Alcohol use - Average days/month drinking alcohol
Alcohol use - Average drinks/week
Alcohol use - Average days/year people drink much
Audiometry - Average condition of hearing (%)
Audiometry - People that can hear a whisper from across a quiet room (%)
Audiometry - People that can hear normal voice from across a quiet room (%)
Audiometry - Ears ringing, roaring, buzzing (%)
Audiometry - Had a job exposure to loud noise (%)
Audiometry - Had off-work exposure to loud noise (%)
Blood Pressure & Cholesterol - Has high blood pressure (%)
Blood Pressure & Cholesterol - Checking blood pressure at home (%)
Blood Pressure & Cholesterol - Frequently checking blood cholesterol (%)
Blood Pressure & Cholesterol - Has high cholesterol level (%)
Consumer Behavior - Money monthly spent on food at supermarket/grocery store
Consumer Behavior - Money monthly spent on food at other stores
Consumer Behavior - Money monthly spent on eating out
Consumer Behavior - Money monthly spent on carryout/delivered foods
Consumer Behavior - Income spent on food at supermarket/grocery store (%)
Consumer Behavior - Income spent on food at other stores (%)
Consumer Behavior - Income spent on eating out (%)
Consumer Behavior - Income spent on carryout/delivered foods (%)
Current Health Status - General health condition (%)
Current Health Status - Blood donors (%)
Current Health Status - Has blood ever tested for HIV virus (%)
Current Health Status - Left-handed people (%)
Dermatology - People using sunscreen (%)
Diabetes - Diabetics (%)
Diabetes - Had a blood test for high blood sugar (%)
Diabetes - People taking insulin (%)
Diet Behavior & Nutrition - Diet health (%)
Diet Behavior & Nutrition - Milk product consumption (# of products/month)
Diet Behavior & Nutrition - Meals not home prepared (#/week)
Diet Behavior & Nutrition - Meals from fast food or pizza place (#/week)
Diet Behavior & Nutrition - Ready-to-eat foods (#/month)
Diet Behavior & Nutrition - Frozen meals/pizza (#/month)
Drug Use - People that ever used marijuana or hashish (%)
Drug Use - Ever used hard drugs (%)
Drug Use - Ever used any form of cocaine (%)
Drug Use - Ever used heroin (%)
Drug Use - Ever used methamphetamine (%)
Health Insurance - People covered by health insurance (%)
Kidney Conditions-Urology - Avg. # of times urinating at night
Medical Conditions - People with asthma (%)
Medical Conditions - People with anemia (%)
Medical Conditions - People with psoriasis (%)
Medical Conditions - People with overweight (%)
Medical Conditions - Elderly people having difficulties in thinking or remembering (%)
Medical Conditions - People who ever received blood transfusion (%)
Medical Conditions - People having trouble seeing even with glass/contacts (%)
Medical Conditions - People with arthritis (%)
Medical Conditions - People with gout (%)
Medical Conditions - People with congestive heart failure (%)
Medical Conditions - People with coronary heart disease (%)
Medical Conditions - People with angina pectoris (%)
Medical Conditions - People who ever had heart attack (%)
Medical Conditions - People who ever had stroke (%)
Medical Conditions - People with emphysema (%)
Medical Conditions - People with thyroid problem (%)
Medical Conditions - People with chronic bronchitis (%)
Medical Conditions - People with any liver condition (%)
Medical Conditions - People who ever had cancer or malignancy (%)
Mental Health - People who have little interest in doing things (%)
Mental Health - People feeling down, depressed, or hopeless (%)
Mental Health - People who have trouble sleeping or sleeping too much (%)
Mental Health - People feeling tired or having little energy (%)
Mental Health - People with poor appetite or overeating (%)
Mental Health - People feeling bad about themself (%)
Mental Health - People who have trouble concentrating on things (%)
Mental Health - People moving or speaking slowly or too fast (%)
Mental Health - People having thoughts they would be better off dead (%)
Oral Health - Average years since last visit a dentist
Oral Health - People embarrassed because of mouth (%)
Oral Health - People with gum disease (%)
Oral Health - General health of teeth and gums (%)
Oral Health - Average days a week using dental floss/device
Oral Health - Average days a week using mouthwash for dental problem
Oral Health - Average number of teeth
Pesticide Use - Households using pesticides to control insects (%)
Pesticide Use - Households using pesticides to kill weeds (%)
Physical Activity - People doing vigorous-intensity work activities (%)
Physical Activity - People doing moderate-intensity work activities (%)
Physical Activity - People walking or bicycling (%)
Physical Activity - People doing vigorous-intensity recreational activities (%)
Physical Activity - People doing moderate-intensity recreational activities (%)
Physical Activity - Average hours a day doing sedentary activities
Physical Activity - Average hours a day watching TV or videos
Physical Activity - Average hours a day using computer
Physical Functioning - People having limitations keeping them from working (%)
Physical Functioning - People limited in amount of work they can do (%)
Physical Functioning - People that need special equipment to walk (%)
Physical Functioning - People experiencing confusion/memory problems (%)
Physical Functioning - People requiring special healthcare equipment (%)
Prescription Medications - Average number of prescription medicines taking
Preventive Aspirin Use - Adults 40+ taking low-dose aspirin (%)
Reproductive Health - Vaginal deliveries (%)
Reproductive Health - Cesarean deliveries (%)
Reproductive Health - Deliveries resulted in a live birth (%)
Reproductive Health - Pregnancies resulted in a delivery (%)
Reproductive Health - Women breastfeeding newborns (%)
Reproductive Health - Women that had a hysterectomy (%)
Reproductive Health - Women that had both ovaries removed (%)
Reproductive Health - Women that have ever taken birth control pills (%)
Reproductive Health - Women taking birth control pills (%)
Reproductive Health - Women that have ever used Depo-Provera or injectables (%)
Reproductive Health - Women that have ever used female hormones (%)
Sexual Behavior - People 18+ that ever had sex (vaginal, anal, or oral) (%)
Sexual Behavior - Males 18+ that ever had vaginal sex with a woman (%)
Sexual Behavior - Males 18+ that ever performed oral sex on a woman (%)
Sexual Behavior - Males 18+ that ever had anal sex with a woman (%)
Sexual Behavior - Males 18+ that ever had any sex with a man (%)
Sexual Behavior - Females 18+ that ever had vaginal sex with a man (%)
Sexual Behavior - Females 18+ that ever performed oral sex on a man (%)
Sexual Behavior - Females 18+ that ever had anal sex with a man (%)
Sexual Behavior - Females 18+ that ever had any kind of sex with a woman (%)
Sexual Behavior - Average age people first had sex
Sexual Behavior - Average number of female sex partners in lifetime (males 18+)
Sexual Behavior - Average number of female vaginal sex partners in lifetime (males 18+)
Sexual Behavior - Average age people first performed oral sex on a woman (18+)
Sexual Behavior - Average number of woman performed oral sex on in lifetime (18+)
Sexual Behavior - Average number of male sex partners in lifetime (males 18+)
Sexual Behavior - Average number of male anal sex partners in lifetime (males 18+)
Sexual Behavior - Average age people first performed oral sex on a man (18+)
Sexual Behavior - Average number of male oral sex partners in lifetime (18+)
Sexual Behavior - People using protection when performing oral sex (%)
Sexual Behavior - Average number of times people have vaginal or anal sex a year
Sexual Behavior - People having sex without condom (%)
Sexual Behavior - Average number of male sex partners in lifetime (females 18+)
Sexual Behavior - Average number of male vaginal sex partners in lifetime (females 18+)
Sexual Behavior - Average number of female sex partners in lifetime (females 18+)
Sexual Behavior - Circumcised males 18+ (%)
Sleep Disorders - Average hours sleeping at night
Sleep Disorders - People that has trouble sleeping (%)
Smoking-Cigarette Use - People smoking cigarettes (%)
Taste & Smell - People 40+ having problems with smell (%)
Taste & Smell - People 40+ having problems with taste (%)
Taste & Smell - People 40+ that ever had wisdom teeth removed (%)
Taste & Smell - People 40+ that ever had tonsils teeth removed (%)
Taste & Smell - People 40+ that ever had a loss of consciousness because of a head injury (%)
Taste & Smell - People 40+ that ever had a broken nose or other serious injury to face or skull (%)
Taste & Smell - People 40+ that ever had two or more sinus infections (%)
Weight - Average height (inches)
Weight - Average weight (pounds)
Weight - Average BMI
Weight - People that are obese (%)
Weight - People that ever were obese (%)
Weight - People trying to lose weight (%)
According to our research of Oregon and other state lists, there were 5 registered sex offenders living in Keizer, Oregon as of June 05, 2024 . The ratio of all residents to sex offenders in Keizer is 7,724 to 1.The ratio of registered sex offenders to all residents in this city is much lower than the state average.
Officers per 1,000 residents here:
0.95Oregon average:
1.48
Latest news from Keizer, OR collected exclusively by city-data.com from local newspapers, TV, and radio stations
Ancestries: German (8.6%), European (7.8%), English (7.6%), American (5.4%), Irish (4.4%), Norwegian (2.9%).
Current Local Time:
Land area: 7.23 square miles.
Population density: 5,355 people per square mile (average).
3,967 residents are foreign born (6.5% Latin America , 1.4% Europe , 1.2% Asia ).
This city:
10.1%Oregon:
9.8%
Median real estate property taxes paid for housing units with mortgages in 2022: $3,391 (0.8%)Median real estate property taxes paid for housing units with no mortgage in 2022: $3,415 (0.9%)
Nearest city with pop. 50,000+: Salem, OR
Nearest city with pop. 200,000+: Northwest Clackamas, OR (33.7 miles
Nearest city with pop. 1,000,000+: Los Angeles, CA
Nearest cities:
Eola, OR (2.6 miles),
Latitude: 45.00 N, Longitude: 123.02 W
Nickname or alias (official or unofficial): Iris Capital of the World
Daytime population change due to commuting: -8,472 (-21.6%)Workers who live and work in this city: 5,106 (27.4%)
Area code commonly used in this area: 503
Keizer tourist attractions:
Single-family new house construction building permits:
2022: 16 buildings , average cost: $242,9002021: 25 buildings , average cost: $291,0002020: 26 buildings , average cost: $312,1002019: 36 buildings , average cost: $282,9002018: 21 buildings , average cost: $260,6002017: 32 buildings , average cost: $271,1002016: 55 buildings , average cost: $267,8002015: 107 buildings , average cost: $257,0002014: 56 buildings , average cost: $251,3002013: 51 buildings , average cost: $231,1002012: 21 buildings , average cost: $208,6002011: 15 buildings , average cost: $237,8002010: 34 buildings , average cost: $199,2002009: 50 buildings , average cost: $212,1002008: 48 buildings , average cost: $200,8002007: 65 buildings , average cost: $206,1002006: 56 buildings , average cost: $212,0002005: 69 buildings , average cost: $208,5002004: 125 buildings , average cost: $188,0002003: 96 buildings , average cost: $186,7002002: 198 buildings , average cost: $185,1002001: 102 buildings , average cost: $119,1002000: 257 buildings , average cost: $124,2001999: 241 buildings , average cost: $137,3001998: 297 buildings , average cost: $128,6001997: 259 buildings , average cost: $134,400Unemployment in December 2023: Population change in the 1990s: +10,194 (+46.3%).
Most common occupations in Keizer, OR (%)
Both Males Females
Other office and administrative support workers, including supervisors (5.2%)
Other management occupations, except farmers and farm managers (5.2%)
Other sales and related occupations, including supervisors (4.7%)
Other production occupations, including supervisors (3.4%)
Preschool, kindergarten, elementary, and middle school teachers (3.1%)
Retail sales workers, except cashiers (2.5%)
Electrical equipment mechanics and other installation, maintenance, and repair workers, including supervisors (2.5%)
Other management occupations, except farmers and farm managers (5.8%)
Other production occupations, including supervisors (4.8%)
Other sales and related occupations, including supervisors (4.7%)
Driver/sales workers and truck drivers (4.5%)
Electrical equipment mechanics and other installation, maintenance, and repair workers, including supervisors (4.2%)
Retail sales workers, except cashiers (3.1%)
Sales representatives, services, wholesale and manufacturing (2.9%)
Other office and administrative support workers, including supervisors (8.4%)
Preschool, kindergarten, elementary, and middle school teachers (5.2%)
Other sales and related occupations, including supervisors (4.8%)
Other management occupations, except farmers and farm managers (4.5%)
Secretaries and administrative assistants (3.9%)
Bookkeeping, accounting, and auditing clerks (3.9%)
Information and record clerks, except customer service representatives (3.6%)
Air pollution and air quality trends(lower is better)
AQI Ozone PM2.5
Earthquake activity:
Keizer-area historical earthquake activity is significantly above Oregon state average. It is 1396% greater than the overall U.S. average. On 4/13/1949 at 19:55:42, a magnitude 7.0 (7.0 UK, Class: Major, Intensity: VIII - XII) earthquake occurred 157.6 miles away from Keizer center, causing $80,000,000 total damage On 1/31/1922 at 13:17:28, a magnitude 7.6 (7.6 UK) earthquake occurred 323.9 miles away from Keizer center On 2/28/2001 at 18:54:32, a magnitude 6.8 (6.5 MB, 6.6 MS, 6.8 MW, Class: Strong, Intensity: VII - IX) earthquake occurred 146.1 miles away from the city center, causing $2,000,000,000 total damage and $305,000,000 insured lossesOn 2/28/2001 at 18:54:32, a magnitude 6.8 (6.8 MD, Depth: 32.2 mi) earthquake occurred 149.3 miles away from Keizer center On 11/8/1980 at 10:27:34, a magnitude 7.2 (6.2 MB, 7.2 MS, 7.2 MW, 7.0 ML) earthquake occurred 276.7 miles away from the city center On 8/17/1991 at 22:17:14, a magnitude 7.1 (6.2 MB, 7.1 MS, 7.1 MW, 6.8 ML, Depth: 8.4 mi) earthquake occurred 259.3 miles away from Keizer center Magnitude types: body-wave magnitude (MB), duration magnitude (MD), local magnitude (ML), surface-wave magnitude (MS), moment magnitude (MW) Natural disasters: The number of natural disasters in Marion County (10) is smaller than the US average (15).Major Disasters (Presidential) Declared: 8Emergencies Declared: 1Floods: 4, Winter Storms: 3, Landslides: 2, Mudslides: 2, Snows: 2, Storms: 2, Earthquake: 1, Fire: 1, Heavy Rain: 1, Hurricane: 1, Wind: 1, Other: 1 (Note: some incidents may be assigned to more than one category). Hospitals and medical centers in Keizer: AVAMERE COURT AT KEIZER (5210 RIVER ROAD N.)
SHERWOOD PARK NURSING AND REHAB CENTER (4062 ARLETA AVENUE NE)
Other hospitals and medical centers near Keizer: KEIZER RETIREMENT AND HEALTH C VILL (Nursing Home, about 1 miles away; SALEM, OR)
MAGNOLIA MANOR (Nursing Home, about 3 miles away; SALEM, OR)
SALEM NORTH DIALYSIS (Dialysis Facility, about 4 miles away; SALEM, OR)
WINDSOR HEALTH AND REHABILITATION CENTER (Nursing Home, about 4 miles away; SALEM, OR)
OREGON STATE HOSPITAL (Hospital, about 5 miles away; SALEM, OR)
OREGON STATE HOSPITAL DISTINCT PART (Hospital, about 5 miles away; SALEM, OR)
OAK CREST REHAB AND HEALTH SERV CENTER (Nursing Home, about 5 miles away; SALEM, OR)
Amtrak station near Keizer: 5 miles: SALEM (500 13TH ST. SE) Services: ticket office, fully wheelchair accessible, public payphones, vending machines, free short-term parking, free long-term parking, call for taxi service, public transit connection.
Colleges/universities with over 2000 students nearest to Keizer:
Chemeketa Community College (about 3 miles; Salem, OR ; Full-time enrollment: 10,746)
Willamette University (about 5 miles; Salem, OR ; FT enrollment: 2,551)
Western Oregon University (about 15 miles; Monmouth, OR ; FT enrollment: 5,131)
George Fox University (about 22 miles; Newberg, OR ; FT enrollment: 2,954)
Pioneer Pacific College (about 26 miles; Wilsonville, OR ; FT enrollment: 2,194)
Linn-Benton Community College (about 29 miles; Albany, OR ; FT enrollment: 4,511)
Clackamas Community College (about 32 miles; Oregon City, OR ; FT enrollment: 4,261)
Public high school in Keizer:
Biggest public elementary/middle schools in Keizer: CLAGGETT CREEK MIDDLE SCHOOL Students: 944, Location: 1810 ALDER DR NE, Grades: 6-8)WHITEAKER MIDDLE SCHOOL Students: 868, Location: 1605 LOCKHAVEN DR NE, Grades: 6-8)KEIZER ELEMENTARY SCHOOL Students: 532, Location: 5600 MCCLURE ST N, Grades: KG-5)GUBSER ELEMENTARY SCHOOL Students: 511, Location: 6610 14TH AVE NE, Grades: KG-5)WEDDLE ELEMENTARY SCHOOL Students: 483, Location: 1825 ALDER DR NE, Grades: KG-5)CLEAR LAKE ELEMENTARY SCHOOL Students: 479, Location: 7425 MEADOWGLEN N, Grades: KG-5)CUMMINGS ELEMENTARY SCHOOL Students: 411, Location: 613 CUMMINGS LN N, Grades: KG-5)FOREST RIDGE ELEMENTARY SCHOOL Students: 241, Location: 7905 JUNE REID PL NE, Grades: KG-5)OPTIMUM LEARNING ENVIRONMENT CHARTER SCHOOL Students: 125, Location: 7905 JUNE REID PL NE, Grades: 1-5, Charter school )KENNEDY ELEMENTARY SCHOOL Location: 4912 NOREN AVE NE, Grades: KG-5)
See full list of schools located in Keizer
Notable locations in Keizer: (A) , Clear Lake Golf Course (B) , Salem Keizer Volcanoes Stadium (C) , Cherriots North Salem Safeway Park and Ride (D) , Keizer Fire District (E) , Keizer Public Works Department Office (F) , Keizer Municipal Court (G) , Keizer City Hall (H) . Display/hide their locations on the map
Cemetery: (1) . Display/hide its location on the map
Creek: (A) . Display/hide its location on the map
Parks in Keizer include: (1) , Claggett Creek Park (2) , Wilark County Park (3) , Northside County Park (4) . Display/hide their locations on the map
Marion County has a predicted average indoor radon screening level less than 2 pCi/L (pico curies per liter) - Low Potential Drinking water stations with addresses in Keizer and their reported violations in the past:
KEIZER, CITY OF (Population served: 33,500, Groundwater):
Past health violations:
MCL, Monthly (TCR) - In JAN-2011, Contaminant: Coliform. Follow-up actions: St Public Notif requested (FEB-17-2011), St Violation/Reminder Notice (FEB-22-2011), St Public Notif received (MAR-02-2011), St Compliance achieved (MAR-07-2011)
MCL, Monthly (TCR) - In JUN-2005, Contaminant: Coliform. Follow-up actions: St Compliance achieved (JUL-07-2005), St Public Notif received (JUL-28-2005)
Past monitoring violations:
One regular monitoring violation
Population served: 250, Groundwater):
Past health violations:
MCL, Monthly (TCR) - Between JUL-2007 and SEP-2007, Contaminant: Coliform. Follow-up actions: St Compliance achieved (JAN-25-2008), St AO (w/o penalty) issued (SEP-04-2008)
Past monitoring violations:
Monitoring, Repeat Major (TCR) - Between JAN-2006 and MAR-2006, Contaminant: Coliform (TCR). Follow-up actions: St Compliance achieved (AUG-07-2006), St AO (w/o penalty) issued (SEP-04-2008)
13 routine major monitoring violations
4 regular monitoring violations
Population served: 160, Groundwater):
Past health violations:
MCL, Acute (TCR) - In MAR-2011, Contaminant: Coliform. Follow-up actions: St Public Notif received (MAR-08-2011), St Public Notif requested (APR-18-2011), St Violation/Reminder Notice (APR-25-2011), St Compliance achieved (AUG-01-2011)
MCL, Monthly (TCR) - In APR-2010, Contaminant: Coliform. Follow-up actions: St Public Notif received (APR-19-2010), St Public Notif requested (MAY-18-2010), St Compliance achieved (MAY-20-2010), St Violation/Reminder Notice (MAY-24-2010)
Past monitoring violations:
Monitoring, Source Water (GWR) - In NOV-01-2010, Contaminant: E. COLI. Follow-up actions: St Violation/Reminder Notice (DEC-27-2010), St Compliance achieved (MAR-08-2011)
Follow-up Or Routine LCR Tap M/R - In JAN-01-2005, Contaminant: Lead and Copper Rule. Follow-up actions: Fed Compliance achieved (OCT-15-2007), State No Longer Subject to Rule (DEC-25-2010)
Follow-up Or Routine LCR Tap M/R - In JAN-01-2004, Contaminant: Lead and Copper Rule. Follow-up actions: Fed Compliance achieved (OCT-15-2007), State No Longer Subject to Rule (DEC-25-2010)
Follow-up Or Routine LCR Tap M/R - In JAN-01-2003, Contaminant: Lead and Copper Rule. Follow-up actions: Fed Compliance achieved (OCT-15-2007), State No Longer Subject to Rule (DEC-25-2010)
Follow-up Or Routine LCR Tap M/R - In OCT-01-1996, Contaminant: Lead and Copper Rule. Follow-up actions: Fed Compliance achieved (OCT-15-2007), State No Longer Subject to Rule (DEC-25-2010)
4 routine major monitoring violations
One minor monitoring violation
6 regular monitoring violations
Average household size: This city:
2.6 peopleOregon:
2.5 people
Percentage of family households: This city:
69.3%Whole state:
63.4%
Percentage of households with unmarried partners: This city:
7.8%Whole state:
8.0%
Likely homosexual households (counted as self-reported same-sex unmarried-partner households)
Lesbian couples: 0.5% of all households Gay men: 0.3% of all households
People in group quarters in Keizer in 2010:
190 people in nursing facilities/skilled-nursing facilities
115 people in group homes intended for adults
40 people in emergency and transitional shelters (with sleeping facilities) for people experiencing homelessness
19 people in residential treatment centers for adults
People in group quarters in Keizer in 2000:
233 people in nursing homes
32 people in homes for the mentally retarded
15 people in other group homes
Banks with branches in Keizer (2011 data):
West Coast Bank: Keizer Retirement Branch at 5210 River Rd N, branch established on 1990/11/28; Williamette Lutheran Branch at 7693 Wheatland Rd Ne, branch established on 1990/11/27. Info updated 2010/09/16: Bank assets: $2,424.8 mil, Deposits: $1,925.6 mil, headquarters in Lake Oswego, OR, positive income , Commercial Lending Specialization, 63 total offices , Holding Company: West Coast Bancorp
U.S. Bank National Association: Keizer Branch at 5110 River Road North, branch established on 1965/05/25. Info updated 2012/01/30: Bank assets: $330,470.8 mil, Deposits: $236,091.5 mil, headquarters in Cincinnati, OH, positive income , 3121 total offices , Holding Company: U.S. Bancorp
JPMorgan Chase Bank, National Association: Keizer Branch at 5560 Inland Shores Way N, branch established on 1998/10/05. Info updated 2011/11/10: Bank assets: $1,811,678.0 mil, Deposits: $1,190,738.0 mil, headquarters in Columbus, OH, positive income , International Specialization, 5577 total offices , Holding Company: Jpmorgan Chase & Co.
Wells Fargo Bank, National Association: Keizer On River Road Branch at 4605 River Road North, branch established on 1999/12/01. Info updated 2011/04/05: Bank assets: $1,161,490.0 mil, Deposits: $905,653.0 mil, headquarters in Sioux Falls, SD, positive income , 6395 total offices , Holding Company: Wells Fargo & Company
Willamette Valley Bank: Keizer Branch at 5140 River Road Ne, branch established on 2006/04/03. Info updated 2006/11/03: Bank assets: $121.5 mil, Deposits: $102.1 mil, headquarters in Salem, OR, positive income , Commercial Lending Specialization, 4 total offices , Holding Company: Oregon Bancorp, Inc.
Bank of the Cascades: Keizer Branch at 5120 River Road North, branch established on 2000/06/21. Info updated 2007/01/18: Bank assets: $1,334.8 mil, Deposits: $1,087.3 mil, headquarters in Bend, OR, negative income in the last year , Commercial Lending Specialization, 35 total offices , Holding Company: Cascade Bancorp
KeyBank National Association: Keizer Station Branch at 2680 Jorie Lane Ne, branch established on 2008/11/01. Info updated 2008/03/03: Bank assets: $86,198.8 mil, Deposits: $64,214.8 mil, headquarters in Cleveland, OH, positive income , Commercial Lending Specialization, 1067 total offices , Holding Company: Keycorp
For population 15 years and over in Keizer:
Never married: 32.2%Now married: 47.0%Separated: 1.9%Widowed: 4.6%Divorced: 14.4% For population 25 years and over in Keizer:
High school or higher: 89.0%Bachelor's degree or higher: 25.8%Graduate or professional degree: 7.9%Unemployed: 7.3%Mean travel time to work (commute): 21.2 minutes
Education Gini index (Inequality in education) Here:
12.8Oregon average:
11.6
Religion statistics for Keizer, OR (based on Marion County data)
Religion Adherents Congregations Catholic 62,607 15 Evangelical Protestant 46,619 186 Mainline Protestant 12,797 41 Other 11,663 46 Black Protestant 189 1 Orthodox - - None 181,460 -
Source: Clifford Grammich, Kirk Hadaway, Richard Houseal, Dale E.Jones, Alexei Krindatch, Richie Stanley and Richard H.Taylor. 2012. 2010 U.S.Religion Census: Religious Congregations & Membership Study. Association of Statisticians of American Religious Bodies. Jones, Dale E., et al. 2002. Congregations and Membership in the United States 2000. Nashville, TN: Glenmary Research Center. Graphs represent county-level data
Food Environment Statistics: Number of grocery stores : 53This county :
1.71 / 10,000 pop.Oregon :
2.03 / 10,000 pop.
Number of supercenters and club stores : 9Here :
0.29 / 10,000 pop.State :
0.33 / 10,000 pop.
Number of convenience stores (no gas) : 50This county :
1.61 / 10,000 pop.Oregon :
2.01 / 10,000 pop.
Number of convenience stores (with gas) : 47Marion County :
1.52 / 10,000 pop.Oregon :
1.69 / 10,000 pop.
Number of full-service restaurants : 207Marion County :
6.68 / 10,000 pop.Oregon :
9.93 / 10,000 pop.
Adult diabetes rate : This county :
8.2%Oregon :
7.4%
Adult obesity rate : This county :
29.5%Oregon :
25.6%
Low-income preschool obesity rate : Marion County :
18.4%Oregon :
14.2%
Health and Nutrition:
Average overall health of teeth and gums : People feeling badly about themselves : This city:
21.4%Oregon:
21.2%
People not drinking alcohol at all : This city:
10.3%Oregon:
10.1%
Average hours sleeping at night : Overweight people : This city:
33.7%Oregon:
33.3%
General health condition : This city:
56.3%Oregon:
56.5%
Average condition of hearing : More about Health and Nutrition of Keizer, OR Residents
Local government employment and payroll (March 2022)
Function
Full-time employees
Monthly full-time payroll
Average yearly full-time wage
Part-time employees
Monthly part-time payroll
Police Protection - Officers
40 $325,215 $97,565 0 $0 Water Supply
11 $62,660 $68,356 0 $0 Financial Administration
9 $52,881 $70,508 0 $0 Police - Other
8 $45,210 $67,815 0 $0 Other Government Administration
7 $62,197 $106,623 0 $0 Parks and Recreation
5 $24,761 $59,426 5 $1,871 Natural Resources
5 $29,097 $69,833 0 $0 Streets and Highways
5 $30,117 $72,281 0 $0 Housing and Community Development (Local)
3 $19,677 $78,708 0 $0 Judicial and Legal
3 $23,574 $94,296 0 $0 Other and Unallocable
2 $10,556 $63,336 0 $0
Totals for Government
98 $685,946 $83,993 5 $1,871
Keizer government finances - Expenditure in 2017 (per resident):
Construction - Water Utilities: $537,000 ($13.87)
Regular Highways: $473,000 ($12.22)Natural Resources - Other: $296,000 ($7.65)Police Protection: $177,000 ($4.57)Central Staff Services: $68,000 ($1.76)Parks and Recreation: $48,000 ($1.24)General - Other: $25,000 ($0.65)Current Operations - Police Protection: $6,280,000 ($162.26)
Central Staff Services: $3,688,000 ($95.29)Water Utilities: $1,569,000 ($40.54)Natural Resources - Other: $1,009,000 ($26.07)General - Other: $491,000 ($12.69)Regular Highways: $491,000 ($12.69)Financial Administration: $350,000 ($9.04)Parks and Recreation: $322,000 ($8.32)Judicial and Legal Services: $213,000 ($5.50)Sewerage: $3,000 ($0.08)Intergovernmental to Local - Other - Sewerage: $5,431,000 ($140.32)
Total Salaries and Wages: $6,713,000 ($173.44)
Water Utilities - Interest on Debt: $662,000 ($17.10)
Keizer government finances - Revenue in 2017 (per resident):
Charges - Sewerage: $5,791,000 ($149.62)
Local Intergovernmental - General Local Government Support: $372,000 ($9.61)
Miscellaneous - Special Assessments: $1,229,000 ($31.75)
Interest Earnings: $907,000 ($23.43)Fines and Forfeits: $447,000 ($11.55)Rents: $283,000 ($7.31)General Revenue - Other: $65,000 ($1.68)Donations From Private Sources: $7,000 ($0.18)Revenue - Water Utilities: $4,050,000 ($104.64)
State Intergovernmental - Highways: $2,231,000 ($57.64)
General Local Government Support: $949,000 ($24.52)Other: $34,000 ($0.88)Tax - Property: $5,017,000 ($129.62)
Public Utilities Sales: $2,874,000 ($74.26)Occupation and Business License - Other: $449,000 ($11.60)Amusements Sales: $108,000 ($2.79)Other Selective Sales: $9,000 ($0.23)Alcoholic Beverage License: $3,000 ($0.08)
Keizer government finances - Debt in 2017 (per resident):
Long Term Debt - Beginning Outstanding - Unspecified Public Purpose: $16,535,000 ($427.22)
Outstanding Unspecified Public Purpose: $15,535,000 ($401.38)Retired Unspecified Public Purpose: $1,000,000 ($25.84)
Keizer government finances - Cash and Securities in 2017 (per resident):
Other Funds - Cash and Securities: $13,226,000 ($341.72)
Businesses in Keizer, OR
Name Count Name Count
7-Eleven 2 Lowe's 1 Ace Hardware 1 McDonald's 1 Albertsons 1 Men's Wearhouse 1 Arby's 1 Nike 1 AutoZone 1 Old Navy 1 Avenue 1 Panda Express 1 Bed Bath & Beyond 1 Payless 1 Blockbuster 1 Pizza Hut 1 Burger King 2 Quiznos 1 Carl\s Jr. 1 RadioShack 1 Cricket Wireless 1 Rite Aid 1 Curves 1 SONIC Drive-In 1 Dairy Queen 1 Safeway 1 Domino's Pizza 1 Staples 1 Famous Footwear 1 Starbucks 4 FedEx 3 Subway 3 GNC 1 T-Mobile 2 GameStop 1 Taco Bell 1 Goodwill 1 Target 1 H&R Block 1 UPS 3 Jamba Juice 1 Verizon Wireless 1 Lane Bryant 1 Vons 1 Lane Furniture 1 Walgreens 1 Little Caesars Pizza 1
Strongest AM radio stations in Keizer:
KSLM (1390 AM; 10 kW; SALEM, OR)
KYKN (1430 AM; 5 kW; KEIZER, OR; Owner: WILLAMETTE BROADCASTING CO., INC.)
KPOJ (620 AM; 50 kW; PORTLAND, OR; Owner: CITICASTERS LICENSES, L.P.)
KBZY (1490 AM; 1 kW; SALEM, OR; Owner: CAPITAL BROADCASTING, INC.)
KCCS (1220 AM; 1 kW; SALEM, OR; Owner: CHRISTIAN CENTER OF SALEM)
KXL (750 AM; 50 kW; PORTLAND, OR; Owner: ROSE CITY RADIO CORPORATION)
KEX (1190 AM; 50 kW; PORTLAND, OR; Owner: CITICASTERS LICENSES, L.P.)
KWIP (880 AM; 5 kW; DALLAS, OR; Owner: JUPITER COMMUNICATIONS CORPORATION)
KKSN (1520 AM; 50 kW; OREGON CITY, OR; Owner: ENTERCOM PORTLAND LICENSE, LLC)
KPAM (860 AM; 50 kW; TROUTDALE, OR; Owner: PAMPLIN BROADCASTING-OREGON, INC.)
KOTK (1080 AM; 50 kW; PORTLAND, OR; Owner: FISHER BROADCASTING - PORTLAND RADIO, L.L.C.)
KKAD (1550 AM; 50 kW; VANCOUVER, WA; Owner: PAMPLIN BROADCASTING-WASHINGTON, INC)
KOAC (550 AM; 5 kW; CORVALLIS, OR; Owner: OREGON PUBLIC BROADCASTING)
Strongest FM radio stations in Keizer:
K231AB (94.1 FM; TURNER, OR; Owner: STATE OF OREGON / STATE BOARD OF EDUCATION)
KRSK (105.1 FM; MOLALLA, OR; Owner: ENTERCOM PORTLAND LICENSE, LLC)
KLVU (107.1 FM; SWEET HOME, OR; Owner: EDUCATIONAL MEDIA FOUNDATION)
K228DT (93.5 FM; HAPPY HOLLOW, OR; Owner: OREGON PUBLIC BROADCASTING)
K273AJ (102.5 FM; ELWOOD, OR; Owner: CALVARY CHAPEL OF TWIN FALLS, INC.)
K225AI (92.9 FM; PORTLAND, OR; Owner: EDUCATIONAL MEDIA FOUNDATION)
KHPE (107.9 FM; ALBANY, OR; Owner: INTEGRITY MEDIA, INC.)
K264AA (100.7 FM; CORVALLIS, ETC., OR; Owner: THE KBOO FOUNDATION)
KLOO-FM (106.3 FM; CORVALLIS, OR; Owner: CITICASTERS LICENSES, L.P.)
KRKT-FM (99.9 FM; ALBANY, OR; Owner: CITICASTERS LICENSES, L.P.)
K243AL (96.5 FM; CORVALLIS, OR; Owner: CUMULUS LICENSING CORP.)
KINK (101.9 FM; PORTLAND, OR; Owner: INFINITY RADIO OPERATIONS INC.)
KKCW (103.3 FM; BEAVERTON, OR; Owner: CITICASTERS LICENSES, L.P.)
K276BU (103.1 FM; CORVALLIS, OR; Owner: OREGON PUBLIC BROADCASTING)
KPDQ-FM (93.7 FM; PORTLAND, OR; Owner: SALEM MEDIA OF OREGON, INC.)
KOPB-FM (91.5 FM; PORTLAND, OR; Owner: OREGON PUBLIC BROADCASTING)
KKRZ (100.3 FM; PORTLAND, OR; Owner: CITICASTERS LICENSES, L.P.)
KDUK-FM (104.7 FM; FLORENCE, OR; Owner: CAPSTAR TX LIMITED PARTNERSHIP)
KMHD (89.1 FM; GRESHAM, OR; Owner: MT. HOOD COMMUNITY COLLEGE DISTRICT)
KVMX (107.5 FM; BANKS, OR; Owner: INFINITY RADIO OPERATIONS INC.)
TV broadcast stations around Keizer:
KPXG (Channel 22; SALEM, OR; Owner: PAXSON SALEM LICENSE, INC.)
K50GG (Channel 50; SALEM, OR; Owner: MEREDITH CORPORATION)
K61CC (Channel 61; SALEM, OR; Owner: NORTHWEST CHRISTIAN BROADCASTING)
KATU (Channel 2; PORTLAND, OR; Owner: FISHER BROADCASTING - PORTLAND TV, L.L.C.)
KWBP (Channel 32; SALEM, OR; Owner: TRIBUNE BROADCAST HOLDINGS, INC.)
KPDX (Channel 49; VANCOUVER, WA; Owner: MEREDITH CORPORATION)
KPTV (Channel 12; PORTLAND, OR; Owner: MEREDITH CORPORATION)
K67GU (Channel 67; EUREKA, CA; Owner: MS COMMUNICATIONS, LLC)
K57IF (Channel 57; SALEM, OR; Owner: LaGRANDE BROADCASTING, INC.)
KOIN (Channel 6; PORTLAND, OR; Owner: EMMIS TELEVISION LICENSE CORPORATION)
KNMT (Channel 24; PORTLAND, OR; Owner: NATIONAL MINORITY T.V., INC.)
KGW (Channel 8; PORTLAND, OR; Owner: KING BROADCASTING COMPANY)
KOPB-TV (Channel 10; PORTLAND, OR; Owner: OREGON PUBLIC BROADCASTING)
K18EL (Channel 18; NEWBERG/TIGARD, OR; Owner: MEREDITH CORPORATION)
KWBP-LP (Channel 4; PORTLAND, OR; Owner: TRIBUNE BROADCASTING HOLDINGS, INC.)
National Bridge Inventory (NBI) Statistics 18 Number of bridges171ft / 52.2m Total length $845,000 Total costs76,426 Total average daily traffic7,622 Total average daily truck traffic
New bridges - historical statistics
2 1950-1959 1 1960-1969 4 1970-1979 2 1980-1989 8 2000-2009 1 2010-2019
See full National Bridge Inventory statistics for Keizer, OR
FCC Registered Cell Phone Towers: 1 (
See the full list of FCC Registered Cell Phone Towers in Keizer )
FCC Registered Antenna Towers: 53 (
See the full list of FCC Registered Antenna Towers )
FCC Registered Broadcast Land Mobile Towers: 5
Lat: 44.989778 Lon: -123.026444, Call Sign: WPSZ608, Assigned Frequencies: 33.4000 MHz, 154.540 MHz, Grant Date: 08/14/2001, Expiration Date: 08/14/2011, Cancellation Date: 10/15/2011, Certifier: David C Hartley, Registrant: Business Radio Licensing, 26941 Cabot Rd #134, Laguna Hills, CA 92653, Phone: (949) 348-8510, Fax: (949) 348-8514Lat: 45.031111 Lon: -123.025556, Call Sign: WQKH206, Assigned Frequencies: 467.762 MHz, 467.812 MHz, 467.850 MHz, 464.325 MHz, 464.825 MHz, Grant Date: 02/28/2019, Expiration Date: 05/18/2029, Certifier: Matt Meisenburg, Registrant: Business Radio Licensing, 30251 Golden Lantern, Suite E # 501, Laguna Niguel, CA 92677, Phone: (949) 348-8510, Fax: (949) 348-8514, Email:
Well #19, 4969 Rickman Road Ne (Lat: 44.995833 Lon: -123.019889), Type: Bant, Structure height: 6.1 m, Call Sign: WQME682, Assigned Frequencies: 458.625 MHz, Grant Date: 08/04/2020, Expiration Date: 07/19/2030, Certifier: Daryl Okubo, Registrant: Taurus Power & Control\'S, Inc., 9999 Sw Avery St., Tualatin, OR 97062, Phone: (253) 831-3017, Fax: (503) 692-9273 MCNARY OAKS MHP, Lat: 45.003417 Lon: -123.020306, Call Sign: WQNK382, Licensee ID: L01502812, Assigned Frequencies: 451.512 MHz, Grant Date: 03/03/2011, Expiration Date: 03/03/2021, Cancellation Date: 05/08/2021, Certifier: Jack Graudenz, Registrant: Cereniti Datasense Networks, 41 East Washington Street, Suite 110, Indianapolis, IN 46204, Phone: (877) 237-3648, Fax: (877) 362-6640, Email:
Lat: 45.003194 Lon: -123.025000, Call Sign: WRAD988, Assigned Frequencies: 467.237 MHz, 462.287 MHz, 467.287 MHz, 462.362 MHz, 467.362 MHz, 462.412 MHz, 467.412 MHz, Grant Date: 10/21/2017, Expiration Date: 10/21/2027, Certifier: Paul Sebesta, Registrant: Advanced Wireless Communications, 20809 Kensington Blvd, Lakeville, MN 55044-8353, Phone: (952) 469-5400, Fax: (952) 469-0170, Email:
FCC Registered Microwave Towers: 7
OR-SLE0023B, 5390 River Road N (Lat: 45.002556 Lon: -123.024944), Type: Pole, Structure height: 44.2 m, Call Sign: WQKL249, Assigned Frequencies: 23025.0 MHz, 23075.0 MHz, 23125.0 MHz, 23175.0 MHz, Grant Date: 06/30/2009, Expiration Date: 06/30/2019, Cancellation Date: 05/02/2019, Certifier: Nadja S Sodos-Wallace, Registrant: Sprint Corporation, 12502 Sunrise Valley Drive, M/S: Varesa, Reston, VA 20196, Phone: (800) 572-8256, Fax: (703) 433-4483, Email:
OR-SLE0029A, 3600 River Road N (Lat: 44.978194 Lon: -123.025889), Type: Pole, Structure height: 30.5 m, Call Sign: WQKL256, Assigned Frequencies: 17965.0 MHz, 18015.0 MHz, 18065.0 MHz, 18115.0 MHz, Grant Date: 06/30/2009, Expiration Date: 06/30/2019, Cancellation Date: 05/02/2019, Certifier: Nadja S Sodos-Wallace, Registrant: Sprint Corporation, 12502 Sunrise Valley Drive, M/S: Varesa, Reston, VA 20196, Phone: (800) 572-8256, Fax: (703) 433-4483, Email:
OR-SLE0021B, 5710 Wndsor Island Road N (Lat: 45.005917 Lon: -123.045417), Type: Pole, Structure height: 36.6 m, Call Sign: WQKL303, Assigned Frequencies: 21825.0 MHz, 21875.0 MHz, 21925.0 MHz, 21975.0 MHz, 22025.0 MHz, Grant Date: 07/01/2009, Expiration Date: 07/01/2019, Cancellation Date: 05/02/2019, Certifier: Nadja S Sodos-Wallace, Registrant: Sprint Corporation, 12502 Sunrise Valley Drive, M/S: Varesa, Reston, VA 20196, Phone: (800) 572-8256, Fax: (703) 433-4483, Email:
OR-SLE0022C, 2715 Tepper Lane Ne (Lat: 45.013694 Lon: -123.001111), Type: Tower, Structure height: 38.4 m, Call Sign: WQKP351, Assigned Frequencies: 21975.0 MHz, Grant Date: 07/31/2009, Expiration Date: 07/31/2019, Cancellation Date: 05/02/2019, Certifier: Nadja S Sodos-Wallace, Registrant: Sprint Corporation, 12502 Sunrise Valley Drive, M/S: Varesa, Reston, VA 20196, Phone: (800) 572-8256, Fax: (703) 433-4483, Email:
PO60XC151, 5390 River Road (Lat: 45.002556 Lon: -123.024889), Type: Mtower, Structure height: 41.1 m, Overall height: 42.2 m, Call Sign: WQQT326, Assigned Frequencies: 23275.0 MHz, 23225.0 MHz, 23225.0 MHz, 23225.0 MHz, 23225.0 MHz, 23225.0 MHz, Grant Date: 02/26/2013, Expiration Date: 02/26/2023, Cancellation Date: 02/24/2023, Certifier: David Werblow, Registrant: T-Mobile Usa, Inc., 12920 Se 38th St, Bellevue, WA 98006, Phone: (425) 383-8401, Fax: (202) 799-5616, Email:
PO25XC074, 3700 Chemawa Road N (Po01441a) (Lat: 45.001556 Lon: -122.982639), Type: Ltower, Structure height: 78 m, Call Sign: WQYN704, Assigned Frequencies: 22025.0 MHz, 22025.0 MHz, 22025.0 MHz, 22025.0 MHz, 22025.0 MHz, Grant Date: 11/21/2016, Expiration Date: 11/21/2026, Cancellation Date: 02/27/2023, Certifier: David Werblow, Registrant: T-Mobile Usa, Inc., 12920 Se 38th St, Bellevue, WA 98006, Phone: (425) 383-8401, Fax: (425) 383-4840, Email:
KEIZER POLE, 930 Chemawa (Lat: 44.995278 Lon: -123.020611), Type: Pole, Structure height: 44.5 m, Overall height: 49.7 m, Call Sign: WRCU290, Assigned Frequencies: 11175.0 MHz, 10975.0 MHz, 11175.0 MHz, 10975.0 MHz, 11175.0 MHz, 10975.0 MHz, 11175.0 MHz, 10975.0 MHz, Grant Date: 01/31/2019, Expiration Date: 01/31/2029, Certifier: Mark Buchholz, Registrant: Adcomm Engineering LLC, 24751 E Hemlock Dr, Rhododendron, OR 97049, Phone: (425) 489-0125, Fax: (206) 374-2834, Email:
FCC Registered Amateur Radio Licenses: 277 (
See the full list of FCC Registered Amateur Radio Licenses in Keizer )
FAA Registered Aircraft: 36 (
See the full list of FAA Registered Aircraft in Keizer )
Home Mortgage Disclosure Act Aggregated Statistics For Year 2009(Based on 2 full and 2 partial tracts) A) FHA, FSA/RHS & VA B) Conventional C) Refinancings D) Home Improvement Loans E) Loans on Dwellings For 5+ Families F) Non-occupant Loans on G) Loans On Manufactured Number Average Value Number Average Value Number Average Value Number Average Value Number Average Value Number Average Value Number Average Value
LOANS ORIGINATED 105 $172,720 53 $157,092 500 $168,617 19 $110,110 5 $809,492 20 $140,256 10 $100,771 APPLICATIONS APPROVED, NOT ACCEPTED 7 $146,500 11 $140,996 60 $174,366 5 $37,764 0 $0 5 $130,930 4 $54,910 APPLICATIONS DENIED 20 $175,942 14 $118,909 195 $177,775 12 $66,540 0 $0 10 $138,891 10 $52,219 APPLICATIONS WITHDRAWN 9 $156,618 6 $158,852 127 $177,010 4 $118,242 0 $0 5 $116,932 2 $130,685 FILES CLOSED FOR INCOMPLETENESS 5 $148,800 3 $129,843 21 $167,333 0 $0 0 $0 0 $0 1 $71,620
Aggregated Statistics For Year 2008(Based on 2 full and 2 partial tracts) A) FHA, FSA/RHS & VA B) Conventional C) Refinancings D) Home Improvement Loans E) Loans on Dwellings For 5+ Families F) Non-occupant Loans on G) Loans On Manufactured Number Average Value Number Average Value Number Average Value Number Average Value Number Average Value Number Average Value Number Average Value
LOANS ORIGINATED 83 $195,661 91 $171,770 329 $171,080 28 $60,830 4 $1,214,208 30 $135,481 8 $64,169 APPLICATIONS APPROVED, NOT ACCEPTED 6 $201,667 20 $154,202 48 $174,710 10 $36,261 1 $418,870 6 $155,437 3 $46,213 APPLICATIONS DENIED 26 $200,898 28 $122,952 211 $170,121 65 $96,617 1 $492,400 11 $148,723 10 $61,177 APPLICATIONS WITHDRAWN 12 $169,014 13 $157,772 94 $188,880 4 $114,495 0 $0 7 $135,619 0 $0 FILES CLOSED FOR INCOMPLETENESS 0 $0 4 $173,845 27 $191,851 4 $72,900 0 $0 2 $183,980 0 $0
Aggregated Statistics For Year 2007(Based on 2 full and 2 partial tracts) A) FHA, FSA/RHS & VA B) Conventional C) Refinancings D) Home Improvement Loans E) Loans on Dwellings For 5+ Families F) Non-occupant Loans on G) Loans On Manufactured Number Average Value Number Average Value Number Average Value Number Average Value Number Average Value Number Average Value Number Average Value
LOANS ORIGINATED 26 $181,702 273 $154,469 474 $151,106 48 $86,289 3 $1,002,950 75 $141,971 13 $56,657 APPLICATIONS APPROVED, NOT ACCEPTED 4 $145,532 51 $146,634 108 $127,722 11 $113,841 0 $0 20 $109,732 8 $55,588 APPLICATIONS DENIED 3 $151,523 72 $144,815 259 $149,047 53 $82,326 1 $191,850 29 $124,583 15 $47,078 APPLICATIONS WITHDRAWN 0 $0 37 $161,563 113 $155,572 18 $116,691 1 $364,520 13 $152,371 1 $19,190 FILES CLOSED FOR INCOMPLETENESS 1 $216,660 10 $149,019 43 $173,692 3 $110,247 0 $0 4 $155,340 0 $0
Aggregated Statistics For Year 2006(Based on 2 full and 2 partial tracts) A) FHA, FSA/RHS & VA B) Conventional C) Refinancings D) Home Improvement Loans E) Loans on Dwellings For 5+ Families F) Non-occupant Loans on G) Loans On Manufactured Number Average Value Number Average Value Number Average Value Number Average Value Number Average Value Number Average Value Number Average Value
LOANS ORIGINATED 28 $173,317 430 $125,016 518 $134,353 63 $66,404 6 $528,738 111 $133,042 13 $76,001 APPLICATIONS APPROVED, NOT ACCEPTED 2 $155,600 72 $115,498 116 $120,268 8 $52,320 1 $159,880 22 $117,820 6 $80,572 APPLICATIONS DENIED 2 $179,355 108 $111,477 265 $125,915 63 $72,411 0 $0 28 $134,858 24 $48,649 APPLICATIONS WITHDRAWN 1 $194,560 45 $124,854 158 $139,258 6 $85,312 1 $175,860 17 $108,857 0 $0 FILES CLOSED FOR INCOMPLETENESS 1 $68,430 13 $132,172 63 $151,211 1 $35,170 0 $0 5 $147,940 0 $0
Aggregated Statistics For Year 2005(Based on 2 full and 2 partial tracts) A) FHA, FSA/RHS & VA B) Conventional C) Refinancings D) Home Improvement Loans E) Loans on Dwellings For 5+ Families F) Non-occupant Loans on G) Loans On Manufactured Number Average Value Number Average Value Number Average Value Number Average Value Number Average Value Number Average Value Number Average Value
LOANS ORIGINATED 34 $153,838 566 $109,917 478 $122,278 39 $46,623 7 $956,350 122 $121,691 5 $69,272 APPLICATIONS APPROVED, NOT ACCEPTED 7 $151,139 72 $106,855 110 $119,079 7 $49,863 0 $0 13 $112,598 8 $36,911 APPLICATIONS DENIED 3 $132,987 93 $101,097 276 $120,638 42 $47,615 0 $0 21 $114,362 15 $68,464 APPLICATIONS WITHDRAWN 6 $160,375 54 $115,056 205 $138,671 22 $108,504 0 $0 25 $116,820 2 $97,700 FILES CLOSED FOR INCOMPLETENESS 2 $173,665 19 $112,515 61 $136,862 1 $15,990 0 $0 4 $145,428 0 $0
Aggregated Statistics For Year 2004(Based on 2 full and 2 partial tracts) A) FHA, FSA/RHS & VA B) Conventional C) Refinancings D) Home Improvement Loans E) Loans on Dwellings For 5+ Families F) Non-occupant Loans on G) Loans On Manufactured Number Average Value Number Average Value Number Average Value Number Average Value Number Average Value Number Average Value Number Average Value
LOANS ORIGINATED 50 $137,574 441 $110,860 487 $118,305 27 $80,193 7 $645,966 90 $115,066 5 $94,672 APPLICATIONS APPROVED, NOT ACCEPTED 3 $151,597 63 $105,932 94 $121,536 12 $73,607 2 $143,185 15 $92,983 8 $53,142 APPLICATIONS DENIED 4 $132,488 106 $96,978 243 $115,157 53 $77,951 0 $0 18 $105,855 15 $40,931 APPLICATIONS WITHDRAWN 5 $117,394 50 $111,515 178 $123,596 12 $111,811 0 $0 19 $110,349 3 $140,067 FILES CLOSED FOR INCOMPLETENESS 3 $121,853 9 $90,128 43 $147,658 2 $36,345 0 $0 4 $94,802 0 $0
Aggregated Statistics For Year 2003(Based on 2 full and 2 partial tracts) A) FHA, FSA/RHS & VA B) Conventional C) Refinancings D) Home Improvement Loans E) Loans on Dwellings For 5+ Families F) Non-occupant Loans on Number Average Value Number Average Value Number Average Value Number Average Value Number Average Value Number Average Value
LOANS ORIGINATED 85 $128,863 335 $112,890 1,091 $111,604 45 $24,097 10 $888,091 141 $102,420 APPLICATIONS APPROVED, NOT ACCEPTED 8 $146,854 37 $113,427 130 $109,807 10 $35,288 0 $0 7 $106,423 APPLICATIONS DENIED 14 $136,282 64 $92,341 282 $109,821 25 $21,387 2 $513,575 15 $87,441 APPLICATIONS WITHDRAWN 7 $153,710 30 $106,443 157 $112,771 1 $15,350 0 $0 9 $104,423 FILES CLOSED FOR INCOMPLETENESS 1 $108,840 8 $122,342 36 $102,847 1 $22,710 0 $0 4 $102,742
Aggregated Statistics For Year 2002(Based on 1 partial tract) A) FHA, FSA/RHS & VA B) Conventional C) Refinancings D) Home Improvement Loans E) Loans on Dwellings For 5+ Families F) Non-occupant Loans on Number Average Value Number Average Value Number Average Value Number Average Value Number Average Value Number Average Value
LOANS ORIGINATED 27 $130,032 118 $127,076 265 $120,349 13 $20,071 1 $908,090 39 $95,794 APPLICATIONS APPROVED, NOT ACCEPTED 2 $109,355 13 $138,378 42 $116,709 3 $25,153 0 $0 6 $85,907 APPLICATIONS DENIED 3 $133,870 15 $83,561 58 $120,634 12 $16,361 0 $0 4 $116,070 APPLICATIONS WITHDRAWN 2 $128,220 10 $128,476 30 $125,960 1 $3,200 0 $0 1 $127,260 FILES CLOSED FOR INCOMPLETENESS 0 $0 1 $23,020 10 $120,802 1 $6,400 0 $0 1 $54,360
Aggregated Statistics For Year 2001(Based on 1 partial tract) A) FHA, FSA/RHS & VA B) Conventional C) Refinancings D) Home Improvement Loans E) Loans on Dwellings For 5+ Families F) Non-occupant Loans on Number Average Value Number Average Value Number Average Value Number Average Value Number Average Value Number Average Value
LOANS ORIGINATED 32 $120,026 103 $121,319 223 $111,557 20 $24,077 3 $705,370 17 $84,226 APPLICATIONS APPROVED, NOT ACCEPTED 3 $136,640 15 $91,491 26 $82,323 1 $12,790 0 $0 3 $58,620 APPLICATIONS DENIED 3 $147,510 26 $72,411 59 $93,595 15 $11,596 1 $81,220 8 $66,508 APPLICATIONS WITHDRAWN 3 $149,003 10 $130,202 49 $104,917 4 $51,480 0 $0 3 $112,127 FILES CLOSED FOR INCOMPLETENESS 1 $72,900 5 $82,880 12 $92,781 2 $38,690 0 $0 1 $46,680
Aggregated Statistics For Year 2000(Based on 1 partial tract) A) FHA, FSA/RHS & VA B) Conventional C) Refinancings D) Home Improvement Loans F) Non-occupant Loans on Number Average Value Number Average Value Number Average Value Number Average Value Number Average Value
LOANS ORIGINATED 29 $117,095 90 $112,673 50 $96,488 24 $27,232 11 $76,449 APPLICATIONS APPROVED, NOT ACCEPTED 5 $114,982 15 $79,213 13 $74,526 6 $12,790 3 $68,213 APPLICATIONS DENIED 4 $149,002 24 $71,278 33 $80,848 18 $26,966 2 $69,065 APPLICATIONS WITHDRAWN 3 $87,187 7 $136,396 16 $77,779 1 $74,820 1 $83,140 FILES CLOSED FOR INCOMPLETENESS 0 $0 1 $18,550 5 $86,076 1 $26,860 1 $36,450
Aggregated Statistics For Year 1999(Based on 2 partial tracts) A) FHA, FSA/RHS & VA B) Conventional C) Refinancings D) Home Improvement Loans E) Loans on Dwellings For 5+ Families F) Non-occupant Loans on Number Average Value Number Average Value Number Average Value Number Average Value Number Average Value Number Average Value
LOANS ORIGINATED 74 $109,465 278 $106,020 379 $93,880 76 $15,894 2 $268,800 46 $97,810 APPLICATIONS APPROVED, NOT ACCEPTED 11 $121,228 39 $128,571 63 $80,697 22 $23,929 0 $0 5 $129,142 APPLICATIONS DENIED 16 $106,744 117 $82,419 164 $192,313 54 $22,178 0 $0 12 $73,020 APPLICATIONS WITHDRAWN 5 $110,856 24 $117,530 80 $96,258 10 $61,423 1 $57,110 9 $117,982 FILES CLOSED FOR INCOMPLETENESS 6 $105,138 14 $108,920 36 $97,758 1 $30,130 0 $0 1 $59,770
Detailed HMDA statistics for the following Tracts:
0014.00
, 0015.01 , 0015.02 , 0015.03
Private Mortgage Insurance Companies Aggregated Statistics For Year 2009(Based on 2 full and 2 partial tracts) A) Conventional B) Refinancings Number Average Value Number Average Value
LOANS ORIGINATED 6 $220,083 5 $198,842 APPLICATIONS APPROVED, NOT ACCEPTED 3 $224,873 6 $189,715 APPLICATIONS DENIED 1 $135,200 0 $0 APPLICATIONS WITHDRAWN 1 $244,920 0 $0 FILES CLOSED FOR INCOMPLETENESS 0 $0 1 $135,570
Aggregated Statistics For Year 2008(Based on 2 full and 2 partial tracts) A) Conventional B) Refinancings C) Non-occupant Loans on Number Average Value Number Average Value Number Average Value
LOANS ORIGINATED 38 $195,917 29 $194,728 2 $154,325 APPLICATIONS APPROVED, NOT ACCEPTED 19 $198,157 17 $220,850 3 $161,837 APPLICATIONS DENIED 2 $175,825 1 $135,570 1 $211,350 APPLICATIONS WITHDRAWN 1 $276,900 0 $0 0 $0 FILES CLOSED FOR INCOMPLETENESS 1 $210,360 0 $0 0 $0
Aggregated Statistics For Year 2007(Based on 2 full and 2 partial tracts) A) Conventional B) Refinancings C) Non-occupant Loans on Number Average Value Number Average Value Number Average Value
LOANS ORIGINATED 83 $197,829 44 $194,626 6 $165,492 APPLICATIONS APPROVED, NOT ACCEPTED 13 $205,269 5 $167,554 1 $167,890 APPLICATIONS DENIED 1 $210,020 2 $182,120 0 $0 APPLICATIONS WITHDRAWN 5 $244,480 2 $169,995 1 $336,770 FILES CLOSED FOR INCOMPLETENESS 1 $268,810 0 $0 0 $0
Aggregated Statistics For Year 2006(Based on 2 full and 2 partial tracts) A) Conventional B) Refinancings C) Non-occupant Loans on Number Average Value Number Average Value Number Average Value
LOANS ORIGINATED 34 $181,621 20 $165,026 5 $188,496 APPLICATIONS APPROVED, NOT ACCEPTED 4 $158,450 5 $272,138 2 $146,785 APPLICATIONS DENIED 0 $0 1 $140,830 0 $0 APPLICATIONS WITHDRAWN 1 $141,810 0 $0 0 $0 FILES CLOSED FOR INCOMPLETENESS 0 $0 0 $0 0 $0
Aggregated Statistics For Year 2005(Based on 2 full and 2 partial tracts) A) Conventional B) Refinancings C) Non-occupant Loans on D) Loans On Manufactured Number Average Value Number Average Value Number Average Value Number Average Value
LOANS ORIGINATED 43 $147,762 31 $160,218 4 $147,420 1 $114,790 APPLICATIONS APPROVED, NOT ACCEPTED 5 $178,308 6 $151,982 1 $169,610 0 $0 APPLICATIONS DENIED 0 $0 0 $0 0 $0 0 $0 APPLICATIONS WITHDRAWN 2 $156,185 3 $155,560 1 $78,020 0 $0 FILES CLOSED FOR INCOMPLETENESS 1 $196,530 0 $0 0 $0 0 $0
Aggregated Statistics For Year 2004(Based on 2 full and 2 partial tracts) A) Conventional B) Refinancings C) Non-occupant Loans on D) Loans On Manufactured Number Average Value Number Average Value Number Average Value Number Average Value
LOANS ORIGINATED 42 $145,694 46 $131,179 7 $106,391 1 $115,220 APPLICATIONS APPROVED, NOT ACCEPTED 8 $138,162 22 $146,953 5 $158,880 0 $0 APPLICATIONS DENIED 1 $200,670 1 $119,890 0 $0 0 $0 APPLICATIONS WITHDRAWN 2 $171,680 7 $130,501 2 $176,400 0 $0 FILES CLOSED FOR INCOMPLETENESS 0 $0 0 $0 0 $0 0 $0
Aggregated Statistics For Year 2003(Based on 2 full and 2 partial tracts) A) Conventional B) Refinancings C) Non-occupant Loans on Number Average Value Number Average Value Number Average Value
LOANS ORIGINATED 62 $138,607 123 $133,484 11 $122,025 APPLICATIONS APPROVED, NOT ACCEPTED 7 $100,290 26 $137,651 0 $0 APPLICATIONS DENIED 2 $105,790 4 $115,638 1 $160,920 APPLICATIONS WITHDRAWN 1 $175,220 7 $138,091 0 $0 FILES CLOSED FOR INCOMPLETENESS 0 $0 0 $0 0 $0
Aggregated Statistics For Year 2002(Based on 1 partial tract) A) Conventional B) Refinancings C) Non-occupant Loans on Number Average Value Number Average Value Number Average Value
LOANS ORIGINATED 28 $141,672 29 $137,978 1 $149,000 APPLICATIONS APPROVED, NOT ACCEPTED 2 $154,760 3 $126,193 0 $0 APPLICATIONS DENIED 1 $71,620 2 $128,540 0 $0 APPLICATIONS WITHDRAWN 1 $75,460 3 $185,243 0 $0 FILES CLOSED FOR INCOMPLETENESS 0 $0 0 $0 0 $0
Aggregated Statistics For Year 2001(Based on 1 partial tract) A) Conventional B) Refinancings C) Non-occupant Loans on Number Average Value Number Average Value Number Average Value
LOANS ORIGINATED 31 $143,578 31 $135,430 3 $80,363 APPLICATIONS APPROVED, NOT ACCEPTED 3 $99,123 4 $174,105 0 $0 APPLICATIONS DENIED 1 $230,220 3 $134,933 0 $0 APPLICATIONS WITHDRAWN 1 $88,250 2 $112,870 1 $63,310 FILES CLOSED FOR INCOMPLETENESS 0 $0 0 $0 0 $0
Aggregated Statistics For Year 2000(Based on 1 partial tract) A) Conventional B) Refinancings C) Non-occupant Loans on Number Average Value Number Average Value Number Average Value
LOANS ORIGINATED 29 $126,776 4 $133,175 1 $48,600 APPLICATIONS APPROVED, NOT ACCEPTED 3 $115,323 1 $203,360 1 $55,000 APPLICATIONS DENIED 1 $71,620 1 $183,540 0 $0 APPLICATIONS WITHDRAWN 0 $0 0 $0 0 $0 FILES CLOSED FOR INCOMPLETENESS 0 $0 1 $72,260 0 $0
Aggregated Statistics For Year 1999(Based on 2 partial tracts) A) Conventional B) Refinancings C) Non-occupant Loans on Number Average Value Number Average Value Number Average Value
LOANS ORIGINATED 86 $127,574 56 $110,731 2 $100,325 APPLICATIONS APPROVED, NOT ACCEPTED 8 $110,641 11 $121,896 1 $51,140 APPLICATIONS DENIED 6 $123,885 4 $117,852 0 $0 APPLICATIONS WITHDRAWN 2 $99,765 2 $90,125 0 $0 FILES CLOSED FOR INCOMPLETENESS 1 $78,860 0 $0 0 $0
Detailed PMIC statistics for the following Tracts:
0014.00
, 0015.01 , 0015.02 , 0015.03 Keizer compared to Oregon state average:
Unemployed percentage below state average. Black race population percentage below state average. Hispanic race population percentage above state average. Length of stay since moving in significantly above state average.
Top Patent Applicants
Tove C. Bolken (15)
Tove Bolken (4)
Stewart W. Evans (3)
John Nason (2)
David Russel Sponable (2)
Adam Purdue (2)
Ryan S. Hall (2)
Greg A. Hildebrand (2)
David R. Sponable (2)
Nabil G. Mistkawi (2)
Total of 57 patent applications in 2008-2024.

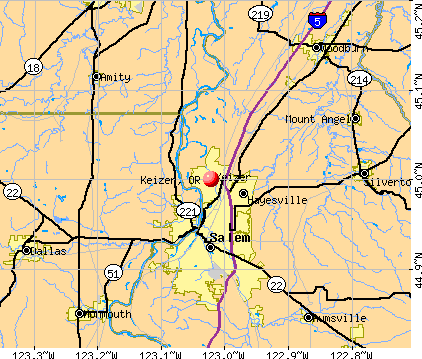


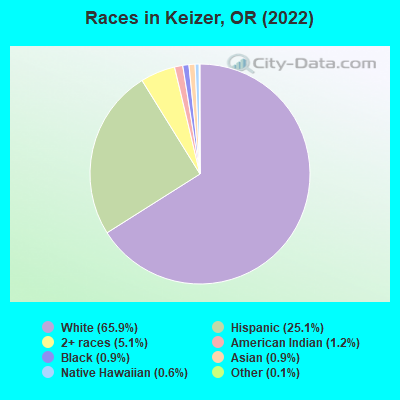
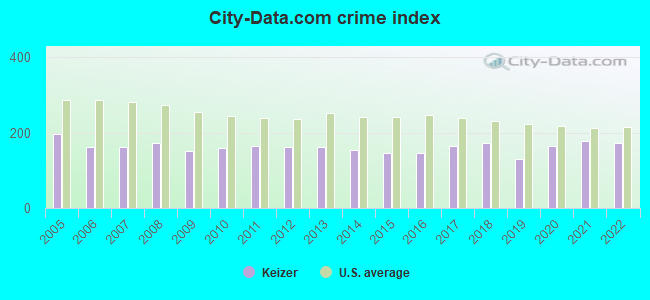
 Recent articles from our blog. Our writers, many of them Ph.D. graduates or candidates, create easy-to-read articles on a wide variety of topics.

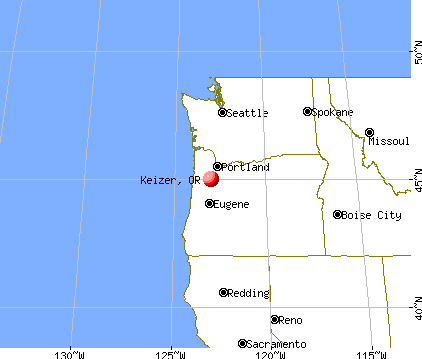
 (4.8 miles
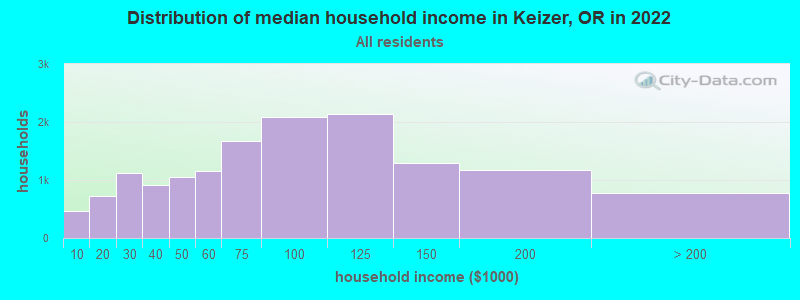
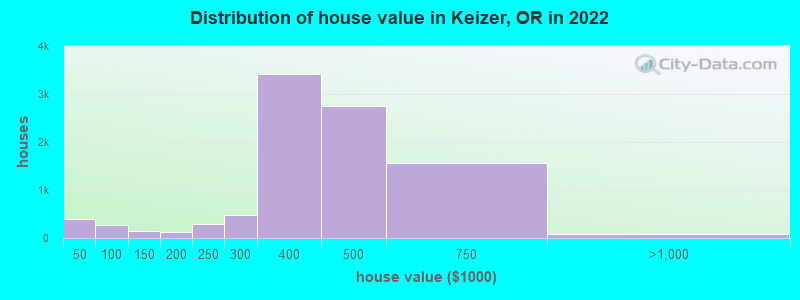
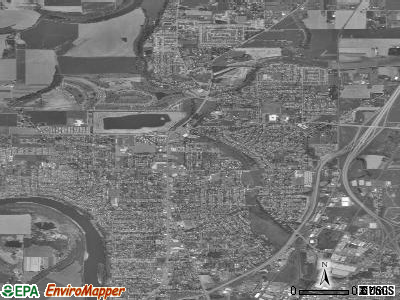
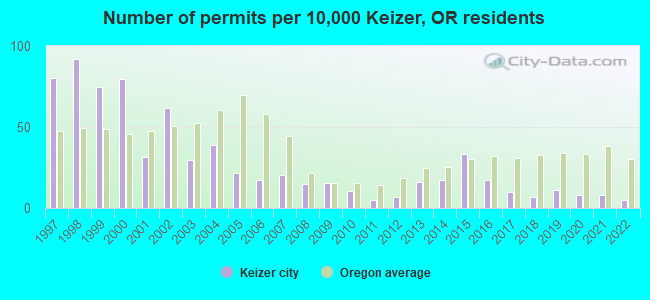
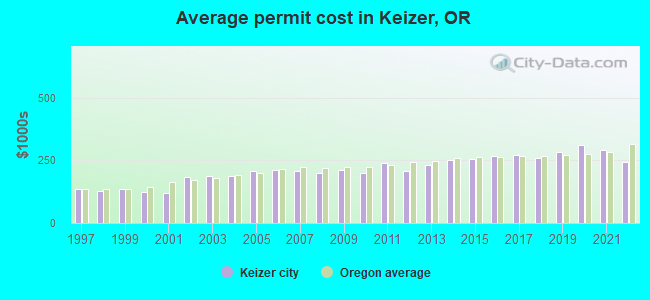
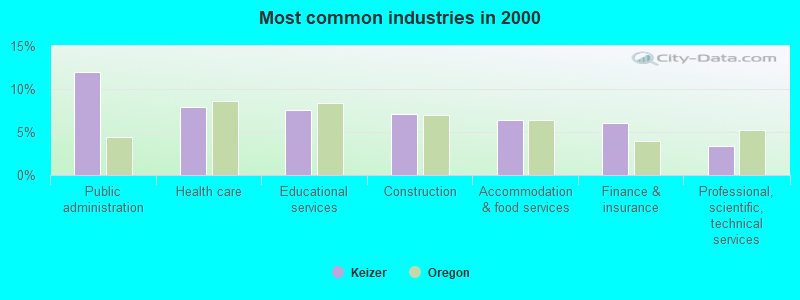
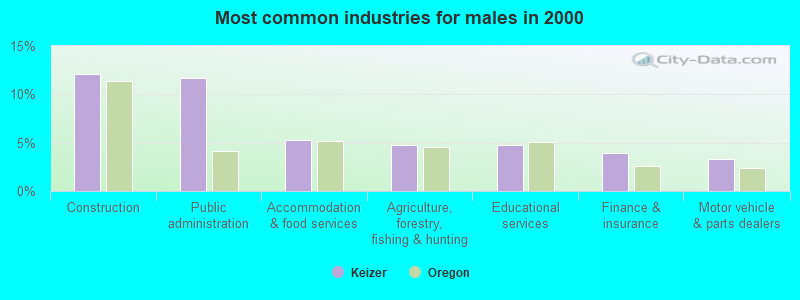
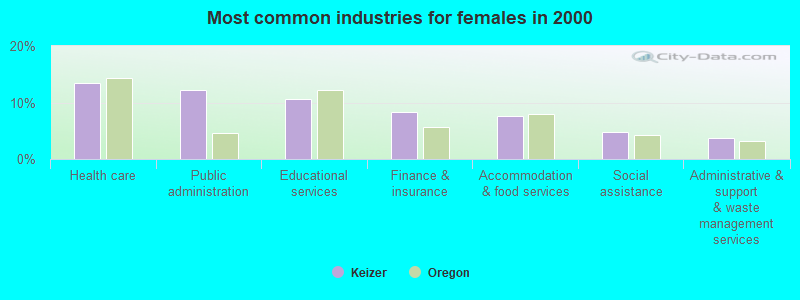
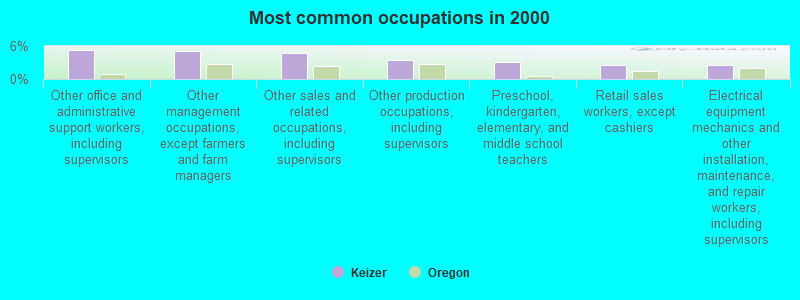
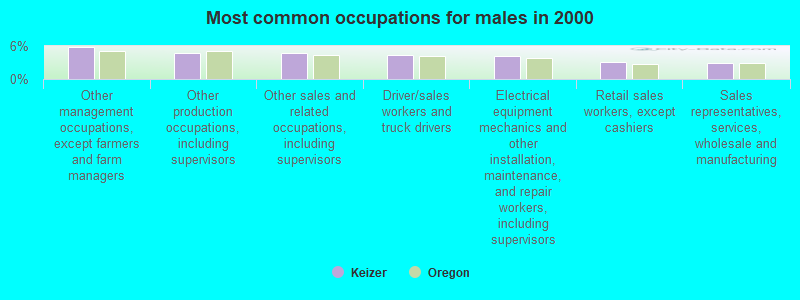
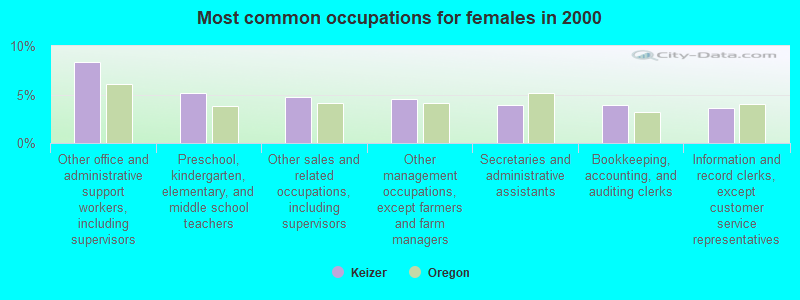


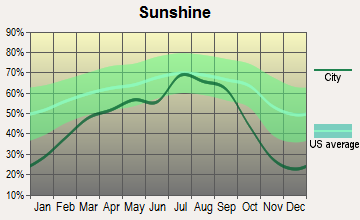


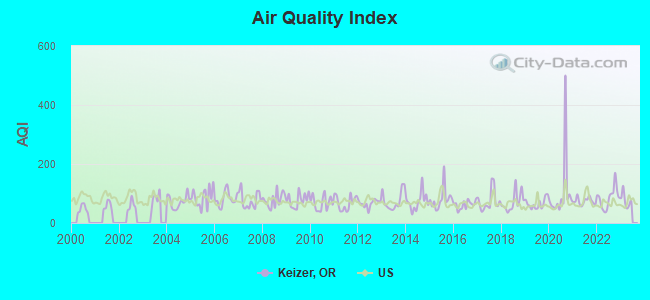
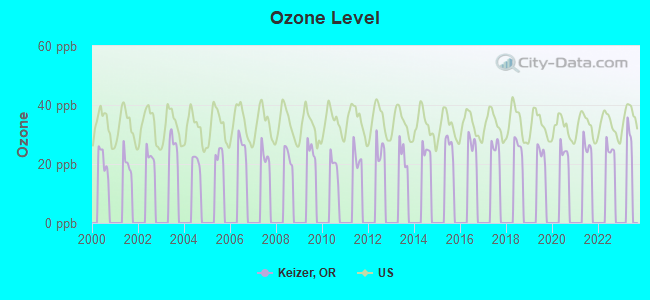
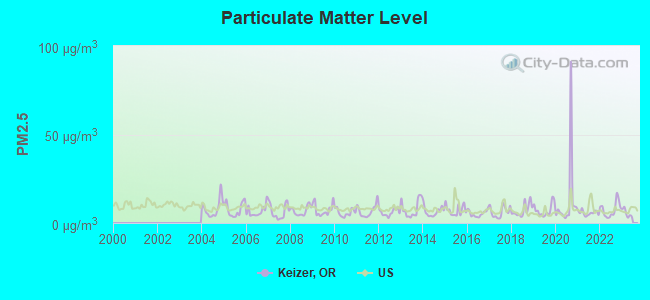
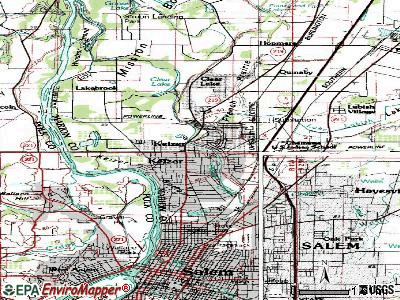
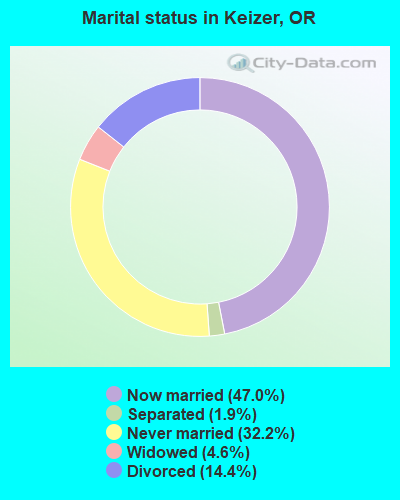
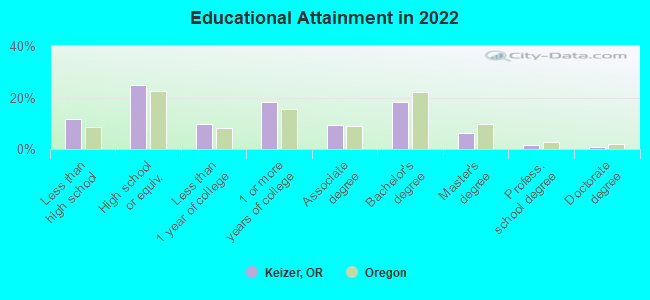
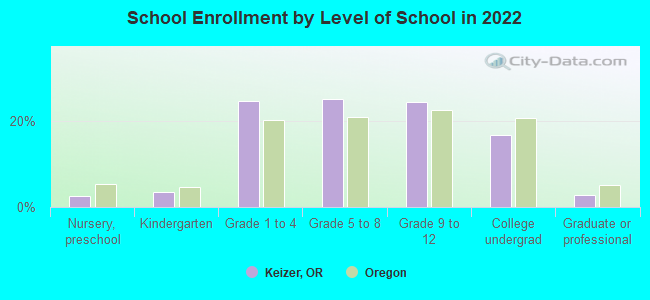
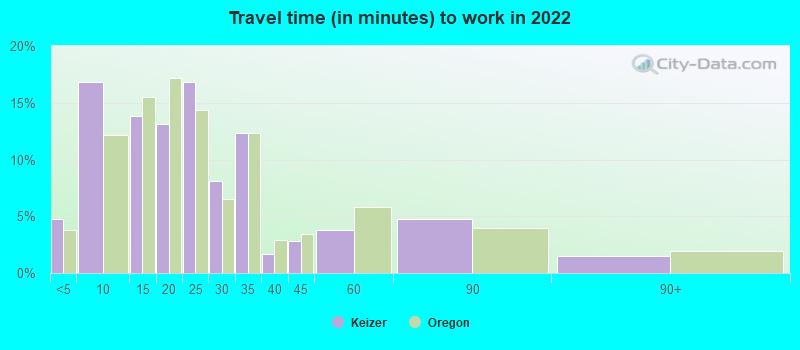
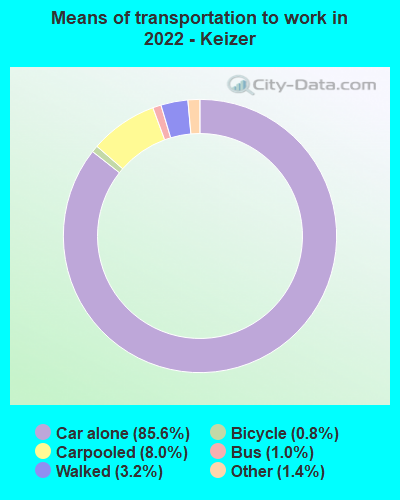

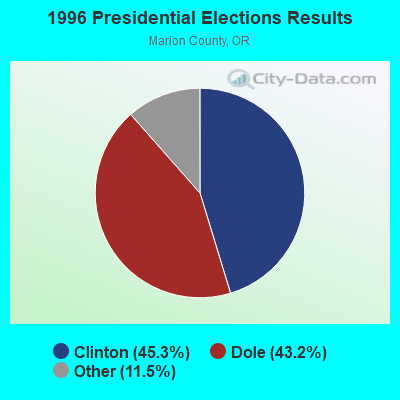
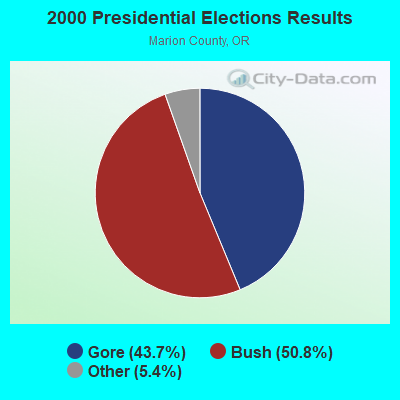
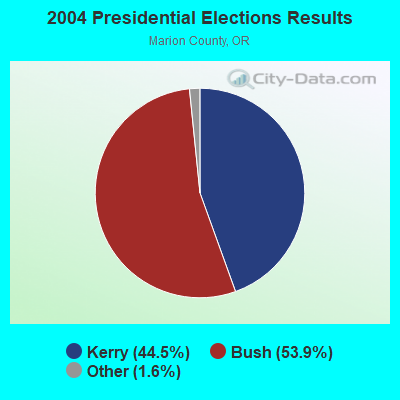
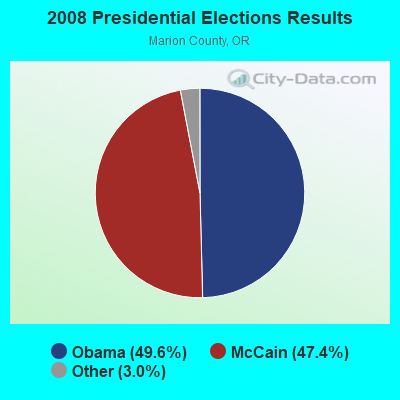
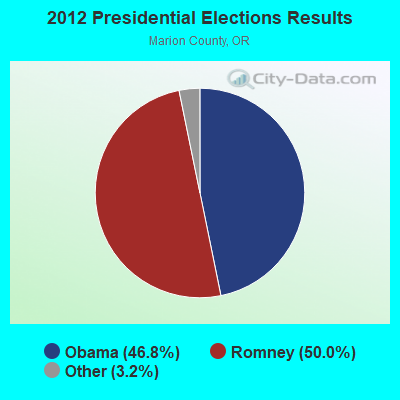
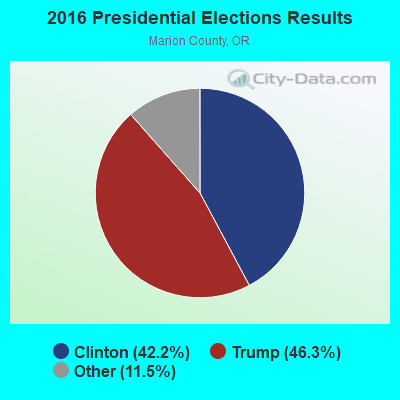
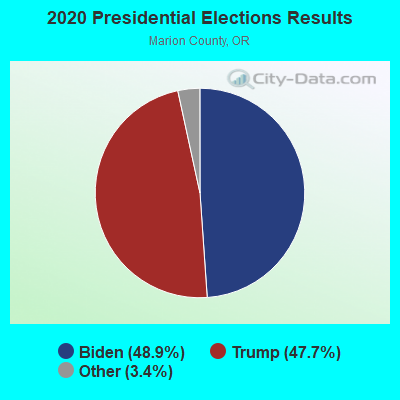
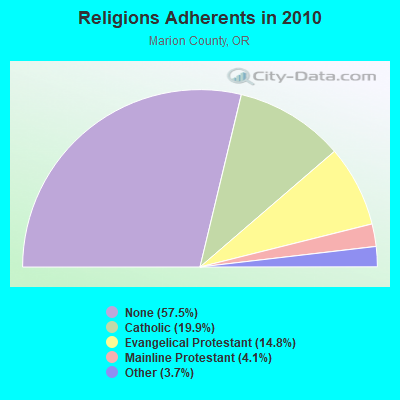
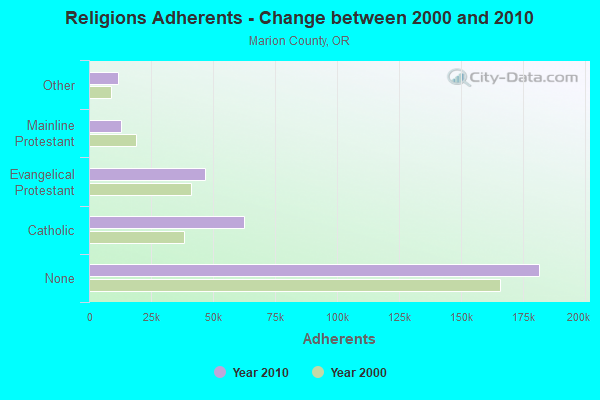
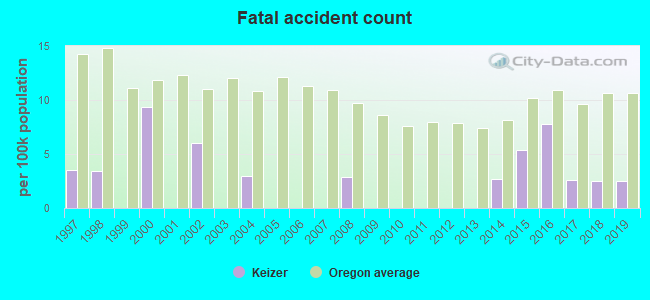
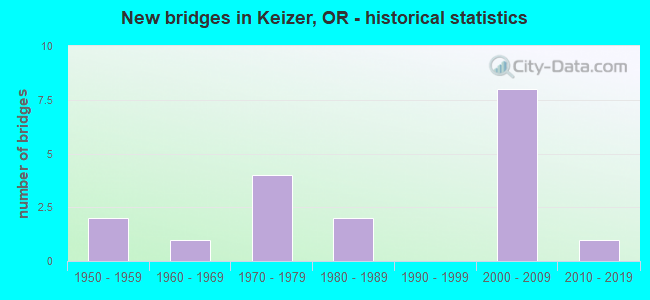
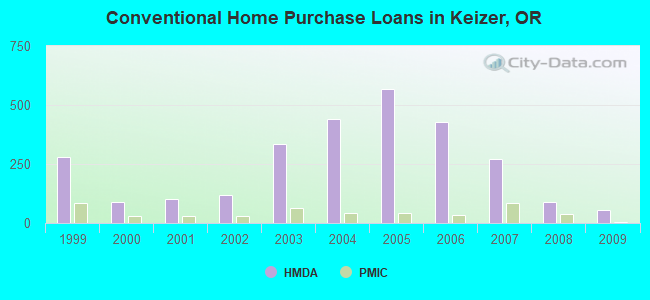
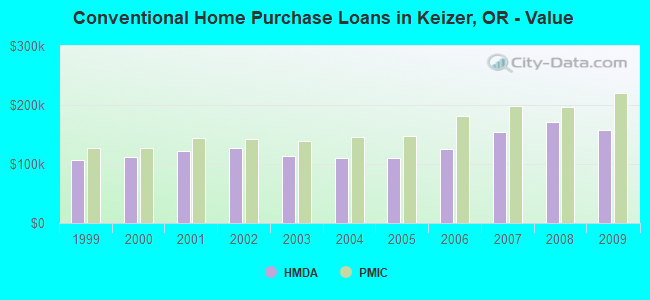
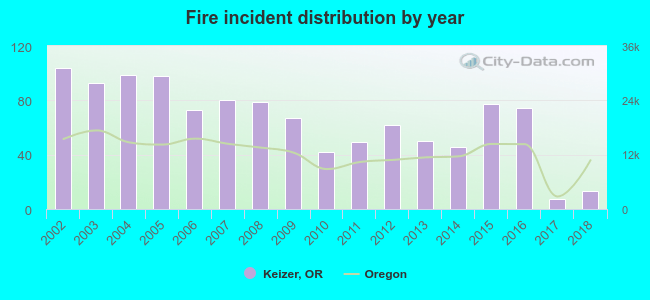 According to the data from the years 2002 - 2018 the average number of fire incidents per year is 65. The highest number of reported fires - 104 took place in 2002, and the least - 7 in 2017. The data has a decreasing trend.
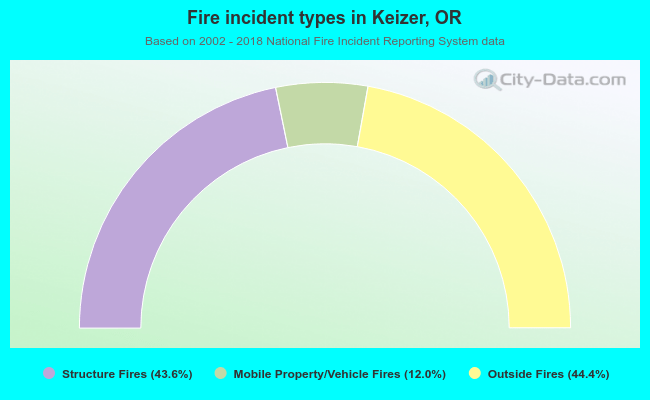 When looking into fire subcategories, the most incidents belonged to: Outside Fires (44.4%), and Structure Fires (43.6%).