Hull, Massachusetts

Hull: The Beautiful Bay in Hull, MA

Hull: Sunrise on September 11, 2006

Hull: Hull, MA - Nantasket Beach Entry

Hull: View of Nantasket Beach on a foggy December day.

Hull: Sunset off Marginal Road toward Boston

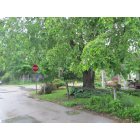
Hull: A street Beach & Dune

Hull: Hull Sunrise

Hull: Beach Sunset A Street
Hull

Hull: Sunset on A Street Beach
Hull
- see
16
more - add
your
Submit your own pictures of this place and show them to the world
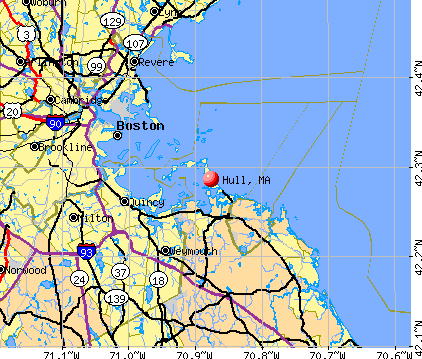
- OSM Map
- General Map
- Google Map
- MSN Map
Population change since 2000: -6.9%
| Males: 4,739 | |
| Females: 5,554 |
| Median resident age: | 54.6 years |
| Massachusetts median age: | 40.3 years |
Zip codes: 02045.
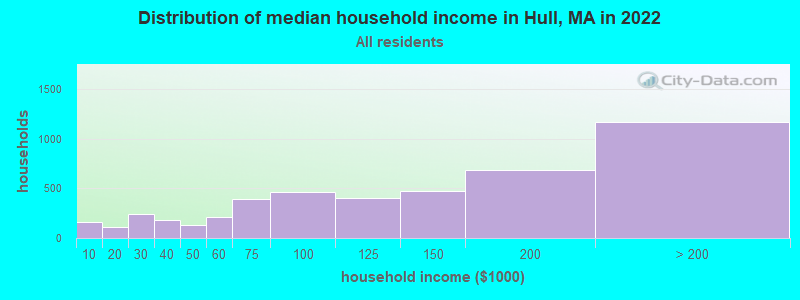
| Hull: | $125,332 |
| MA: | $94,488 |
Estimated per capita income in 2022: $70,573 (it was $26,331 in 2000)
Hull CDP income, earnings, and wages data
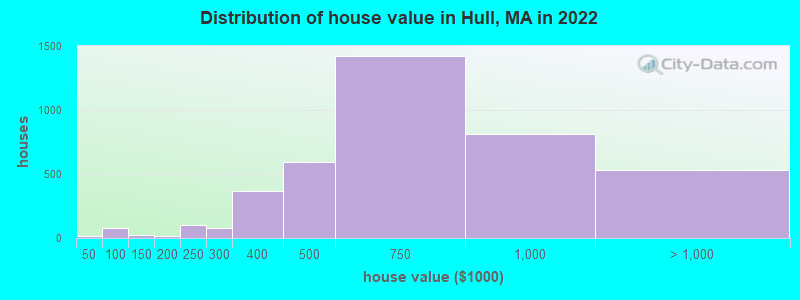
Estimated median house or condo value in 2022: $643,128 (it was $178,500 in 2000)
| Hull: | $643,128 |
| MA: | $534,700 |
Mean prices in 2022: all housing units: $652,493; detached houses: $679,831; townhouses or other attached units: $544,701; in 2-unit structures: $727,837; in 3-to-4-unit structures: $446,360; in 5-or-more-unit structures: $503,169
Median gross rent in 2022: $1,819.
(3.7% for White Non-Hispanic residents, 19.4% for Hispanic or Latino residents)
Detailed information about poverty and poor residents in Hull, MA

Compare current foreclosures near Hull, MA:
| Photo | Address | Area | Beds / Baths | Price | Details |
|---|---|---|---|---|---|

|
#1
Sagamore Ter
Hull, MA 02045
|
1,358 sq. feet
|
2 baths 3 beds |
show details | |

|
#2
2nd St
Hull, MA 02045
|
1,624 sq. feet
|
1 baths 4 beds |
show details | |

|
#3
Hampton Cir
Hull, MA 02045
|
772 sq. feet
|
1 baths 1 beds |
show details | |

|
#4
Hillside Rd
Hull, MA 02045
|
1,664 sq. feet
|
2 baths 4 beds |
show details | |

|
#5
Nantasket Ave
Hull, MA 02045
|
1,872 sq. feet
|
1 baths 3 beds |
show details | |

|
#6
Reef Pt
Hull, MA 02045
|
4,163 sq. feet
|
5 baths 7 beds |
show details | |

|
#7
Bay St
Hull, MA 02045
|
720 sq. feet
|
1 baths 4 beds |
show details | |

|
#8
Delewanda Rd
Hull, MA 02045
|
3,090 sq. feet
|
2 baths 3 beds |
show details | |

|
#9
Mayflower Ave
Hull, MA 02045
|
1,056 sq. feet
|
1 baths 3 beds |
show details | |

|
#10
Island View Rd
Hull, MA 02045
|
1,680 sq. feet
|
1 baths 1 beds |
show details |
| Photo | Address | Area | Beds / Baths | Price | Details |
|---|---|---|---|---|---|

|
#11
N Truro St
Hull, MA 02045
|
1,868 sq. feet
|
2 baths 3 beds |
show details | |

|
#12
Malta St
Hull, MA 02045
|
4,915 sq. feet
|
8 baths - beds |
show details | |

|
#13
Delewanda Rd
Hull, MA 02045
|
- sq. feet
|
- baths - beds |
show details | |

|
#14
Johnson Rd
North Weymouth, MA 02191
|
748 sq. feet
|
1 baths 2 beds |
$365,000
|
show details |

|
#15
Prospect St
Norwell, MA 02061
|
5,483 sq. feet
|
5 baths 5 beds |
$1,760,000
|
show details |

|
#16
Tall Oaks Dr Unit 508
South Weymouth, MA 02190
|
1,300 sq. feet
|
2 baths 2 beds |
$285,000
|
show details |

|
#17
Adams St
Hyde Park, MA 02136
|
1,988 sq. feet
|
2 baths 4 beds |
$499,200
|
show details |

|
#18
Boyd St
Boston, MA 02124
|
3,970 sq. feet
|
3 baths 9 beds |
$650,000
|
show details |

|
#19
Church St
Boston, MA 02122
|
3,663 sq. feet
|
3 baths 6 beds |
show details | |

|
#20
Bittersweet Ln
Randolph, MA 02368
|
882 sq. feet
|
1 baths 2 beds |
show details |
| Photo | Address | Area | Beds / Baths | Price | Details |
|---|---|---|---|---|---|

|
#21
Geneva Ave
Boston, MA 02121
|
3,980 sq. feet
|
3 baths 8 beds |
show details | |

|
#22
Bedford St
Whitman, MA 02382
|
2,024 sq. feet
|
3 baths 3 beds |
show details | |

|
#23
Sydney St
Medford, MA 02155
|
1,227 sq. feet
|
1 baths 3 beds |
show details | |

|
#24
Fountain St
Medford, MA 02155
|
1,476 sq. feet
|
1 baths 3 beds |
show details | |

|
#25
Brookview St
Boston, MA 02124
|
1,961 sq. feet
|
2 baths 5 beds |
show details | |

|
#26
Chatham St
Lynn, MA 01902
|
2,855 sq. feet
|
3 baths 4 beds |
show details | |

|
#27
Richard St
Medford, MA 02155
|
1,979 sq. feet
|
3 baths 3 beds |
show details | |

|
#28
Richmond St
Boston, MA 02124
|
2,516 sq. feet
|
2 baths 4 beds |
show details | |

|
#29
Eastern Ave
Malden, MA 02148
|
2,288 sq. feet
|
3 baths 4 beds |
show details | |

|
#30
Wakullah St
Boston, MA 02119
|
2,624 sq. feet
|
2 baths 5 beds |
show details |
| Photo | Address | Area | Beds / Baths | Price | Details |
|---|---|---|---|---|---|

|
#31
Crickett Ln
Randolph, MA 02368
|
1,480 sq. feet
|
2 baths 3 beds |
show details | |

|
#32
Eastern Ave
Lynn, MA 01902
|
1,881 sq. feet
|
1 baths 4 beds |
show details | |

|
#33
Water St
Hanover, MA 02339
|
1,681 sq. feet
|
2 baths 3 beds |
show details | |

|
#34
Great Woods Rd
Lynn, MA 01904
|
943 sq. feet
|
1 baths 2 beds |
show details | |

|
#35
Hammond St Unit E205
Chestnut Hill, MA 02467
|
1,170 sq. feet
|
2 baths 2 beds |
show details | |

|
#36
Bolton St # A
Cambridge, MA 02140
|
1,047 sq. feet
|
3 baths 2 beds |
show details | |

|
#37
E St # 19s
Boston, MA 02127
|
1,350 sq. feet
|
2 baths 2 beds |
show details | |

|
#38
Kimberly Dr
Whitman, MA 02382
|
1,566 sq. feet
|
2 baths 3 beds |
show details | |

|
#39
Miami Ter
West Roxbury, MA 02132
|
1,142 sq. feet
|
2 baths 2 beds |
show details | |

|
#40
Nectar Pl
Nahant, MA 01908
|
7,671 sq. feet
|
5 baths 4 beds |
show details |
| Photo | Address | Area | Beds / Baths | Price | Details |
|---|---|---|---|---|---|

|
#41
Gladstone St
Boston, MA 02128
|
2,184 sq. feet
|
2 baths 6 beds |
show details | |

|
#42
Mystic Valley Pkwy Apt 101
Medford, MA 02155
|
1,229 sq. feet
|
2 baths 2 beds |
show details | |

|
#43
Fabyan St
Boston, MA 02124
|
4,140 sq. feet
|
3 baths 9 beds |
show details | |

|
#44
Welles Ave
Boston, MA 02124
|
3,903 sq. feet
|
4 baths 6 beds |
show details | |

|
#45
South St Apt 8
Brighton, MA 02135
|
784 sq. feet
|
1 baths 1 beds |
show details | |

|
#46
Laurie Ave
West Roxbury, MA 02132
|
873 sq. feet
|
1 baths 2 beds |
show details | |

|
#47
Spring St Apt D1
West Roxbury, MA 02132
|
786 sq. feet
|
1 baths 2 beds |
show details | |

|
#48
Keystone St
West Roxbury, MA 02132
|
1,464 sq. feet
|
2 baths 3 beds |
show details | |

|
#49
Rogers Ave
Lynn, MA 01902
|
3,677 sq. feet
|
3 baths 9 beds |
show details | |

|
Check over 1 million property listings on Foreclosure.com!
|
browse all offers | |||


- 9,46793.0%White alone
- 2132.1%Two or more races
- 1631.6%Asian alone
- 1161.1%Other race alone
- 660.6%Hispanic
- 70.07%Black alone
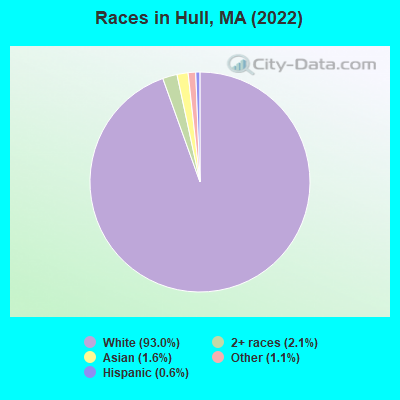
Races in Hull detailed stats: ancestries, foreign born residents, place of birth
According to our research of Massachusetts and other state lists, there were 5 registered sex offenders living in Hull, Massachusetts as of May 31, 2024.
The ratio of all residents to sex offenders in Hull is 2,116 to 1.
The ratio of registered sex offenders to all residents in this city is lower than the state average.
Type |
2009 |
2010 |
2011 |
2012 |
2013 |
2014 |
2015 |
2016 |
2017 |
2018 |
2019 |
2020 |
2021 |
2022 |
|---|---|---|---|---|---|---|---|---|---|---|---|---|---|---|
| Murders (per 100,000) | 0 (0.0) | 0 (0.0) | 0 (0.0) | 0 (0.0) | 1 (9.7) | 0 (0.0) | 0 (0.0) | 0 (0.0) | 1 (9.5) | 0 (0.0) | 0 (0.0) | 0 (0.0) | 0 (0.0) | 0 (0.0) |
| Rapes (per 100,000) | 6 (53.8) | 4 (38.9) | 1 (9.7) | 2 (19.2) | 5 (48.4) | 7 (67.5) | 6 (57.8) | 1 (9.5) | 10 (94.8) | 2 (19.1) | 4 (38.5) | 5 (46.1) | 5 (45.5) | 8 (74.9) |
| Robberies (per 100,000) | 2 (17.9) | 1 (9.7) | 5 (48.3) | 0 (0.0) | 0 (0.0) | 3 (28.9) | 2 (19.3) | 2 (19.1) | 2 (19.0) | 0 (0.0) | 1 (9.6) | 1 (9.2) | 2 (18.2) | 0 (0.0) |
| Assaults (per 100,000) | 21 (188.2) | 54 (524.6) | 31 (299.3) | 32 (306.5) | 36 (348.5) | 22 (212.2) | 34 (327.4) | 23 (219.4) | 16 (151.6) | 34 (324.8) | 42 (403.8) | 39 (359.4) | 47 (427.3) | 15 (140.5) |
| Burglaries (per 100,000) | 60 (537.7) | 47 (456.6) | 40 (386.2) | 35 (335.2) | 42 (406.5) | 51 (491.8) | 23 (221.5) | 19 (181.3) | 11 (104.2) | 14 (133.7) | 7 (67.3) | 10 (92.2) | 16 (145.5) | 12 (112.4) |
| Thefts (per 100,000) | 100 (896.1) | 112 (1,088) | 82 (791.8) | 68 (651.3) | 95 (919.6) | 81 (781.1) | 77 (741.5) | 61 (582.0) | 61 (578.0) | 80 (764.2) | 70 (672.9) | 58 (534.6) | 55 (500.0) | 51 (477.7) |
| Auto thefts (per 100,000) | 11 (98.6) | 11 (106.9) | 8 (77.2) | 6 (57.5) | 4 (38.7) | 3 (28.9) | 6 (57.8) | 1 (9.5) | 7 (66.3) | 3 (28.7) | 4 (38.5) | 3 (27.6) | 8 (72.7) | 1 (9.4) |
| Arson (per 100,000) | 2 (17.9) | 0 (0.0) | 0 (0.0) | 0 (0.0) | 2 (19.4) | 1 (9.6) | 2 (19.3) | 1 (9.5) | 0 (0.0) | 0 (0.0) | 0 (0.0) | 1 (9.2) | 0 (0.0) | 0 (0.0) |
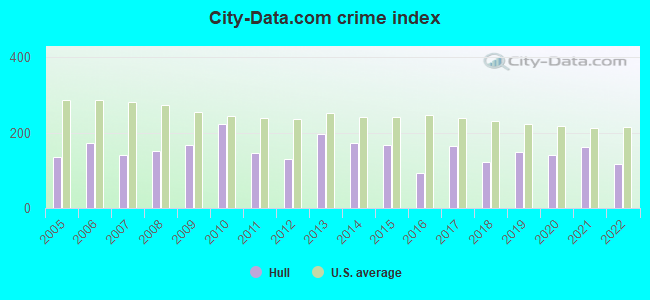
| City-Data.com crime index | 167.4 | 223.0 | 147.0 | 130.7 | 196.1 | 173.1 | 167.3 | 94.0 | 166.5 | 122.5 | 149.1 | 141.6 | 163.3 | 115.8 |
The City-Data.com crime index weighs serious crimes and violent crimes more heavily. Higher means more crime, U.S. average is 246.1. It adjusts for the number of visitors and daily workers commuting into cities.
Crime rate in Hull detailed stats: murders, rapes, robberies, assaults, burglaries, thefts, arson
Full-time law enforcement employees in 2021, including police officers: 27 (25 officers - 23 male; 2 female).
| Officers per 1,000 residents here: | 2.27 |
| Massachusetts average: | 2.53 |
 Recent articles from our blog. Our writers, many of them Ph.D. graduates or candidates, create easy-to-read articles on a wide variety of topics.

 | People are leaving Massachusetts in droves. Who are they? (334 replies) |
| 2023 Real Estate Observations (5278 replies) |
| 2021 Real Estate Observations (1729 replies) |
| Best coastal town in Mass for young retirees (106 replies) |
| Coronavirus in Massachusetts (18048 replies) |
| Seeking nature-oriented town with urban edge (99 replies) |
Latest news from Hull, MA collected exclusively by city-data.com from local newspapers, TV, and radio stations
Hull, MA City Guides:
Ancestries: Irish (34.1%), American (13.0%), Italian (10.8%), English (7.1%), Eastern European (3.9%), Scottish (3.8%).
Current Local Time: EST time zone
Incorporated in 1644
Elevation: 50 feet
Land area: 3.03 square miles.
Population density: 3,399 people per square mile (average).
520 residents are foreign born (2.8% Europe, 1.1% Asia, 0.6% Africa).
| This place: | 5.1% |
| Massachusetts: | 17.6% |
Median real estate property taxes paid for housing units with mortgages in 2022: $5,558 (0.8%)
Median real estate property taxes paid for housing units with no mortgage in 2022: $6,097 (1.0%)
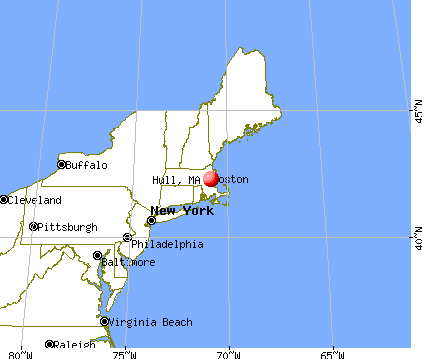
Nearest city with pop. 50,000+: Weymouth Town, MA (6.6 miles  , pop. 53,743).
Nearest city with pop. 200,000+: Boston, MA (11.1 miles , pop. 589,141).
Nearest city with pop. 1,000,000+: Bronx, NY (184.3 miles , pop. 1,332,650).
Nearest cities:
), ), Latitude: 42.29 N, Longitude: 70.88 W
Daytime population change due to commuting: -3,444 (-33.8%)
Workers who live and work in this place: 1,971 (31.9%)
Area codes: 781, 339
Hull, Massachusetts accommodation & food services, waste management - Economy and Business Data
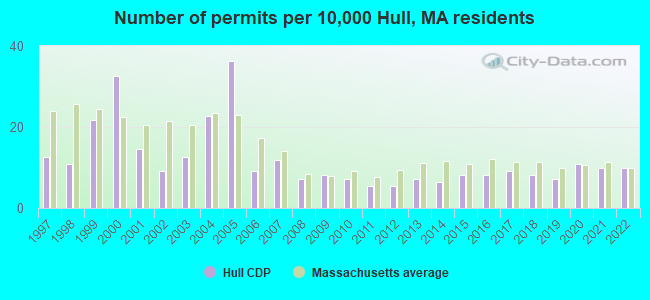
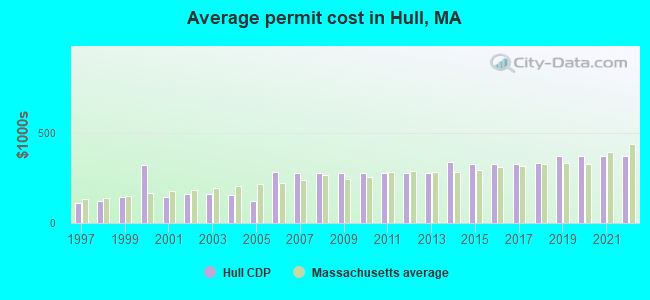
Single-family new house construction building permits:
- 2022: 11 buildings, average cost: $369,800
- 2021: 11 buildings, average cost: $369,900
- 2020: 12 buildings, average cost: $369,700
- 2019: 8 buildings, average cost: $370,700
- 2018: 9 buildings, average cost: $333,900
- 2017: 10 buildings, average cost: $328,100
- 2016: 9 buildings, average cost: $329,000
- 2015: 9 buildings, average cost: $325,900
- 2014: 7 buildings, average cost: $339,500
- 2013: 8 buildings, average cost: $278,500
- 2012: 6 buildings, average cost: $278,500
- 2011: 6 buildings, average cost: $278,500
- 2010: 8 buildings, average cost: $278,500
- 2009: 9 buildings, average cost: $278,500
- 2008: 8 buildings, average cost: $278,600
- 2007: 13 buildings, average cost: $278,200
- 2006: 10 buildings, average cost: $279,900
- 2005: 40 buildings, average cost: $121,300
- 2004: 25 buildings, average cost: $153,800
- 2003: 14 buildings, average cost: $163,100
- 2002: 10 buildings, average cost: $161,500
- 2001: 16 buildings, average cost: $146,300
- 2000: 36 buildings, average cost: $321,000
- 1999: 24 buildings, average cost: $143,000
- 1998: 12 buildings, average cost: $123,800
- 1997: 14 buildings, average cost: $107,600
| Here: | 3.6% |
| Massachusetts: | 3.5% |
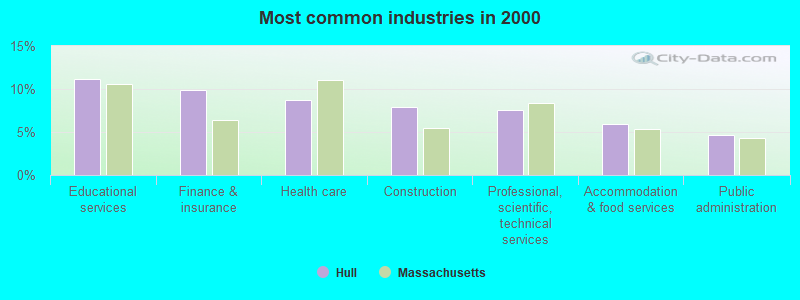
- Educational services (11.1%)
- Finance & insurance (9.8%)
- Health care (8.7%)
- Construction (7.9%)
- Professional, scientific, technical services (7.5%)
- Accommodation & food services (6.0%)
- Public administration (4.6%)
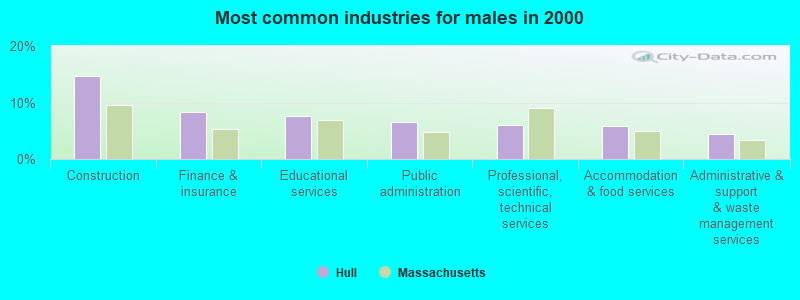
- Construction (14.7%)
- Finance & insurance (8.3%)
- Educational services (7.6%)
- Public administration (6.6%)
- Professional, scientific, technical services (6.0%)
- Accommodation & food services (5.8%)
- Administrative & support & waste management services (4.5%)
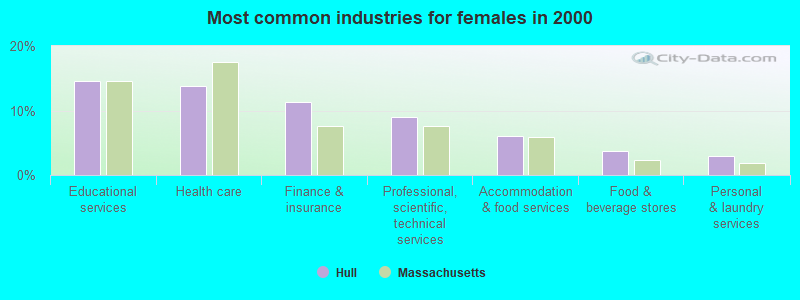
- Educational services (14.6%)
- Health care (13.8%)
- Finance & insurance (11.4%)
- Professional, scientific, technical services (9.0%)
- Accommodation & food services (6.1%)
- Food & beverage stores (3.8%)
- Personal & laundry services (3.0%)

- Other management occupations, except farmers and farm managers (6.0%)
- Other office and administrative support workers, including supervisors (4.0%)
- Secretaries and administrative assistants (3.9%)
- Other sales and related occupations, including supervisors (3.7%)
- Sales representatives, services, wholesale and manufacturing (3.3%)
- Preschool, kindergarten, elementary, and middle school teachers (2.9%)
- Computer specialists (2.8%)
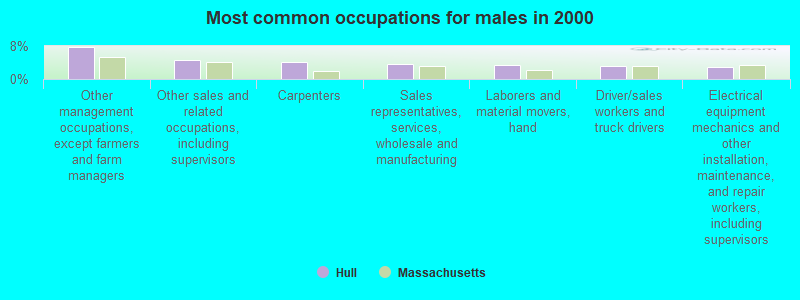
- Other management occupations, except farmers and farm managers (7.8%)
- Other sales and related occupations, including supervisors (4.6%)
- Carpenters (4.1%)
- Sales representatives, services, wholesale and manufacturing (3.6%)
- Laborers and material movers, hand (3.3%)
- Driver/sales workers and truck drivers (3.1%)
- Electrical equipment mechanics and other installation, maintenance, and repair workers, including supervisors (2.9%)

- Secretaries and administrative assistants (7.7%)
- Other office and administrative support workers, including supervisors (6.4%)
- Other management occupations, except farmers and farm managers (4.2%)
- Preschool, kindergarten, elementary, and middle school teachers (4.2%)
- Customer service representatives (3.7%)
- Computer specialists (3.2%)
- Health technologists and technicians (3.2%)
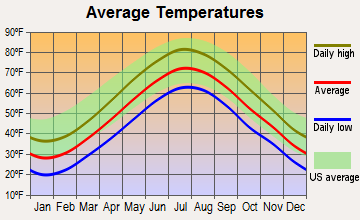
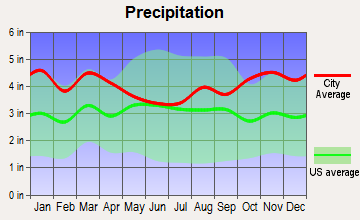
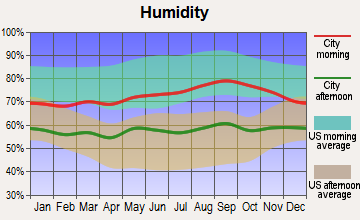
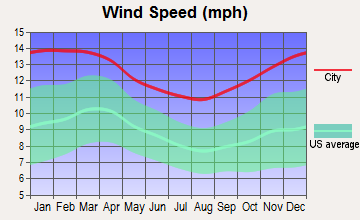
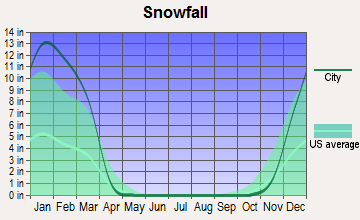
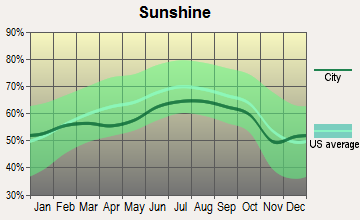
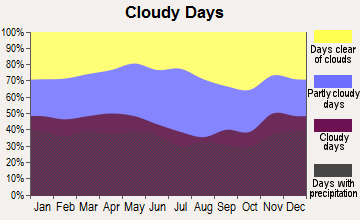
Average climate in Hull, Massachusetts
Based on data reported by over 4,000 weather stations
|
|

(lower is better)
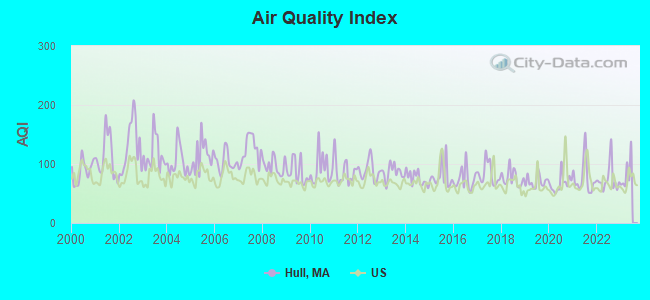
Air Quality Index (AQI) level in 2022 was 74.3. This is about average.
| City: | 74.3 |
| U.S.: | 72.6 |
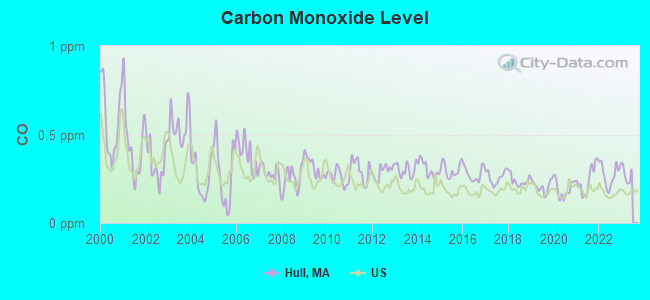
Carbon Monoxide (CO) [ppm] level in 2022 was 0.273. This is about average. Closest monitor was 5.6 miles away from the city center.
| City: | 0.273 |
| U.S.: | 0.251 |
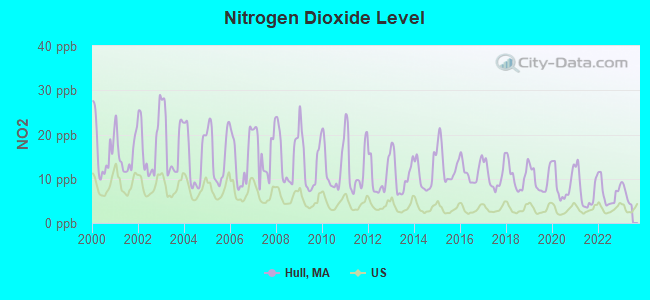
Nitrogen Dioxide (NO2) [ppb] level in 2022 was 6.69. This is worse than average. Closest monitor was 5.2 miles away from the city center.
| City: | 6.69 |
| U.S.: | 5.11 |
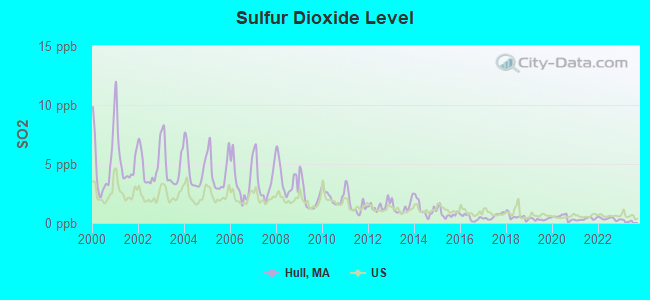
Sulfur Dioxide (SO2) [ppb] level in 2022 was 0.358. This is significantly better than average. Closest monitor was 5.1 miles away from the city center.
| City: | 0.358 |
| U.S.: | 1.515 |
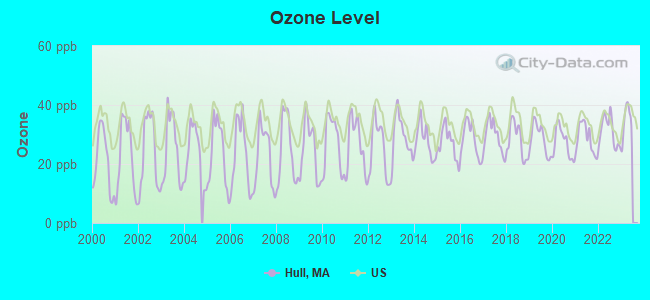
Ozone [ppb] level in 2022 was 31.1. This is about average. Closest monitor was 5.2 miles away from the city center.
| City: | 31.1 |
| U.S.: | 33.3 |
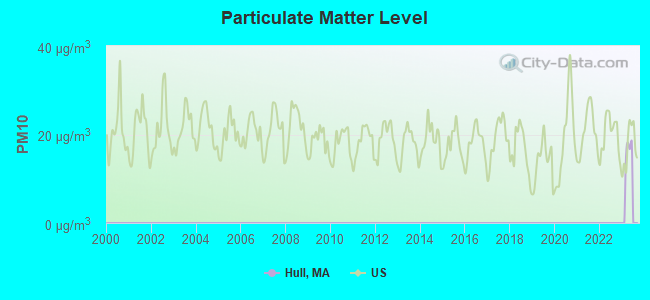
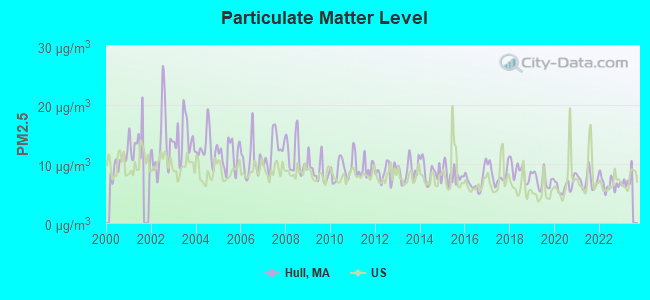
Particulate Matter (PM2.5) [µg/m3] level in 2022 was 6.66. This is better than average. Closest monitor was 5.2 miles away from the city center.
| City: | 6.66 |
| U.S.: | 8.11 |
Tornado activity:
Hull-area historical tornado activity is slightly below Massachusetts state average. It is 54% smaller than the overall U.S. average.
On 6/9/1953, a category F4 (max. wind speeds 207-260 mph) tornado 32.9 miles away from the Hull place center killed 90 people and injured 1228 people and caused between $50,000,000 and $500,000,000 in damages.
On 6/9/1953, a category F3 (max. wind speeds 158-206 mph) tornado 23.3 miles away from the place center injured 17 people and caused between $500,000 and $5,000,000 in damages.
Earthquake activity:
Hull-area historical earthquake activity is significantly above Massachusetts state average. It is 74% smaller than the overall U.S. average.On 4/20/2002 at 10:50:47, a magnitude 5.3 (5.3 ML, Depth: 3.0 mi, Class: Moderate, Intensity: VI - VII) earthquake occurred 209.3 miles away from the city center
On 10/7/1983 at 10:18:46, a magnitude 5.3 (5.1 MB, 5.3 LG, 5.1 ML) earthquake occurred 209.5 miles away from the city center
On 10/16/2012 at 23:12:25, a magnitude 4.7 (4.7 ML, Depth: 10.0 mi, Class: Light, Intensity: IV - V) earthquake occurred 91.4 miles away from Hull center
On 1/19/1982 at 00:14:42, a magnitude 4.7 (4.5 MB, 4.7 MD, 4.5 LG) earthquake occurred 91.6 miles away from Hull center
On 4/20/2002 at 10:50:47, a magnitude 5.2 (5.2 MB, 4.2 MS, 5.2 MW, 5.0 MW) earthquake occurred 208.7 miles away from Hull center
On 8/22/1992 at 12:20:32, a magnitude 4.8 (4.8 MB, 3.8 MS, 4.7 LG, Depth: 6.2 mi) earthquake occurred 221.9 miles away from Hull center
Magnitude types: regional Lg-wave magnitude (LG), body-wave magnitude (MB), duration magnitude (MD), local magnitude (ML), surface-wave magnitude (MS), moment magnitude (MW)
Natural disasters:
The number of natural disasters in Plymouth County (26) is a lot greater than the US average (15).Major Disasters (Presidential) Declared: 17
Emergencies Declared: 9
Causes of natural disasters: Floods: 11, Storms: 9, Hurricanes: 7, Snows: 3, Snowstorms: 3, Blizzards: 2, Winter Storms: 2, Heavy Rain: 1, Snowfall: 1, Tropical Storm: 1, Wind: 1 (Note: some incidents may be assigned to more than one category).
Hospitals and medical centers near Hull:
- HARBOR HOUSE NURSING AND REHABILITATION CENTER (Nursing Home, about 3 miles away; HINGHAM, MA)
- HINGHAM VN COMM SERV INC (Home Health Center, about 3 miles away; HINGHAM, MA)
- GOLDEN LIVING CENTER-COHASSET (Nursing Home, about 4 miles away; COHASSET, MA)
- RIPLEY ROAD NURSING HOME (Nursing Home, about 5 miles away; COHASSET, MA)
- POPE NURSING HOME (Nursing Home, about 7 miles away; WEYMOUTH, MA)
- RESTHAVEN NURSING HOME (Nursing Home, about 7 miles away; BRAINTREE, MA)
- INTERIM HEALTH CARE OF HYANNIS (Home Health Center, about 7 miles away; QUINCY, MA)
Amtrak stations near Hull:
- 11 miles: BOSTON (SO. STA) (BOSTON, ATLANTIC AVE. & SUMMER ST.) . Services: ticket office, fully wheelchair accessible, enclosed waiting area, public restrooms, public payphones, full-service food facilities and snack bar, ATM, paid short-term parking, paid long-term parking, call for car rental service, taxi stand, intercity bus service, public transit connection.
- 11 miles: BOSTON, NORTH STATION (BOSTON, 126 CAUSEWAY ST.) . Services: ticket office, enclosed waiting area.
- 12 miles: BACK BAY (BOSTON, 145 DARTMOUTH ST.) . Services: ticket office, partially wheelchair accessible, enclosed waiting area, public restrooms, public payphones, vending machines, ATM, paid short-term parking, paid long-term parking, call for car rental service, taxi stand, public transit connection.
Colleges/universities with over 2000 students nearest to Hull:
- Quincy College (about 7 miles; Quincy, MA; Full-time enrollment: 3,184)
- University of Massachusetts-Boston (about 9 miles; Boston, MA; FT enrollment: 12,625)
- Suffolk University (about 11 miles; Boston, MA; FT enrollment: 6,982)
- Emerson College (about 12 miles; Boston, MA; FT enrollment: 4,657)
- Northeastern University (about 12 miles; Boston, MA; FT enrollment: 27,758)
- Berklee College of Music (about 12 miles; Boston, MA; FT enrollment: 4,726)
- Bunker Hill Community College (about 12 miles; Boston, MA; FT enrollment: 8,814)
Public high school in Hull:
- HULL HIGH (Students: 417, Location: 180 MAIN STREET, Grades: 9-12)
Public elementary/middle schools in Hull:
- LILLIAN M JACOBS (Students: 535, Location: 180 HARBORVIEW RD, Grades: PK-5)
- MEMORIAL MIDDLE (Students: 283, Location: 81 CENTRAL AVENUE, Grades: 6-8)
Points of interest:
Notable locations in Hull: Hull Fire Department Station 3 (A), Hull Fire Department Station 1 Headquarters (B), Hull Fire Department Station 2 (C), Hull Lifesaving Museum Library (D). Display/hide their locations on the map
Churches in Hull include: Tri-Town Baptist Church (A), Lighthouse Assembly of God Church (B), Hull United Methodist Church (C). Display/hide their locations on the map
Reservoir: Straits Pond (A). Display/hide its location on the map
Streams, rivers, and creeks: Weir River (A), Turkey Hill Run (B). Display/hide their locations on the map
Parks in Hull include: Monument Square (1), Paragon Park (2). Display/hide their locations on the map
Beach: Crescent Beach (A). Display/hide its location on the map
Tourist attractions: Hull Lifesaving Museum & Life Saving Station (Cultural Attractions- Events- & Facilities; 1117 Nantasket Avenue), Hull Lifesaving Museum Maritime Program (Cultural Attractions- Events- & Facilities; 185 Main Street), Friends of Paragon Carousel (Amusement & Theme Parks; 205 Nantasket Avenue), Le Calypso (42 A State Park Rd), Dream Machine Of Nantasket (Arcades & Amusements; 197 Nantasket Av).
Hotels: Nantasket Beach Inn (115 Nantasket Avenue), Clarion Hotel Nantasket Beach (45 Hull Shore Drive).
Birthplace of: Bobby Allen - Ice hockey player, Eric Healey - NHL player (Boston Bruins, born: Jan 20, 1975), Richard I. Neal - Assistant Commandant of the Marine Corps, Robert Haswell - Sailor, Matt Glennon (ice hockey) - Ice hockey player.
| This place: | 2.2 people |
| Massachusetts: | 2.5 people |
| This place: | 57.3% |
| Whole state: | 63.0% |
| This place: | 8.6% |
| Whole state: | 7.0% |
Likely homosexual households (counted as self-reported same-sex unmarried-partner households)
- Lesbian couples: 0.8% of all households
- Gay men: 0.8% of all households
11 people in homes or halfway houses for drug/alcohol abuse in 2000
Banks with branches in Hull (2011 data):
- Sovereign Bank, National Association: 523 Nantasket Avenue Branch at 523 Nantasket Avenue, branch established on 1955/01/01. Info updated 2012/01/31: Bank assets: $78,146.9 mil, Deposits: $48,042.9 mil, headquarters in Wilmington, DE, positive income, Commercial Lending Specialization, 718 total offices, Holding Company: Banco Santander, S.A.
- Rockland Trust Company: Hull Branch at 264 Nantasket Avenue, branch established on 1962/01/03. Info updated 2009/05/20: Bank assets: $4,974.4 mil, Deposits: $3,903.9 mil, headquarters in Rockland, MA, positive income, Commercial Lending Specialization, 67 total offices, Holding Company: Independent Bank Corp.
- Hingham Institution for Savings: Nantasket Avenue Branch at 401 Nantasket Avenue, branch established on 1976/06/28. Info updated 2006/12/01: Bank assets: $1,127.3 mil, Deposits: $790.5 mil, headquarters in Hingham, MA, positive income, Commercial Lending Specialization, 11 total offices
For population 15 years and over in Hull:
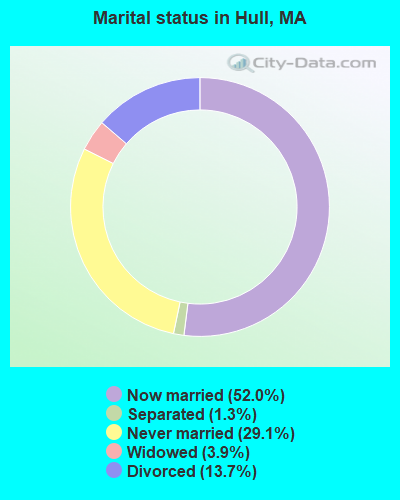
- Never married: 29.1%
- Now married: 52.0%
- Separated: 1.3%
- Widowed: 3.9%
- Divorced: 13.7%
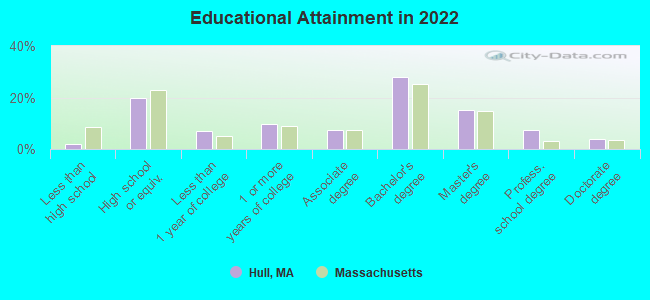
For population 25 years and over in Hull:
- High school or higher: 97.7%
- Bachelor's degree or higher: 51.8%
- Graduate or professional degree: 23.9%
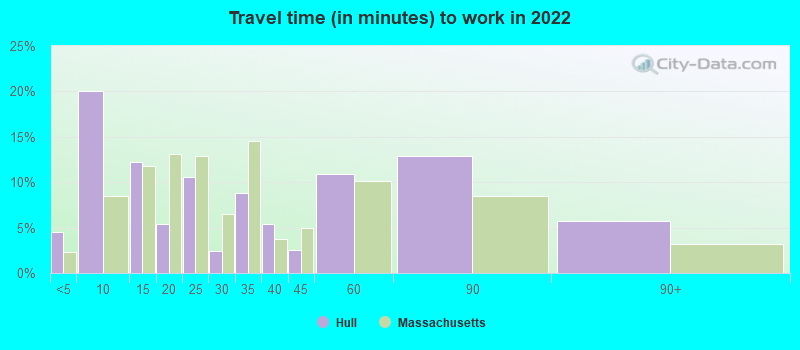
- Unemployed: 4.0%
- Mean travel time to work (commute): 28.5 minutes
| Here: | 10.1 |
| Massachusetts average: | 13.0 |
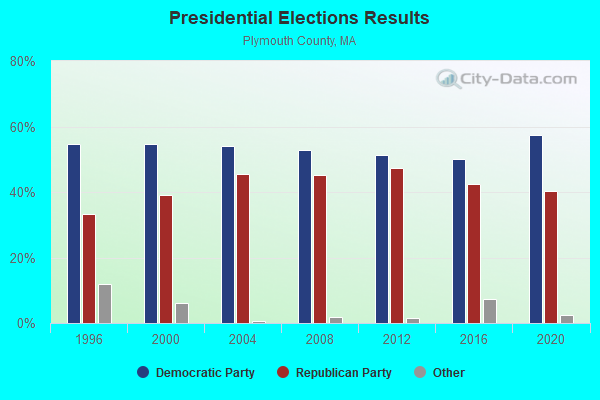
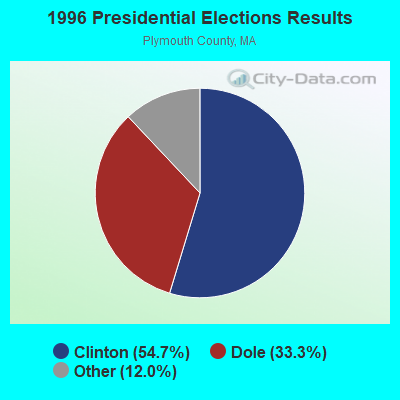
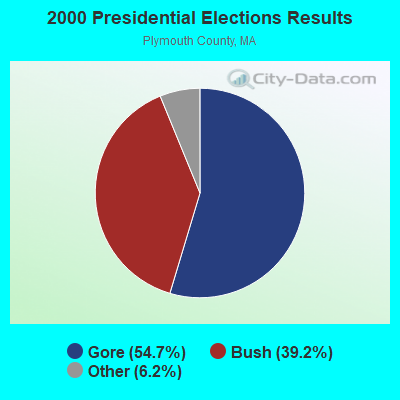
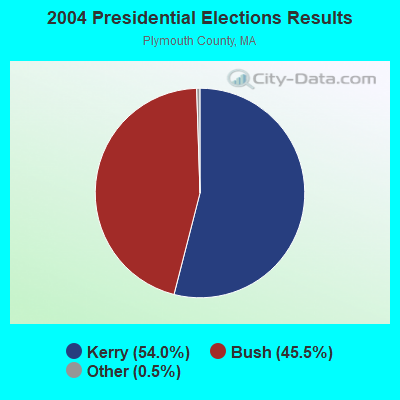
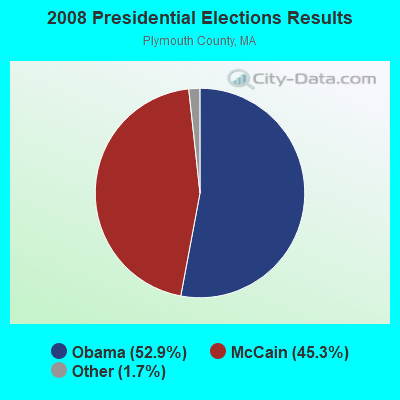


Graphs represent county-level data. Detailed 2008 Election Results
Neighborhoods in Hull:
(Hull, Massachusetts Neighborhood Map)Religion statistics for Hull, MA (based on Plymouth County data)
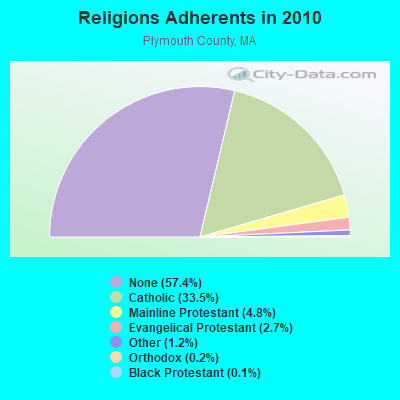
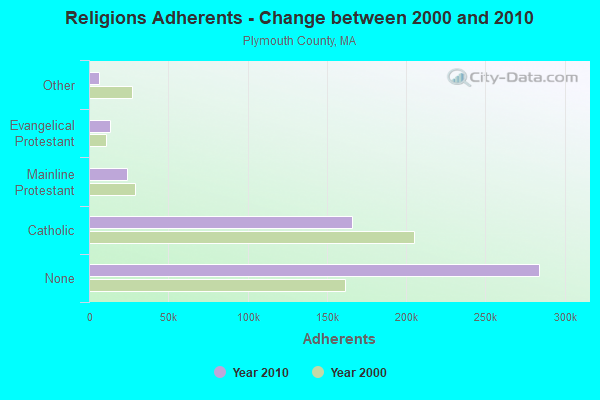
| Religion | Adherents | Congregations |
|---|---|---|
| Catholic | 165,985 | 35 |
| Mainline Protestant | 23,724 | 91 |
| Evangelical Protestant | 13,159 | 96 |
| Other | 6,129 | 43 |
| Orthodox | 1,140 | 3 |
| Black Protestant | 611 | 5 |
| None | 284,171 | - |
Food Environment Statistics:
| Plymouth County: | 1.74 / 10,000 pop. |
| State: | 1.98 / 10,000 pop. |
| Plymouth County: | 0.04 / 10,000 pop. |
| Massachusetts: | 0.05 / 10,000 pop. |
| Plymouth County: | 2.84 / 10,000 pop. |
| Massachusetts: | 2.22 / 10,000 pop. |
| Plymouth County: | 2.20 / 10,000 pop. |
| Massachusetts: | 1.77 / 10,000 pop. |
| This county: | 7.37 / 10,000 pop. |
| State: | 8.76 / 10,000 pop. |
| This county: | 7.9% |
| State: | 8.1% |
| Here: | 21.7% |
| Massachusetts: | 22.5% |
| Plymouth County: | 16.3% |
| State: | 16.5% |
Health and Nutrition:
| This city: | 49.9% |
| State: | 50.5% |
| This city: | 47.2% |
| Massachusetts: | 48.0% |
| Hull: | 29.0 |
| Massachusetts: | 28.4 |
| This city: | 25.2% |
| State: | 20.7% |
| This city: | 9.9% |
| State: | 10.4% |
| Here: | 6.8 |
| Massachusetts: | 6.8 |
| Hull: | 37.3% |
| State: | 33.4% |
| Hull: | 56.4% |
| State: | 57.1% |
| This city: | 78.0% |
| Massachusetts: | 79.2% |
More about Health and Nutrition of Hull, MA Residents
5.54% of this county's 2020 resident taxpayers moved to other counties in 2021 ($85,482 average adjusted gross income)
| Here: | 5.54% |
| Massachusetts average: | 7.18% |
0.01% of residents moved to foreign countries ($80 average AGI)
Plymouth County: 0.01% Massachusetts average: 0.02%
Top counties to which taxpayers relocated from this county between 2020 and 2021:
| to Bristol County, MA | |
| to Norfolk County, MA | |
| to Suffolk County, MA |
Businesses in Hull, MA
- Dunkin Donuts: 2
- FedEx: 2
- Jones New York: 1
Strongest AM radio stations in Hull:
- WBZ (1030 AM; 50 kW; BOSTON, MA; Owner: INFINITY BROADCASTING OPERATIONS, INC.)
- WEEI (850 AM; 50 kW; BOSTON, MA; Owner: ENTERCOM BOSTON LICENSE, LLC)
- WRKO (680 AM; 50 kW; BOSTON, MA; Owner: ENTERCOM BOSTON LICENSE, LLC)
- WWZN (1510 AM; 50 kW; BOSTON, MA; Owner: ROSE CITY RADIO CORPORATION)
- WMKI (1260 AM; 5 kW; BOSTON, MA; Owner: ABC, INC.)
- WKOX (1200 AM; 50 kW; FRAMINGHAM, MA; Owner: CAPSTAR TX LIMITED PARTNERSHIP)
- WUNR (1600 AM; 20 kW; BROOKLINE, MA; Owner: CHAMPION BROADCASTING SYSTEMS, INC.)
- WBIX (1060 AM; 40 kW; NATICK, MA; Owner: LANGER BROADCASTING CORPORATION)
- WRCA (1330 AM; 25 kW; WALTHAM, MA; Owner: WRCA LICENSE, LLC)
- WEZE (590 AM; 5 kW; BOSTON, MA; Owner: NEW ENGLAND CONTINENTAL MEDIA, INC.)
- WROL (950 AM; 5 kW; BOSTON, MA; Owner: SCA LICENSE CORPORATION)
- WAMG (890 AM; 25 kW; DEDHAM, MA; Owner: MEGA COMMUNICATIONS OF DEDHAM LICENSEE, LLC)
- WALE (990 AM; 50 kW; GREENVILLE, RI; Owner: NORTH AMERICAN BROADCASTING CO., INC.)
Strongest FM radio stations in Hull:
- WXKS-FM (107.9 FM; MEDFORD, MA; Owner: AMFM RADIO LICENSES, L.L.C.)
- WMJX (106.7 FM; BOSTON, MA; Owner: GREATER BOSTON RADIO, INC.)
- W267AI (101.3 FM; BOSTON, MA; Owner: MCC BROADCASTING COMPANY, INC.)
- WBCN (104.1 FM; BOSTON, MA; Owner: HEMISPHERE BROADCASTING CORPORATION)
- WZLX (100.7 FM; BOSTON, MA; Owner: INFINITY BROADCASTING CORPORATION OF BOSTON)
- WERS (88.9 FM; BOSTON, MA; Owner: EMERSON COLLEGE)
- WHRB (95.3 FM; CAMBRIDGE, MA; Owner: HARVARD RADIO BROADCASTING CO., INC.)
- WBMX (98.5 FM; BOSTON, MA; Owner: INFINITY RADIO OPERATIONS INC.)
- WBOS (92.9 FM; BROOKLINE, MA; Owner: GREATER BOSTON RADIO, INC.)
- WJMN (94.5 FM; BOSTON, MA; Owner: AMFM RADIO LICENSES, L.L.C.)
- WCRB (102.5 FM; WALTHAM, MA; Owner: CHARLES RIVER BROADCASTING WCRB LICE)
- WTKK (96.9 FM; BOSTON, MA; Owner: GREATER BOSTON RADIO, INC.)
- WROR-FM (105.7 FM; FRAMINGHAM, MA; Owner: GREATER BOSTON RADIO, INC.)
- WGBH (89.7 FM; BOSTON, MA; Owner: WGBH EDUCATIONAL FOUNDATION)
- WBUR-FM (90.9 FM; BOSTON, MA; Owner: TRUSTEES OF BOSTON UNIVERSITY)
- WODS (103.3 FM; BOSTON, MA; Owner: INFINITY BROADCASTING OPERATIONS, INC.)
- WQSX (93.7 FM; LAWRENCE, MA; Owner: ENTERCOM BOSTON LICENSE, LLC)
- WUMB-FM (91.9 FM; BOSTON, MA; Owner: THE UNIVERSITY OF MASSACHUSETTS)
- WATD-FM (95.9 FM; MARSHFIELD, MA; Owner: MARSHFIELD BROADCASTING CO., INC.)
- WFNX (101.7 FM; LYNN, MA; Owner: MCC BROADCASTING COMPANY, INC.)
TV broadcast stations around Hull:
- WBPX (Channel 68; BOSTON, MA; Owner: PAXSON BOSTON-68 LICENSE, INC.)
- WCVB-TV (Channel 5; BOSTON, MA; Owner: WCVB HEARST-ARGYLE TV, INC.)
- WGBH-TV (Channel 2; BOSTON, MA; Owner: WGBH EDUCATIONAL FOUNDATION)
- WTMU-LP (Channel 32; BOSTON, MA; Owner: ZGS BOSTON, INC.)
- WCEA-LP (Channel 58; BOSTON, MA; Owner: CHANNEL 19 TV CORPORATION)
- WHDH-TV (Channel 7; BOSTON, MA; Owner: WHDH-TV)
- WMFP (Channel 62; LAWRENCE, MA; Owner: WSAH LICENSE, INC.)
- WSBK-TV (Channel 38; BOSTON, MA; Owner: VIACOM INC.)
- WLVI-TV (Channel 56; CAMBRIDGE, MA; Owner: WLVI, INC.)
- WBZ-TV (Channel 4; BOSTON, MA; Owner: VIACOM INC.)
- WGBX-TV (Channel 44; BOSTON, MA; Owner: WGBH EDUCATIONAL FOUNDATION)
- WFXT (Channel 25; BOSTON, MA; Owner: FOX TELEVISION STATIONS INC.)
- W40BO (Channel 40; BOSTON, MA; Owner: PAXSON COMMUNICATIONS LPTV, INC.)
- WWDP (Channel 46; NORWELL, MA; Owner: NORWELL TELEVISION, LLC)
- WUTF (Channel 66; MARLBOROUGH, MA; Owner: TELEFUTURA BOSTON LLC)
- WUNI (Channel 27; WORCESTER, MA; Owner: ENTRAVISION HOLDINGS, LLC)
- WLNE-TV (Channel 6; NEW BEDFORD, MA; Owner: FREEDOM BROADCASTING OF SOUTHERN NEW ENGLAND, INC.)
- WPRI-TV (Channel 12; PROVIDENCE, RI; Owner: TVL BROADCASTING OF RHODE ISLAND, LLC)
- WNAC-TV (Channel 64; PROVIDENCE, RI; Owner: WNAC, LLC)
- WFXZ-CA (Channel 24; BOSTON, MA; Owner: BOSTON BROADCASTING CORP.)
- WJAR (Channel 10; PROVIDENCE, RI; Owner: OUTLET BROADCASTING, INC.)
- WSBE-TV (Channel 36; PROVIDENCE, RI; Owner: RHODE ISLAND PUBLIC TELECOM. AUTHORITY)
- WLWC (Channel 28; NEW BEDFORD, MA; Owner: C-28 FCC LICENSEE SUBSIDIARY, LLC)
- National Bridge Inventory (NBI) Statistics
- 2Number of bridges
- 26ft / 8.0mTotal length
- $10,665,000Total costs
- 31,069Total average daily traffic
- 772Total average daily truck traffic
- 61,751Total future (year 2032) average daily traffic
FCC Registered Antenna Towers:
20 (See the full list of FCC Registered Antenna Towers in Hull)FCC Registered Broadcast Land Mobile Towers:
6- 1111 Nantasket Ave (Lat: 42.302889 Lon: -70.899500), Call Sign: KNIY211,
Assigned Frequencies: 155.865 MHz, Grant Date: 02/11/2014, Expiration Date: 04/12/2024, Registrant: Radio Solutions, Inc., 70 Accord Park Drive, Norwell, MA 02061, Phone: (781) 331-1008, Fax: (781) 561-7770, Email:
- 5 Nantasket Ave (Lat: 42.258444 Lon: -70.845333), Call Sign: KOB798,
Assigned Frequencies: 155.760 MHz, Grant Date: 07/29/2022, Expiration Date: 08/10/2032, Registrant: Town Of Hull, Dpw, 9 Nantasket Avenue, Hull, MA 02045, Phone: (781) 925-0900, Fax: (781) 925-0401, Email:
- Police Dept (Lat: 42.291778 Lon: -70.874500), Call Sign: WBP533,
Assigned Frequencies: 485.887 MHz, 485.987 MHz, 486.037 MHz, Grant Date: 02/14/2002, Expiration Date: 01/20/2012, Cancellation Date: 03/24/2012, Certifier: Donald Brooker, Registrant: Hull Police Department, 1 School Street, Hull, MA 02045, Phone: (781) 925-1212, Fax: (781) 925-1216, Email:
- 1 School Street (Lat: 42.291778 Lon: -70.874500), Type: Bant, Structure height: 23 m, Overall height: 27 m, Call Sign: WPVD244,
Assigned Frequencies: 482.987 MHz, Grant Date: 04/26/2022, Expiration Date: 06/21/2032, Certifier: Donald F Brooker, Registrant: Hull Dpw, 9 Nantasket, Hull, MA 02045, Phone: (617) 835-7368, Fax: (781) 925-1216, Email:
- Strawberry Hill (Lat: 42.289472 Lon: -70.879111), Type: Pole, Structure height: 10 m, Overall height: 13 m, Call Sign: WQXD208,
Assigned Frequencies: 1.68000 MHz, Grant Date: 02/03/2016, Expiration Date: 02/03/2026, Certifier: Christopher Russo, Registrant: Information Station Specialists, Inc, Zeeland, MI 49464, Phone: (616) 772-2300, Fax: (616) 772-2966, Email:
- Lat: 42.306917 Lon: -70.908889, Call Sign: WSAY701,
Assigned Frequencies: 462.212 MHz, 462.312 MHz, 462.437 MHz, 467.362 MHz, 467.437 MHz, Grant Date: 02/23/2024, Expiration Date: 02/23/2034, Certifier: Judy Saide, Registrant: Comtronics/Bearcom, 1230 Furnace Brook Pkwy., Quincy, MA 02169, Phone: (617) 770-0212, Fax: (617) 770-0429, Email:
FCC Registered Microwave Towers:
1- STRAWBERRY HILL, 40 Prospect Ave (Lat: 42.289528 Lon: -70.879389), Type: Upole, Structure height: 18.3 m, Call Sign: WRDN848,
Assigned Frequencies: 11075.0 MHz, 11075.0 MHz, 11075.0 MHz, 11075.0 MHz, 11075.0 MHz, 11075.0 MHz, 11075.0 MHz, 11075.0 MHz, 11075.0 MHz, 11075.0 MHz, Grant Date: 06/14/2019, Expiration Date: 06/14/2029, Certifier: Maureen Maureen Shirkus, Registrant: Town Of Hingham, 210 Central St, Hingham, MA 02043, Phone: (781) 740-0270, Fax: (781) 314-3176, Email:
FCC Registered Maritime Coast & Aviation Ground Towers:
3- Marina Dr (Lat: 42.300944 Lon: -70.900889), Type: Building, Overall height: 4 m, Call Sign: KMC970,
Assigned Frequencies: 156.350 MHz, 156.450 MHz, 156.800 MHz, Grant Date: 04/06/1994, Expiration Date: 04/06/1999, Cancellation Date: 05/06/2001, Registrant: Spinnaker Island & Yacht Club, Hull, MA 02045
- 2 A St (Lat: 42.290667 Lon: -70.884500), Type: Building, Overall height: 12 m, Call Sign: WHU662, Licensee ID: L00006692,
Assigned Frequencies: 156.450 MHz, 156.350 MHz, 156.800 MHz, Grant Date: 04/25/2002, Expiration Date: 04/23/2012, Cancellation Date: 06/23/2012, Registrant: Donohues Waveland Marina Inc
- Mariners Park (Lat: 42.305667 Lon: -70.886444), Type: Building, Overall height: 8 m, Call Sign: WXZ330,
Assigned Frequencies: 156.450 MHz, 156.425 MHz, 156.800 MHz, Grant Date: 11/09/1999, Expiration Date: 12/01/2004, Cancellation Date: 02/05/2005, Registrant: Nantasket Beach Salt Water Club, Mariners Park, Hull, MA 02045
FCC Registered Amateur Radio Licenses:
51 (See the full list of FCC Registered Amateur Radio Licenses in Hull)FAA Registered Aircraft:
5- Aircraft: PIPER PA-30 (Category: Land, Engines: 2, Seats: 6, Weight: Up to 12,499 Pounds, Speed: 139 mph), Engine: LYCOMING IO-320 SERIES (150 HP) (Reciprocating)
N-Number: 114RS, N114RS, N-114RS, Serial Number: 30-1094, Year manufactured: 1966, Airworthiness Date: 12/09/1983, Certificate Issue Date: 03/09/2018
Registrant (Individual): Michael Luggelle, 26 Rockview Rd, Hull, MA 02045 - Aircraft: BEECH 95-B55 (T42A) (Category: Land, Engines: 2, Seats: 6, Weight: Up to 12,499 Pounds, Speed: 165 mph), Engine: CONT MOTOR I0-470 SERIES (260 HP) (Reciprocating)
N-Number: 1159T, N1159T, N-1159T, Serial Number: TC-1784, Year manufactured: 1974, Airworthiness Date: 09/23/1974, Certificate Issue Date: 02/05/2014
Registrant (Individual): W Michael Luggelle, 26 Rockview Rd, Hull, MA 02045 - Aircraft: MOONEY AIRCRAFT CORP. M20K (Category: Land, Seats: 4, Weight: Up to 12,499 Pounds), Engine: CONT MOTOR TSIO-360 SER (225 HP) (Reciprocating)
N-Number: 4093H, N4093H, N-4093H, Serial Number: 25-0404, Year manufactured: 1980, Airworthiness Date: 07/29/1980, Certificate Issue Date: 05/19/2017
Registrant (Individual): Charles Williams, 12 Maple Ln, Hull, MA 02045 - Aircraft: BEECH P35 (Category: Land, Seats: 4, Weight: Up to 12,499 Pounds, Speed: 150 mph), Engine: CONT MOTOR I0-470 SERIES (260 HP) (Reciprocating)
N-Number: 9630Y, N9630Y, N-9630Y, Serial Number: D-7056, Year manufactured: 1962, Airworthiness Date: 10/05/1962, Certificate Issue Date: 12/12/2017
Registrant (Individual): Michael Luggelle, 26 Rockview Rd, Hull, MA 02045 - Aircraft: CESSNA 172C (Category: Land, Seats: 4, Weight: Up to 12,499 Pounds, Speed: 105 mph), Engine: CONT MOTOR 0-200 SERIES (100 HP) (Reciprocating)
N-Number: 1592Y, N1592Y, N-1592Y, Serial Number: 17249292, Year manufactured: 1962, Airworthiness Date: 11/01/1978, Certificate Issue Date: 11/20/1976
Registrant (Corporation): Fliga Associates Inc, 7 M St, Hull, MA 02045
Deregistered: Cancel Date: 01/10/2018
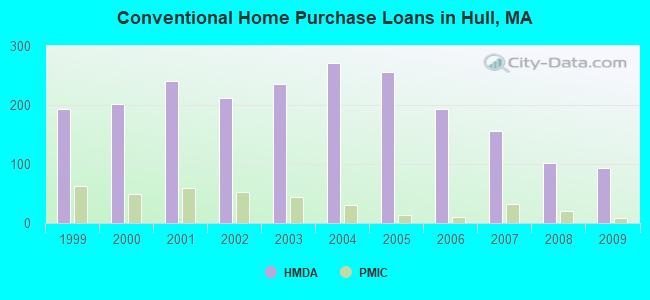
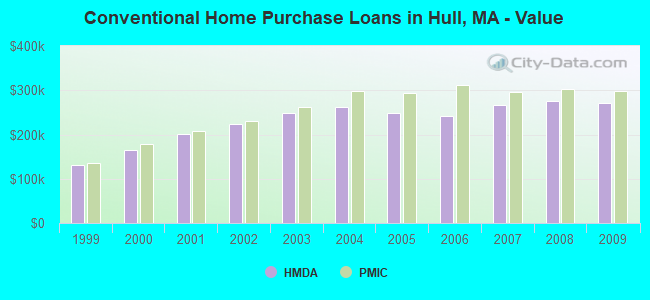
| Home Mortgage Disclosure Act Aggregated Statistics For Year 2009 (Based on 2 full tracts) | ||||||||||||||
| A) FHA, FSA/RHS & VA Home Purchase Loans | B) Conventional Home Purchase Loans | C) Refinancings | D) Home Improvement Loans | E) Loans on Dwellings For 5+ Families | F) Non-occupant Loans on < 5 Family Dwellings (A B C & D) | G) Loans On Manufactured Home Dwelling (A B C & D) | ||||||||
|---|---|---|---|---|---|---|---|---|---|---|---|---|---|---|
| Number | Average Value | Number | Average Value | Number | Average Value | Number | Average Value | Number | Average Value | Number | Average Value | Number | Average Value | |
| LOANS ORIGINATED | 35 | $272,714 | 94 | $270,596 | 404 | $263,149 | 23 | $152,174 | 1 | $425,000 | 75 | $299,547 | 1 | $36,000 |
| APPLICATIONS APPROVED, NOT ACCEPTED | 2 | $246,500 | 5 | $224,000 | 23 | $257,565 | 7 | $167,000 | 1 | $299,000 | 4 | $261,500 | 1 | $20,000 |
| APPLICATIONS DENIED | 3 | $211,667 | 12 | $317,500 | 136 | $256,676 | 8 | $138,125 | 0 | $0 | 24 | $268,167 | 0 | $0 |
| APPLICATIONS WITHDRAWN | 1 | $209,000 | 13 | $257,615 | 86 | $265,291 | 3 | $220,000 | 0 | $0 | 12 | $272,500 | 0 | $0 |
| FILES CLOSED FOR INCOMPLETENESS | 0 | $0 | 3 | $273,667 | 22 | $231,455 | 2 | $62,500 | 0 | $0 | 1 | $237,000 | 0 | $0 |
Detailed HMDA statistics for the following Tracts: 5001.01 , 5001.02
| Private Mortgage Insurance Companies Aggregated Statistics For Year 2009 (Based on 2 full tracts) | ||||||
| A) Conventional Home Purchase Loans | B) Refinancings | C) Non-occupant Loans on < 5 Family Dwellings (A & B) | ||||
|---|---|---|---|---|---|---|
| Number | Average Value | Number | Average Value | Number | Average Value | |
| LOANS ORIGINATED | 8 | $297,625 | 4 | $331,000 | 0 | $0 |
| APPLICATIONS APPROVED, NOT ACCEPTED | 1 | $374,000 | 2 | $443,000 | 1 | $371,000 |
| APPLICATIONS DENIED | 0 | $0 | 2 | $323,000 | 0 | $0 |
| APPLICATIONS WITHDRAWN | 1 | $563,000 | 0 | $0 | 0 | $0 |
| FILES CLOSED FOR INCOMPLETENESS | 0 | $0 | 0 | $0 | 0 | $0 |
Detailed PMIC statistics for the following Tracts: 5001.01 , 5001.02
2002 - 2018 National Fire Incident Reporting System (NFIRS) incidents
- Fire incident types reported to NFIRS in Hull, MA
- 31742.7%Structure Fires
- 23131.1%Other
- 15020.2%Outside Fires
- 445.9%Mobile Property/Vehicle Fires
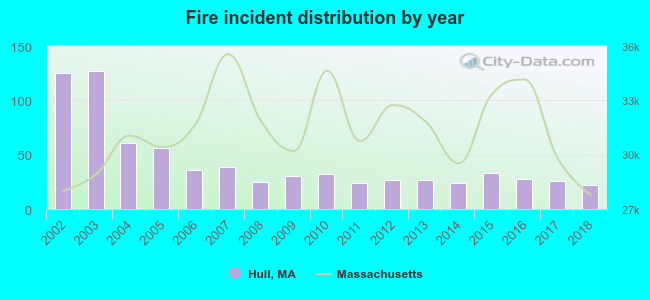 According to the data from the years 2002 - 2018 the average number of fire incidents per year is 44. The highest number of fire incidents - 127 took place in 2003, and the least - 22 in 2018. The data has a declining trend.
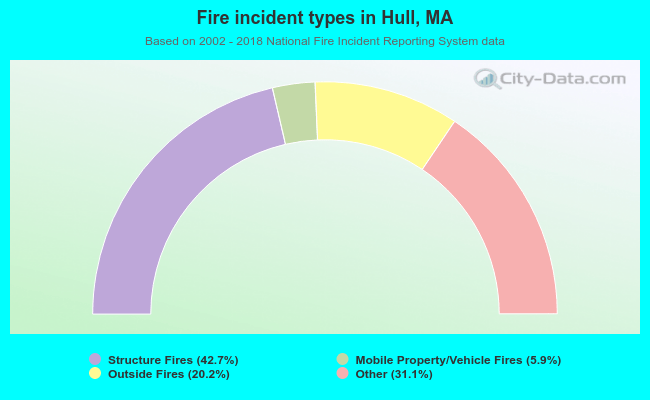 When looking into fire subcategories, the most incidents belonged to: Structure Fires (42.7%), and Other (31.1%).
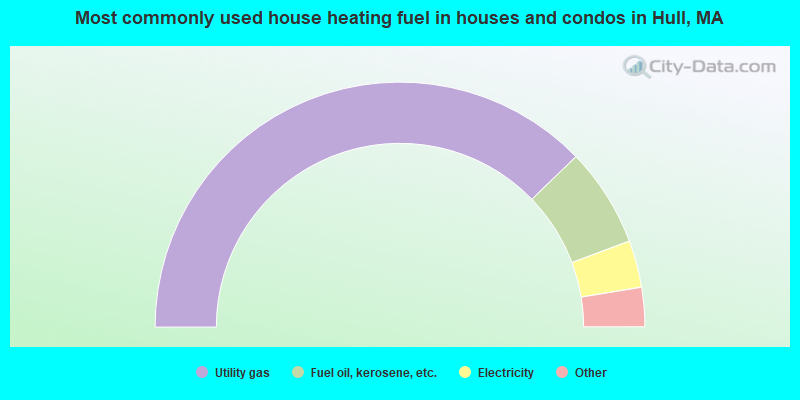
- 75.6%Utility gas
- 13.1%Fuel oil, kerosene, etc.
- 6.2%Electricity
- 3.7%Bottled, tank, or LP gas
- 0.7%Wood
- 0.7%No fuel used
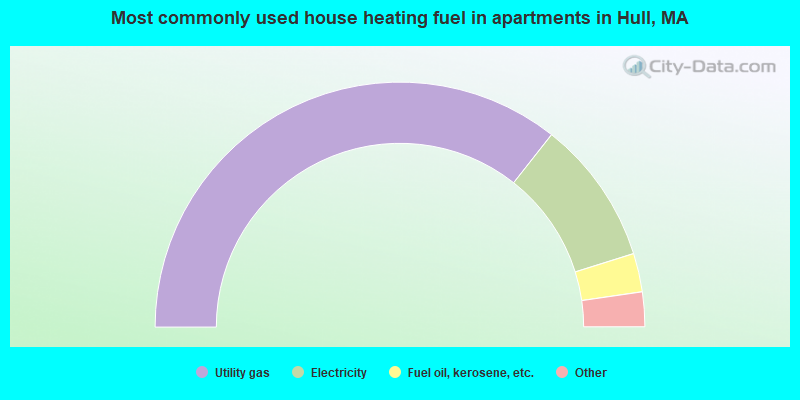
- 71.4%Utility gas
- 19.1%Electricity
- 5.1%Fuel oil, kerosene, etc.
- 3.6%Bottled, tank, or LP gas
- 0.8%Other fuel
Hull compared to Massachusetts state average:
- Unemployed percentage significantly below state average.
- Black race population percentage significantly below state average.
- Hispanic race population percentage significantly below state average.
- Median age significantly above state average.
- Foreign-born population percentage significantly below state average.
- Length of stay since moving in significantly above state average.
- Percentage of population with a bachelor's degree or higher above state average.
Hull on our top lists:
- #9 on the list of "Top 101 cities with the most people taking a ferryboat to work (population 5,000+)"
- #66 (02045) on the list of "Top 101 zip codes with the largest percentage of Irish first ancestries (pop 5,000+)"
- #18 on the list of "Top 101 counties with the highest percentage of residents that visited a dentist within the past year"
- #24 on the list of "Top 101 counties with the highest percentage of residents that smoked 100+ cigarettes in their lives"
- #35 on the list of "Top 101 counties with the largest decrease in the number of births per 1000 residents 2000-2006 to 2007-2013 (pop 50,000+)"
- #39 on the list of "Top 101 counties with the lowest percentage of residents that keep firearms around their homes"
- #39 on the list of "Top 101 counties with the lowest number of infant deaths per 1000 residents 2007-2013 (pop. 50,000+)"

|
|
Total of 74 patent applications in 2008-2024.