Hinesville, Georgia Submit your own pictures of this city and show them to the world
OSM Map
General Map
Google Map
MSN Map
OSM Map
General Map
Google Map
MSN Map
OSM Map
General Map
Google Map
MSN Map
OSM Map
General Map
Google Map
MSN Map
Please wait while loading the map...
Population in 2022: 35,441 (99% urban, 1% rural). Population change since 2000: +16.6%Males: 18,185 Females: 17,256
March 2022 cost of living index in Hinesville: 88.2 (less than average, U.S. average is 100) Percentage of residents living in poverty in 2022: 16.3%for White Non-Hispanic residents , 14.6% for Black residents , 19.1% for Hispanic or Latino residents , 0.9% for American Indian residents , 54.4% for Native Hawaiian and other Pacific Islander residents , 20.5% for other race residents , 19.6% for two or more races residents )
Profiles of local businesses
Business Search - 14 Million verified businesses
Data:
Median household income ($)
Median household income (% change since 2000)
Household income diversity
Ratio of average income to average house value (%)
Ratio of average income to average rent
Median household income ($) - White
Median household income ($) - Black or African American
Median household income ($) - Asian
Median household income ($) - Hispanic or Latino
Median household income ($) - American Indian and Alaska Native
Median household income ($) - Multirace
Median household income ($) - Other Race
Median household income for houses/condos with a mortgage ($)
Median household income for apartments without a mortgage ($)
Races - White alone (%)
Races - White alone (% change since 2000)
Races - Black alone (%)
Races - Black alone (% change since 2000)
Races - American Indian alone (%)
Races - American Indian alone (% change since 2000)
Races - Asian alone (%)
Races - Asian alone (% change since 2000)
Races - Hispanic (%)
Races - Hispanic (% change since 2000)
Races - Native Hawaiian and Other Pacific Islander alone (%)
Races - Native Hawaiian and Other Pacific Islander alone (% change since 2000)
Races - Two or more races (%)
Races - Two or more races (% change since 2000)
Races - Other race alone (%)
Races - Other race alone (% change since 2000)
Racial diversity
Unemployment (%)
Unemployment (% change since 2000)
Unemployment (%) - White
Unemployment (%) - Black or African American
Unemployment (%) - Asian
Unemployment (%) - Hispanic or Latino
Unemployment (%) - American Indian and Alaska Native
Unemployment (%) - Multirace
Unemployment (%) - Other Race
Population density (people per square mile)
Population - Males (%)
Population - Females (%)
Population - Males (%) - White
Population - Males (%) - Black or African American
Population - Males (%) - Asian
Population - Males (%) - Hispanic or Latino
Population - Males (%) - American Indian and Alaska Native
Population - Males (%) - Multirace
Population - Males (%) - Other Race
Population - Females (%) - White
Population - Females (%) - Black or African American
Population - Females (%) - Asian
Population - Females (%) - Hispanic or Latino
Population - Females (%) - American Indian and Alaska Native
Population - Females (%) - Multirace
Population - Females (%) - Other Race
Coronavirus confirmed cases (Jun 12, 2024)
Deaths caused by coronavirus (Jun 12, 2024)
Coronavirus confirmed cases (per 100k population) (Jun 12, 2024)
Deaths caused by coronavirus (per 100k population) (Jun 12, 2024)
Daily increase in number of cases (Jun 12, 2024)
Weekly increase in number of cases (Jun 12, 2024)
Cases doubled (in days) (Jun 12, 2024)
Hospitalized patients (Apr 18, 2022)
Negative test results (Apr 18, 2022)
Total test results (Apr 18, 2022)
COVID Vaccine doses distributed (per 100k population) (Sep 19, 2023)
COVID Vaccine doses administered (per 100k population) (Sep 19, 2023)
COVID Vaccine doses distributed (Sep 19, 2023)
COVID Vaccine doses administered (Sep 19, 2023)
Likely homosexual households (%)
Likely homosexual households (% change since 2000)
Likely homosexual households - Lesbian couples (%)
Likely homosexual households - Lesbian couples (% change since 2000)
Likely homosexual households - Gay men (%)
Likely homosexual households - Gay men (% change since 2000)
Cost of living index
Median gross rent ($)
Median contract rent ($)
Median monthly housing costs ($)
Median house or condo value ($)
Median house or condo value ($ change since 2000)
Mean house or condo value by units in structure - 1, detached ($)
Mean house or condo value by units in structure - 1, attached ($)
Mean house or condo value by units in structure - 2 ($)
Mean house or condo value by units in structure by units in structure - 3 or 4 ($)
Mean house or condo value by units in structure - 5 or more ($)
Mean house or condo value by units in structure - Boat, RV, van, etc. ($)
Mean house or condo value by units in structure - Mobile home ($)
Median house or condo value ($) - White
Median house or condo value ($) - Black or African American
Median house or condo value ($) - Asian
Median house or condo value ($) - Hispanic or Latino
Median house or condo value ($) - American Indian and Alaska Native
Median house or condo value ($) - Multirace
Median house or condo value ($) - Other Race
Median resident age
Resident age diversity
Median resident age - Males
Median resident age - Females
Median resident age - White
Median resident age - Black or African American
Median resident age - Asian
Median resident age - Hispanic or Latino
Median resident age - American Indian and Alaska Native
Median resident age - Multirace
Median resident age - Other Race
Median resident age - Males - White
Median resident age - Males - Black or African American
Median resident age - Males - Asian
Median resident age - Males - Hispanic or Latino
Median resident age - Males - American Indian and Alaska Native
Median resident age - Males - Multirace
Median resident age - Males - Other Race
Median resident age - Females - White
Median resident age - Females - Black or African American
Median resident age - Females - Asian
Median resident age - Females - Hispanic or Latino
Median resident age - Females - American Indian and Alaska Native
Median resident age - Females - Multirace
Median resident age - Females - Other Race
Commute - mean travel time to work (minutes)
Travel time to work - Less than 5 minutes (%)
Travel time to work - Less than 5 minutes (% change since 2000)
Travel time to work - 5 to 9 minutes (%)
Travel time to work - 5 to 9 minutes (% change since 2000)
Travel time to work - 10 to 19 minutes (%)
Travel time to work - 10 to 19 minutes (% change since 2000)
Travel time to work - 20 to 29 minutes (%)
Travel time to work - 20 to 29 minutes (% change since 2000)
Travel time to work - 30 to 39 minutes (%)
Travel time to work - 30 to 39 minutes (% change since 2000)
Travel time to work - 40 to 59 minutes (%)
Travel time to work - 40 to 59 minutes (% change since 2000)
Travel time to work - 60 to 89 minutes (%)
Travel time to work - 60 to 89 minutes (% change since 2000)
Travel time to work - 90 or more minutes (%)
Travel time to work - 90 or more minutes (% change since 2000)
Marital status - Never married (%)
Marital status - Now married (%)
Marital status - Separated (%)
Marital status - Widowed (%)
Marital status - Divorced (%)
Median family income ($)
Median family income (% change since 2000)
Median non-family income ($)
Median non-family income (% change since 2000)
Median per capita income ($)
Median per capita income (% change since 2000)
Median family income ($) - White
Median family income ($) - Black or African American
Median family income ($) - Asian
Median family income ($) - Hispanic or Latino
Median family income ($) - American Indian and Alaska Native
Median family income ($) - Multirace
Median family income ($) - Other Race
Median year house/condo built
Median year apartment built
Year house built - Built 2005 or later (%)
Year house built - Built 2000 to 2004 (%)
Year house built - Built 1990 to 1999 (%)
Year house built - Built 1980 to 1989 (%)
Year house built - Built 1970 to 1979 (%)
Year house built - Built 1960 to 1969 (%)
Year house built - Built 1950 to 1959 (%)
Year house built - Built 1940 to 1949 (%)
Year house built - Built 1939 or earlier (%)
Average household size
Household density (households per square mile)
Average household size - White
Average household size - Black or African American
Average household size - Asian
Average household size - Hispanic or Latino
Average household size - American Indian and Alaska Native
Average household size - Multirace
Average household size - Other Race
Occupied housing units (%)
Vacant housing units (%)
Owner occupied housing units (%)
Renter occupied housing units (%)
Vacancy status - For rent (%)
Vacancy status - For sale only (%)
Vacancy status - Rented or sold, not occupied (%)
Vacancy status - For seasonal, recreational, or occasional use (%)
Vacancy status - For migrant workers (%)
Vacancy status - Other vacant (%)
Residents with income below the poverty level (%)
Residents with income below 50% of the poverty level (%)
Children below poverty level (%)
Poor families by family type - Married-couple family (%)
Poor families by family type - Male, no wife present (%)
Poor families by family type - Female, no husband present (%)
Poverty status for native-born residents (%)
Poverty status for foreign-born residents (%)
Poverty among high school graduates not in families (%)
Poverty among people who did not graduate high school not in families (%)
Residents with income below the poverty level (%) - White
Residents with income below the poverty level (%) - Black or African American
Residents with income below the poverty level (%) - Asian
Residents with income below the poverty level (%) - Hispanic or Latino
Residents with income below the poverty level (%) - American Indian and Alaska Native
Residents with income below the poverty level (%) - Multirace
Residents with income below the poverty level (%) - Other Race
Air pollution - Air Quality Index (AQI)
Air pollution - CO
Air pollution - NO2
Air pollution - SO2
Air pollution - Ozone
Air pollution - PM10
Air pollution - PM25
Air pollution - Pb
Crime - Murders per 100,000 population
Crime - Rapes per 100,000 population
Crime - Robberies per 100,000 population
Crime - Assaults per 100,000 population
Crime - Burglaries per 100,000 population
Crime - Thefts per 100,000 population
Crime - Auto thefts per 100,000 population
Crime - Arson per 100,000 population
Crime - City-data.com crime index
Crime - Violent crime index
Crime - Property crime index
Crime - Murders per 100,000 population (5 year average)
Crime - Rapes per 100,000 population (5 year average)
Crime - Robberies per 100,000 population (5 year average)
Crime - Assaults per 100,000 population (5 year average)
Crime - Burglaries per 100,000 population (5 year average)
Crime - Thefts per 100,000 population (5 year average)
Crime - Auto thefts per 100,000 population (5 year average)
Crime - Arson per 100,000 population (5 year average)
Crime - City-data.com crime index (5 year average)
Crime - Violent crime index (5 year average)
Crime - Property crime index (5 year average)
1996 Presidential Elections Results (%) - Democratic Party (Clinton)
1996 Presidential Elections Results (%) - Republican Party (Dole)
1996 Presidential Elections Results (%) - Other
2000 Presidential Elections Results (%) - Democratic Party (Gore)
2000 Presidential Elections Results (%) - Republican Party (Bush)
2000 Presidential Elections Results (%) - Other
2004 Presidential Elections Results (%) - Democratic Party (Kerry)
2004 Presidential Elections Results (%) - Republican Party (Bush)
2004 Presidential Elections Results (%) - Other
2008 Presidential Elections Results (%) - Democratic Party (Obama)
2008 Presidential Elections Results (%) - Republican Party (McCain)
2008 Presidential Elections Results (%) - Other
2012 Presidential Elections Results (%) - Democratic Party (Obama)
2012 Presidential Elections Results (%) - Republican Party (Romney)
2012 Presidential Elections Results (%) - Other
2016 Presidential Elections Results (%) - Democratic Party (Clinton)
2016 Presidential Elections Results (%) - Republican Party (Trump)
2016 Presidential Elections Results (%) - Other
2020 Presidential Elections Results (%) - Democratic Party (Biden)
2020 Presidential Elections Results (%) - Republican Party (Trump)
2020 Presidential Elections Results (%) - Other
Ancestries Reported - Arab (%)
Ancestries Reported - Czech (%)
Ancestries Reported - Danish (%)
Ancestries Reported - Dutch (%)
Ancestries Reported - English (%)
Ancestries Reported - French (%)
Ancestries Reported - French Canadian (%)
Ancestries Reported - German (%)
Ancestries Reported - Greek (%)
Ancestries Reported - Hungarian (%)
Ancestries Reported - Irish (%)
Ancestries Reported - Italian (%)
Ancestries Reported - Lithuanian (%)
Ancestries Reported - Norwegian (%)
Ancestries Reported - Polish (%)
Ancestries Reported - Portuguese (%)
Ancestries Reported - Russian (%)
Ancestries Reported - Scotch-Irish (%)
Ancestries Reported - Scottish (%)
Ancestries Reported - Slovak (%)
Ancestries Reported - Subsaharan African (%)
Ancestries Reported - Swedish (%)
Ancestries Reported - Swiss (%)
Ancestries Reported - Ukrainian (%)
Ancestries Reported - United States (%)
Ancestries Reported - Welsh (%)
Ancestries Reported - West Indian (%)
Ancestries Reported - Other (%)
Educational Attainment - No schooling completed (%)
Educational Attainment - Less than high school (%)
Educational Attainment - High school or equivalent (%)
Educational Attainment - Less than 1 year of college (%)
Educational Attainment - 1 or more years of college (%)
Educational Attainment - Associate degree (%)
Educational Attainment - Bachelor's degree (%)
Educational Attainment - Master's degree (%)
Educational Attainment - Professional school degree (%)
Educational Attainment - Doctorate degree (%)
School Enrollment - Nursery, preschool (%)
School Enrollment - Kindergarten (%)
School Enrollment - Grade 1 to 4 (%)
School Enrollment - Grade 5 to 8 (%)
School Enrollment - Grade 9 to 12 (%)
School Enrollment - College undergrad (%)
School Enrollment - Graduate or professional (%)
School Enrollment - Not enrolled in school (%)
School enrollment - Public schools (%)
School enrollment - Private schools (%)
School enrollment - Not enrolled (%)
Median number of rooms in houses and condos
Median number of rooms in apartments
Housing units lacking complete plumbing facilities (%)
Housing units lacking complete kitchen facilities (%)
Density of houses
Urban houses (%)
Rural houses (%)
Households with people 60 years and over (%)
Households with people 65 years and over (%)
Households with people 75 years and over (%)
Households with one or more nonrelatives (%)
Households with no nonrelatives (%)
Population in households (%)
Family households (%)
Nonfamily households (%)
Population in families (%)
Family households with own children (%)
Median number of bedrooms in owner occupied houses
Mean number of bedrooms in owner occupied houses
Median number of bedrooms in renter occupied houses
Mean number of bedrooms in renter occupied houses
Median number of vehichles in owner occupied houses
Mean number of vehichles in owner occupied houses
Median number of vehichles in renter occupied houses
Mean number of vehichles in renter occupied houses
Mortgage status - with mortgage (%)
Mortgage status - with second mortgage (%)
Mortgage status - with home equity loan (%)
Mortgage status - with both second mortgage and home equity loan (%)
Mortgage status - without a mortgage (%)
Average family size
Average family size - White
Average family size - Black or African American
Average family size - Asian
Average family size - Hispanic or Latino
Average family size - American Indian and Alaska Native
Average family size - Multirace
Average family size - Other Race
Geographical mobility - Same house 1 year ago (%)
Geographical mobility - Moved within same county (%)
Geographical mobility - Moved from different county within same state (%)
Geographical mobility - Moved from different state (%)
Geographical mobility - Moved from abroad (%)
Place of birth - Born in state of residence (%)
Place of birth - Born in other state (%)
Place of birth - Native, outside of US (%)
Place of birth - Foreign born (%)
Housing units in structures - 1, detached (%)
Housing units in structures - 1, attached (%)
Housing units in structures - 2 (%)
Housing units in structures - 3 or 4 (%)
Housing units in structures - 5 to 9 (%)
Housing units in structures - 10 to 19 (%)
Housing units in structures - 20 to 49 (%)
Housing units in structures - 50 or more (%)
Housing units in structures - Mobile home (%)
Housing units in structures - Boat, RV, van, etc. (%)
House/condo owner moved in on average (years ago)
Renter moved in on average (years ago)
Year householder moved into unit - Moved in 1999 to March 2000 (%)
Year householder moved into unit - Moved in 1995 to 1998 (%)
Year householder moved into unit - Moved in 1990 to 1994 (%)
Year householder moved into unit - Moved in 1980 to 1989 (%)
Year householder moved into unit - Moved in 1970 to 1979 (%)
Year householder moved into unit - Moved in 1969 or earlier (%)
Means of transportation to work - Drove car alone (%)
Means of transportation to work - Carpooled (%)
Means of transportation to work - Public transportation (%)
Means of transportation to work - Bus or trolley bus (%)
Means of transportation to work - Streetcar or trolley car (%)
Means of transportation to work - Subway or elevated (%)
Means of transportation to work - Railroad (%)
Means of transportation to work - Ferryboat (%)
Means of transportation to work - Taxicab (%)
Means of transportation to work - Motorcycle (%)
Means of transportation to work - Bicycle (%)
Means of transportation to work - Walked (%)
Means of transportation to work - Other means (%)
Working at home (%)
Industry diversity
Most Common Industries - Agriculture, forestry, fishing and hunting, and mining (%)
Most Common Industries - Agriculture, forestry, fishing and hunting (%)
Most Common Industries - Mining, quarrying, and oil and gas extraction (%)
Most Common Industries - Construction (%)
Most Common Industries - Manufacturing (%)
Most Common Industries - Wholesale trade (%)
Most Common Industries - Retail trade (%)
Most Common Industries - Transportation and warehousing, and utilities (%)
Most Common Industries - Transportation and warehousing (%)
Most Common Industries - Utilities (%)
Most Common Industries - Information (%)
Most Common Industries - Finance and insurance, and real estate and rental and leasing (%)
Most Common Industries - Finance and insurance (%)
Most Common Industries - Real estate and rental and leasing (%)
Most Common Industries - Professional, scientific, and management, and administrative and waste management services (%)
Most Common Industries - Professional, scientific, and technical services (%)
Most Common Industries - Management of companies and enterprises (%)
Most Common Industries - Administrative and support and waste management services (%)
Most Common Industries - Educational services, and health care and social assistance (%)
Most Common Industries - Educational services (%)
Most Common Industries - Health care and social assistance (%)
Most Common Industries - Arts, entertainment, and recreation, and accommodation and food services (%)
Most Common Industries - Arts, entertainment, and recreation (%)
Most Common Industries - Accommodation and food services (%)
Most Common Industries - Other services, except public administration (%)
Most Common Industries - Public administration (%)
Occupation diversity
Most Common Occupations - Management, business, science, and arts occupations (%)
Most Common Occupations - Management, business, and financial occupations (%)
Most Common Occupations - Management occupations (%)
Most Common Occupations - Business and financial operations occupations (%)
Most Common Occupations - Computer, engineering, and science occupations (%)
Most Common Occupations - Computer and mathematical occupations (%)
Most Common Occupations - Architecture and engineering occupations (%)
Most Common Occupations - Life, physical, and social science occupations (%)
Most Common Occupations - Education, legal, community service, arts, and media occupations (%)
Most Common Occupations - Community and social service occupations (%)
Most Common Occupations - Legal occupations (%)
Most Common Occupations - Education, training, and library occupations (%)
Most Common Occupations - Arts, design, entertainment, sports, and media occupations (%)
Most Common Occupations - Healthcare practitioners and technical occupations (%)
Most Common Occupations - Health diagnosing and treating practitioners and other technical occupations (%)
Most Common Occupations - Health technologists and technicians (%)
Most Common Occupations - Service occupations (%)
Most Common Occupations - Healthcare support occupations (%)
Most Common Occupations - Protective service occupations (%)
Most Common Occupations - Fire fighting and prevention, and other protective service workers including supervisors (%)
Most Common Occupations - Law enforcement workers including supervisors (%)
Most Common Occupations - Food preparation and serving related occupations (%)
Most Common Occupations - Building and grounds cleaning and maintenance occupations (%)
Most Common Occupations - Personal care and service occupations (%)
Most Common Occupations - Sales and office occupations (%)
Most Common Occupations - Sales and related occupations (%)
Most Common Occupations - Office and administrative support occupations (%)
Most Common Occupations - Natural resources, construction, and maintenance occupations (%)
Most Common Occupations - Farming, fishing, and forestry occupations (%)
Most Common Occupations - Construction and extraction occupations (%)
Most Common Occupations - Installation, maintenance, and repair occupations (%)
Most Common Occupations - Production, transportation, and material moving occupations (%)
Most Common Occupations - Production occupations (%)
Most Common Occupations - Transportation occupations (%)
Most Common Occupations - Material moving occupations (%)
People in Group quarters - Institutionalized population (%)
People in Group quarters - Correctional institutions (%)
People in Group quarters - Federal prisons and detention centers (%)
People in Group quarters - Halfway houses (%)
People in Group quarters - Local jails and other confinement facilities (including police lockups) (%)
People in Group quarters - Military disciplinary barracks (%)
People in Group quarters - State prisons (%)
People in Group quarters - Other types of correctional institutions (%)
People in Group quarters - Nursing homes (%)
People in Group quarters - Hospitals/wards, hospices, and schools for the handicapped (%)
People in Group quarters - Hospitals/wards and hospices for chronically ill (%)
People in Group quarters - Hospices or homes for chronically ill (%)
People in Group quarters - Military hospitals or wards for chronically ill (%)
People in Group quarters - Other hospitals or wards for chronically ill (%)
People in Group quarters - Hospitals or wards for drug/alcohol abuse (%)
People in Group quarters - Mental (Psychiatric) hospitals or wards (%)
People in Group quarters - Schools, hospitals, or wards for the mentally retarded (%)
People in Group quarters - Schools, hospitals, or wards for the physically handicapped (%)
People in Group quarters - Institutions for the deaf (%)
People in Group quarters - Institutions for the blind (%)
People in Group quarters - Orthopedic wards and institutions for the physically handicapped (%)
People in Group quarters - Wards in general hospitals for patients who have no usual home elsewhere (%)
People in Group quarters - Wards in military hospitals for patients who have no usual home elsewhere (%)
People in Group quarters - Juvenile institutions (%)
People in Group quarters - Long-term care (%)
People in Group quarters - Homes for abused, dependent, and neglected children (%)
People in Group quarters - Residential treatment centers for emotionally disturbed children (%)
People in Group quarters - Training schools for juvenile delinquents (%)
People in Group quarters - Short-term care, detention or diagnostic centers for delinquent children (%)
People in Group quarters - Type of juvenile institution unknown (%)
People in Group quarters - Noninstitutionalized population (%)
People in Group quarters - College dormitories (includes college quarters off campus) (%)
People in Group quarters - Military quarters (%)
People in Group quarters - On base (%)
People in Group quarters - Barracks, unaccompanied personnel housing (UPH), (Enlisted/Officer), ;and similar group living quarters for military personnel (%)
People in Group quarters - Transient quarters for temporary residents (%)
People in Group quarters - Military ships (%)
People in Group quarters - Group homes (%)
People in Group quarters - Homes or halfway houses for drug/alcohol abuse (%)
People in Group quarters - Homes for the mentally ill (%)
People in Group quarters - Homes for the mentally retarded (%)
People in Group quarters - Homes for the physically handicapped (%)
People in Group quarters - Other group homes (%)
People in Group quarters - Religious group quarters (%)
People in Group quarters - Dormitories (%)
People in Group quarters - Agriculture workers' dormitories on farms (%)
People in Group quarters - Job Corps and vocational training facilities (%)
People in Group quarters - Other workers' dormitories (%)
People in Group quarters - Crews of maritime vessels (%)
People in Group quarters - Other nonhousehold living situations (%)
People in Group quarters - Other noninstitutional group quarters (%)
Residents speaking English at home (%)
Residents speaking English at home - Born in the United States (%)
Residents speaking English at home - Native, born elsewhere (%)
Residents speaking English at home - Foreign born (%)
Residents speaking Spanish at home (%)
Residents speaking Spanish at home - Born in the United States (%)
Residents speaking Spanish at home - Native, born elsewhere (%)
Residents speaking Spanish at home - Foreign born (%)
Residents speaking other language at home (%)
Residents speaking other language at home - Born in the United States (%)
Residents speaking other language at home - Native, born elsewhere (%)
Residents speaking other language at home - Foreign born (%)
Class of Workers - Employee of private company (%)
Class of Workers - Self-employed in own incorporated business (%)
Class of Workers - Private not-for-profit wage and salary workers (%)
Class of Workers - Local government workers (%)
Class of Workers - State government workers (%)
Class of Workers - Federal government workers (%)
Class of Workers - Self-employed workers in own not incorporated business and Unpaid family workers (%)
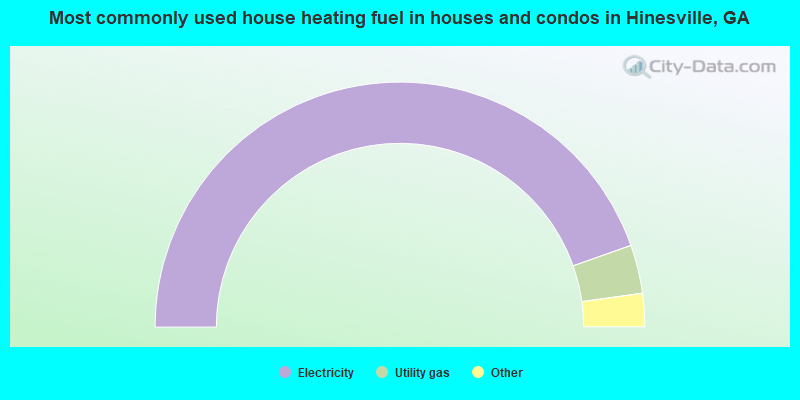
House heating fuel used in houses and condos - Utility gas (%)
House heating fuel used in houses and condos - Bottled, tank, or LP gas (%)
House heating fuel used in houses and condos - Electricity (%)
House heating fuel used in houses and condos - Fuel oil, kerosene, etc. (%)
House heating fuel used in houses and condos - Coal or coke (%)
House heating fuel used in houses and condos - Wood (%)
House heating fuel used in houses and condos - Solar energy (%)
House heating fuel used in houses and condos - Other fuel (%)
House heating fuel used in houses and condos - No fuel used (%)
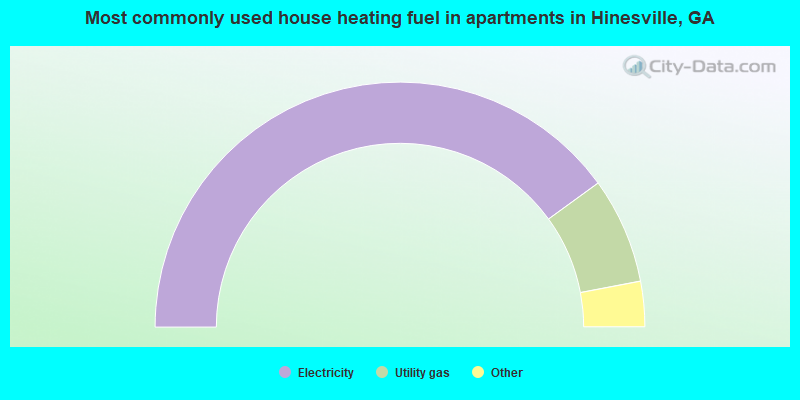
House heating fuel used in apartments - Utility gas (%)
House heating fuel used in apartments - Bottled, tank, or LP gas (%)
House heating fuel used in apartments - Electricity (%)
House heating fuel used in apartments - Fuel oil, kerosene, etc. (%)
House heating fuel used in apartments - Coal or coke (%)
House heating fuel used in apartments - Wood (%)
House heating fuel used in apartments - Solar energy (%)
House heating fuel used in apartments - Other fuel (%)
House heating fuel used in apartments - No fuel used (%)
Armed forces status - In Armed Forces (%)
Armed forces status - Civilian (%)
Armed forces status - Civilian - Veteran (%)
Armed forces status - Civilian - Nonveteran (%)
Fatal accidents locations in years 2005-2021
Fatal accidents locations in 2005
Fatal accidents locations in 2006
Fatal accidents locations in 2007
Fatal accidents locations in 2008
Fatal accidents locations in 2009
Fatal accidents locations in 2010
Fatal accidents locations in 2011
Fatal accidents locations in 2012
Fatal accidents locations in 2013
Fatal accidents locations in 2014
Fatal accidents locations in 2015
Fatal accidents locations in 2016
Fatal accidents locations in 2017
Fatal accidents locations in 2018
Fatal accidents locations in 2019
Fatal accidents locations in 2020
Fatal accidents locations in 2021
Alcohol use - People drinking some alcohol every month (%)
Alcohol use - People not drinking at all (%)
Alcohol use - Average days/month drinking alcohol
Alcohol use - Average drinks/week
Alcohol use - Average days/year people drink much
Audiometry - Average condition of hearing (%)
Audiometry - People that can hear a whisper from across a quiet room (%)
Audiometry - People that can hear normal voice from across a quiet room (%)
Audiometry - Ears ringing, roaring, buzzing (%)
Audiometry - Had a job exposure to loud noise (%)
Audiometry - Had off-work exposure to loud noise (%)
Blood Pressure & Cholesterol - Has high blood pressure (%)
Blood Pressure & Cholesterol - Checking blood pressure at home (%)
Blood Pressure & Cholesterol - Frequently checking blood cholesterol (%)
Blood Pressure & Cholesterol - Has high cholesterol level (%)
Consumer Behavior - Money monthly spent on food at supermarket/grocery store
Consumer Behavior - Money monthly spent on food at other stores
Consumer Behavior - Money monthly spent on eating out
Consumer Behavior - Money monthly spent on carryout/delivered foods
Consumer Behavior - Income spent on food at supermarket/grocery store (%)
Consumer Behavior - Income spent on food at other stores (%)
Consumer Behavior - Income spent on eating out (%)
Consumer Behavior - Income spent on carryout/delivered foods (%)
Current Health Status - General health condition (%)
Current Health Status - Blood donors (%)
Current Health Status - Has blood ever tested for HIV virus (%)
Current Health Status - Left-handed people (%)
Dermatology - People using sunscreen (%)
Diabetes - Diabetics (%)
Diabetes - Had a blood test for high blood sugar (%)
Diabetes - People taking insulin (%)
Diet Behavior & Nutrition - Diet health (%)
Diet Behavior & Nutrition - Milk product consumption (# of products/month)
Diet Behavior & Nutrition - Meals not home prepared (#/week)
Diet Behavior & Nutrition - Meals from fast food or pizza place (#/week)
Diet Behavior & Nutrition - Ready-to-eat foods (#/month)
Diet Behavior & Nutrition - Frozen meals/pizza (#/month)
Drug Use - People that ever used marijuana or hashish (%)
Drug Use - Ever used hard drugs (%)
Drug Use - Ever used any form of cocaine (%)
Drug Use - Ever used heroin (%)
Drug Use - Ever used methamphetamine (%)
Health Insurance - People covered by health insurance (%)
Kidney Conditions-Urology - Avg. # of times urinating at night
Medical Conditions - People with asthma (%)
Medical Conditions - People with anemia (%)
Medical Conditions - People with psoriasis (%)
Medical Conditions - People with overweight (%)
Medical Conditions - Elderly people having difficulties in thinking or remembering (%)
Medical Conditions - People who ever received blood transfusion (%)
Medical Conditions - People having trouble seeing even with glass/contacts (%)
Medical Conditions - People with arthritis (%)
Medical Conditions - People with gout (%)
Medical Conditions - People with congestive heart failure (%)
Medical Conditions - People with coronary heart disease (%)
Medical Conditions - People with angina pectoris (%)
Medical Conditions - People who ever had heart attack (%)
Medical Conditions - People who ever had stroke (%)
Medical Conditions - People with emphysema (%)
Medical Conditions - People with thyroid problem (%)
Medical Conditions - People with chronic bronchitis (%)
Medical Conditions - People with any liver condition (%)
Medical Conditions - People who ever had cancer or malignancy (%)
Mental Health - People who have little interest in doing things (%)
Mental Health - People feeling down, depressed, or hopeless (%)
Mental Health - People who have trouble sleeping or sleeping too much (%)
Mental Health - People feeling tired or having little energy (%)
Mental Health - People with poor appetite or overeating (%)
Mental Health - People feeling bad about themself (%)
Mental Health - People who have trouble concentrating on things (%)
Mental Health - People moving or speaking slowly or too fast (%)
Mental Health - People having thoughts they would be better off dead (%)
Oral Health - Average years since last visit a dentist
Oral Health - People embarrassed because of mouth (%)
Oral Health - People with gum disease (%)
Oral Health - General health of teeth and gums (%)
Oral Health - Average days a week using dental floss/device
Oral Health - Average days a week using mouthwash for dental problem
Oral Health - Average number of teeth
Pesticide Use - Households using pesticides to control insects (%)
Pesticide Use - Households using pesticides to kill weeds (%)
Physical Activity - People doing vigorous-intensity work activities (%)
Physical Activity - People doing moderate-intensity work activities (%)
Physical Activity - People walking or bicycling (%)
Physical Activity - People doing vigorous-intensity recreational activities (%)
Physical Activity - People doing moderate-intensity recreational activities (%)
Physical Activity - Average hours a day doing sedentary activities
Physical Activity - Average hours a day watching TV or videos
Physical Activity - Average hours a day using computer
Physical Functioning - People having limitations keeping them from working (%)
Physical Functioning - People limited in amount of work they can do (%)
Physical Functioning - People that need special equipment to walk (%)
Physical Functioning - People experiencing confusion/memory problems (%)
Physical Functioning - People requiring special healthcare equipment (%)
Prescription Medications - Average number of prescription medicines taking
Preventive Aspirin Use - Adults 40+ taking low-dose aspirin (%)
Reproductive Health - Vaginal deliveries (%)
Reproductive Health - Cesarean deliveries (%)
Reproductive Health - Deliveries resulted in a live birth (%)
Reproductive Health - Pregnancies resulted in a delivery (%)
Reproductive Health - Women breastfeeding newborns (%)
Reproductive Health - Women that had a hysterectomy (%)
Reproductive Health - Women that had both ovaries removed (%)
Reproductive Health - Women that have ever taken birth control pills (%)
Reproductive Health - Women taking birth control pills (%)
Reproductive Health - Women that have ever used Depo-Provera or injectables (%)
Reproductive Health - Women that have ever used female hormones (%)
Sexual Behavior - People 18+ that ever had sex (vaginal, anal, or oral) (%)
Sexual Behavior - Males 18+ that ever had vaginal sex with a woman (%)
Sexual Behavior - Males 18+ that ever performed oral sex on a woman (%)
Sexual Behavior - Males 18+ that ever had anal sex with a woman (%)
Sexual Behavior - Males 18+ that ever had any sex with a man (%)
Sexual Behavior - Females 18+ that ever had vaginal sex with a man (%)
Sexual Behavior - Females 18+ that ever performed oral sex on a man (%)
Sexual Behavior - Females 18+ that ever had anal sex with a man (%)
Sexual Behavior - Females 18+ that ever had any kind of sex with a woman (%)
Sexual Behavior - Average age people first had sex
Sexual Behavior - Average number of female sex partners in lifetime (males 18+)
Sexual Behavior - Average number of female vaginal sex partners in lifetime (males 18+)
Sexual Behavior - Average age people first performed oral sex on a woman (18+)
Sexual Behavior - Average number of woman performed oral sex on in lifetime (18+)
Sexual Behavior - Average number of male sex partners in lifetime (males 18+)
Sexual Behavior - Average number of male anal sex partners in lifetime (males 18+)
Sexual Behavior - Average age people first performed oral sex on a man (18+)
Sexual Behavior - Average number of male oral sex partners in lifetime (18+)
Sexual Behavior - People using protection when performing oral sex (%)
Sexual Behavior - Average number of times people have vaginal or anal sex a year
Sexual Behavior - People having sex without condom (%)
Sexual Behavior - Average number of male sex partners in lifetime (females 18+)
Sexual Behavior - Average number of male vaginal sex partners in lifetime (females 18+)
Sexual Behavior - Average number of female sex partners in lifetime (females 18+)
Sexual Behavior - Circumcised males 18+ (%)
Sleep Disorders - Average hours sleeping at night
Sleep Disorders - People that has trouble sleeping (%)
Smoking-Cigarette Use - People smoking cigarettes (%)
Taste & Smell - People 40+ having problems with smell (%)
Taste & Smell - People 40+ having problems with taste (%)
Taste & Smell - People 40+ that ever had wisdom teeth removed (%)
Taste & Smell - People 40+ that ever had tonsils teeth removed (%)
Taste & Smell - People 40+ that ever had a loss of consciousness because of a head injury (%)
Taste & Smell - People 40+ that ever had a broken nose or other serious injury to face or skull (%)
Taste & Smell - People 40+ that ever had two or more sinus infections (%)
Weight - Average height (inches)
Weight - Average weight (pounds)
Weight - Average BMI
Weight - People that are obese (%)
Weight - People that ever were obese (%)
Weight - People trying to lose weight (%)
Officers per 1,000 residents here:
2.19Georgia average:
2.45
Latest news from Hinesville, GA collected exclusively by city-data.com from local newspapers, TV, and radio stations
Hinesville, GA City Guides: Ancestries: English (3.9%), American (3.6%), German (2.2%), Jamaican (1.6%), European (1.5%), Irish (1.5%).
Current Local Time:
Land area: 16.2 square miles.
Population density: 2,185 people per square mile (low).
3,003 residents are foreign born (3.0% Latin America , 1.8% Asia , 1.8% Europe , 1.0% Africa ).
This city:
8.3%Georgia:
10.4%
Median real estate property taxes paid for housing units with mortgages in 2022: $2,123 (1.2%)Median real estate property taxes paid for housing units with no mortgage in 2022: $1,678 (1.0%)
Nearest city with pop. 50,000+: Savannah, GA
Nearest city with pop. 200,000+: Jacksonville, FL
Nearest city with pop. 1,000,000+: Philadelphia, PA
Nearest cities:
Latitude: 31.83 N, Longitude: 81.61 W
Daytime population change due to commuting: -5,705 (-15.8%)Workers who live and work in this city: 6,539 (37.4%)
Single-family new house construction building permits:
2022: 321 buildings , average cost: $197,3002021: 179 buildings , average cost: $226,9002020: 138 buildings , average cost: $246,3002019: 228 buildings , average cost: $232,0002018: 181 buildings , average cost: $235,4002017: 194 buildings , average cost: $269,5002016: 143 buildings , average cost: $266,2002015: 142 buildings , average cost: $278,9002014: 127 buildings , average cost: $256,8002013: 130 buildings , average cost: $285,5002012: 164 buildings , average cost: $276,3002011: 142 buildings , average cost: $221,8002010: 59 buildings , average cost: $224,5002009: 71 buildings , average cost: $258,9002008: 66 buildings , average cost: $211,1002007: 58 buildings , average cost: $219,9002006: 84 buildings , average cost: $99,4002005: 112 buildings , average cost: $119,3002004: 107 buildings , average cost: $120,2002003: 177 buildings , average cost: $100,2002002: 100 buildings , average cost: $100,7002001: 92 buildings , average cost: $100,9002000: 113 buildings , average cost: $86,6001999: 166 buildings , average cost: $78,0001998: 178 buildings , average cost: $68,6001997: 208 buildings , average cost: $69,200Unemployment in December 2023:
Population change in the 1990s: +8,575 (+39.3%).
Most common occupations in Hinesville, GA (%)
Both Males Females
Other sales and related occupations, including supervisors (5.1%)
Law enforcement workers, including supervisors (4.3%)
Building and grounds cleaning and maintenance occupations (4.0%)
Driver/sales workers and truck drivers (3.9%)
Preschool, kindergarten, elementary, and middle school teachers (3.8%)
Other office and administrative support workers, including supervisors (3.8%)
Retail sales workers, except cashiers (3.7%)
Driver/sales workers and truck drivers (8.5%)
Law enforcement workers, including supervisors (7.2%)
Vehicle and mobile equipment mechanics, installers, and repairers (6.0%)
Other sales and related occupations, including supervisors (5.7%)
Electrical equipment mechanics and other installation, maintenance, and repair workers, including supervisors (5.2%)
Laborers and material movers, hand (4.8%)
Other production occupations, including supervisors (4.7%)
Preschool, kindergarten, elementary, and middle school teachers (6.1%)
Other office and administrative support workers, including supervisors (5.7%)
Child care workers (5.5%)
Secretaries and administrative assistants (5.1%)
Cashiers (5.1%)
Other sales and related occupations, including supervisors (4.6%)
Retail sales workers, except cashiers (4.3%)
Tornado activity:
Hinesville-area historical tornado activity is below Georgia state average. It is 34% smaller than the overall U.S. average.
On 5/11/2008, a category F4 (max. wind speeds 207-260 mph) tornado 30.6 miles away from the Hinesville city center injured 9 people and caused $13 million in damages.
On 4/9/1998, a category F3 (max. wind speeds 158-206 mph) tornado 23.4 miles away from the city center killed 2 people and injured 17 people and caused $3 million in damages.
Earthquake activity:
Hinesville-area historical earthquake activity is significantly above Georgia state average. It is 46% smaller than the overall U.S. average. On 8/2/1974 at 08:52:09, a magnitude 4.9 (4.3 MB, 4.9 LG, Class: Light, Intensity: IV - V) earthquake occurred 150.0 miles away from the city center On 11/22/1974 at 05:25:55, a magnitude 4.7 (4.7 MB) earthquake occurred 113.1 miles away from the city center On 8/21/1992 at 16:31:55, a magnitude 4.4 (4.1 MB, 4.1 LG, 4.4 LG, Depth: 6.2 mi) earthquake occurred 121.3 miles away from the city center On 11/11/2002 at 23:39:29, a magnitude 4.0 (4.0 MB, Depth: 1.5 mi) earthquake occurred 105.8 miles away from Hinesville center On 8/9/2020 at 12:07:37, a magnitude 5.1 (5.1 MW, Depth: 4.7 mi, Class: Moderate, Intensity: VI - VII) earthquake occurred 322.5 miles away from the city center On 2/15/2014 at 03:23:38, a magnitude 4.1 (4.1 MW, Depth: 3.2 mi) earthquake occurred 140.1 miles away from Hinesville center Magnitude types: regional Lg-wave magnitude (LG), body-wave magnitude (MB), moment magnitude (MW) Natural disasters: The number of natural disasters in Liberty County (8) is smaller than the US average (15).Major Disasters (Presidential) Declared: 2Emergencies Declared: 5Hurricanes: 4, Drought: 1, Flood: 1, Snowfall: 1, Storm: 1, Tornado: 1, Winter Storm: 1, Other: 1 (Note: some incidents may be assigned to more than one category). Hospitals and medical centers in Hinesville: COASTAL HOSPICE (410 N. MAIN STREET) LIBERTY REGIONAL MEDICAL CENTER (Government - Hospital District or Authority, provides emergency services, 462 E G MILES PARKWAY) HINESVILLE DIALYSIS (522 EG MILES PARKWAY)
MAGNOLIA OAKS DIALYSIS (2377 HWY 196 WEST)
ST JOSEPH'S/ CANDLER HOME HEALTHCARE (401 NORTH MAIN STREET)
Colleges/universities with over 2000 students nearest to Hinesville:
Armstrong Atlantic State University (about 29 miles; Savannah, GA ; Full-time enrollment: 6,399)
South University–Savannah Online (about 32 miles; Savannah, GA ; FT enrollment: 13,512)
Savannah Technical College (about 33 miles; Savannah, GA ; FT enrollment: 3,677)
Savannah College of Art and Design (about 35 miles; Savannah, GA ; FT enrollment: 9,964)
Savannah State University (about 35 miles; Savannah, GA ; FT enrollment: 4,193)
Georgia Southern University (about 43 miles; Statesboro, GA ; FT enrollment: 18,824)
College of Coastal Georgia (about 49 miles; Brunswick, GA ; FT enrollment: 2,447)
Public high schools in Hinesville:
Private high school in Hinesville: FIRST PRESBYTERIAN CHRISTIAN ACADEMY Students: 336, Location: 308 E COURT ST, Grades: PK-12)
Public elementary/middle schools in Hinesville: BUTTON GWINNETT ELEMENTARY SCHOOL Students: 1,008, Location: 635 TAYLOR RD, Grades: PK-5)LEWIS FRASIER MIDDLE SCHOOL Students: 919, Location: 910 LONG FRASIER DR, Grades: 6-8)TAYLORS CREEK ELEMENTARY SCHOOL Students: 636, Location: 378 AIRPORT RD, Grades: KG-5)FRANK LONG ELEMENTARY SCHOOL Students: 627, Location: 920 LONG FRASIER DR, Grades: KG-5)LYMAN HALL ELEMENTARY SCHOOL Students: 598, Location: 1396 SHAW RD, Grades: KG-5)WALDO PAFFORD ELEMENTARY SCHOOL Students: 532, Location: 2550 15TH ST, Grades: KG-5)JOSEPH MARTIN ELEMENTARY SCHOOL Students: 499, Location: 1000 JOSEPH MARTIN RD, Grades: KG-5)SNELSON-GOLDEN MIDDLE SCHOOL Location: 465 COATES RD, Grades: 6-8)
Private elementary/middle school in Hinesville: TRINITY CHRISTIAN ACADEMY Students: 16, Location: 1016 LIVE OAK DR, Grades: PK-7)
See full list of schools located in Hinesville User-submitted facts and corrections:
The address for Snelson-Golden Middle School should be 465 Coates Road.
Bradwell Institue is not a Primary/Middle School, it is the biggest high school in Hinesville, grades 9-12.
The address for Snelson-Golden Middle School should be 465 Coates Road.
Savannah Technical College is another institution in/near Hinesville that has over 2000 students.
Bradwell Institute is a public high school not a middle/secondary.
Notable locations in Hinesville: (A) , Hinesville Industrial Park (B) , Hinesville Fire Department Station 2 (C) , Hinesville Fire Department Station 1 (D) , Liberty County Jail (E) , Liberty County Sheriff's Department (F) , Live Oak Public Library System Liberty Branch (G) , Liberty County Courthouse (H) , Hinesville City Hall (I) . Display/hide their locations on the map
Churches in Hinesville include: (A) , Full Gospel Tabernacle Church (B) , First Presbyterian Church (C) , Trinity Missionary Baptist Church (D) , Saint Stephen Catholic Church (E) , Saint Philips Episcopal Church (F) , South Main Baptist Church (G) , Liberty Christian Fellowship Church (H) , Korean United Methodist Church (I) . Display/hide their locations on the map
Cemeteries: (1) , Flemington Cemetery (2) , Hinesville Cemetery (3) , Popples Cemetery (4) . Display/hide their locations on the map
Reservoirs and swamps: (A) , Terrells Millpond (B) , Melvin Swamp (C) . Display/hide their locations on the map
Tourist attractions: (1) , M&M Art Travel (Cultural Attractions- Events- & Facilities; 907 Bradwell St) (2) . Display/hide their approximate locations on the map
Hotels: (1) , Comfort Suites Hinesville (70 Wallace Martin Drive) (2) , Days Inn (738 East Oglethorpe Highway) (3) , Country Inn & Suites (742 East General Stewart Way) (4) , Hampton Inn (1148 East Oglethorpe Highway) (5) , Country Inn-Stes Hinesville (742 General Stewart Way) (6) , Budget Motel of USA (744 East Oglethorpe Highway) (7) . Display/hide their approximate locations on the map
Courts: (1) , Sheriffs Department - Court House (100 Main Street) (2) , Georgia State Government - Judge Of Superior Court (Main Street) (3) , Probate Court (112 South Main Street) (4) , Liberty CO - State Court Solicitor Court House (100 Main Street) (5) , Liberty CO - Sheriff's Department Court House- Mace Drug Task Force (1763 Ga Highway 196 West) (6) , Liberty CO - Public Defender's Office Court House (100 Main Street) (7) , Liberty CO - Probate Court (112 South Main Street) (8) , Liberty Co - Magistrate Court- Judge Melinda Anderson (112 South Main Street) (9) . Display/hide their approximate locations on the map
Birthplace of: Charles E. Fraser - Resort Developer, Joseph Bacon Fraser - Army general, David McMillan - 2005 NFL player (Cleveland Browns, born : Sep 20, 1981), Gary Guyton - Football player, Marcus Henry - Football player, Wesly Mallard - 2005 NFL player (New England Patriots, born : Nov 21, 1978), Will Pettis - Football player, David McMillan (American football) - Football player, Ruth Harper - Politician.
Liberty County has a predicted average indoor radon screening level less than 2 pCi/L (pico curies per liter) - Low Potential Drinking water stations with addresses in Hinesville and their reported violations in the past:
DENMARK TRAILER PARK (Population served: 110, Groundwater):
Past monitoring violations:
6 routine major monitoring violations
Population served: 42, Groundwater):
Past health violations:
MCL, Monthly (TCR) - In AUG-2008, Contaminant: Coliform. Follow-up actions: St Public Notif received (SEP-10-2008), St Public Notif requested (SEP-22-2008), St Violation/Reminder Notice (SEP-22-2008)
Past monitoring violations:
Follow-up Or Routine LCR Tap M/R - In OCT-01-2009, Contaminant: Lead and Copper Rule. Follow-up actions: St Public Notif requested (MAY-12-2010), St Violation/Reminder Notice (MAY-12-2010), St Compliance achieved (JUL-22-2011), St Public Notif received (JUL-26-2011)
13 routine major monitoring violations
2 minor monitoring violations
2 regular monitoring violations
Drinking water stations with addresses in Hinesville that have no violations reported:
CEDAR BROOK MOBILE HOME PARK (Population served: 50, Primary Water Source Type: Groundwater)
Average household size: This city:
2.7 peopleGeorgia:
2.6 people
Percentage of family households: This city:
73.5%Whole state:
68.5%
Percentage of households with unmarried partners: This city:
4.9%Whole state:
5.9%
Likely homosexual households (counted as self-reported same-sex unmarried-partner households)
Lesbian couples: 0.4% of all households Gay men: 0.3% of all households
People in group quarters in Hinesville in 2010:
250 people in local jails and other municipal confinement facilities
37 people in military barracks and dormitories (nondisciplinary)
13 people in group homes for juveniles (non-correctional)
10 people in group homes intended for adults
people in homes for the mentally retarded in 2000people in other noninstitutional group quarters in 2000Banks with branches in Hinesville (2011 data):
The Heritage Bank: at 300 South Main Street, Oglethorpe Hwy Branch, Southside Branch. Info updated 2009/07/27: Bank assets: $865.2 mil, Deposits: $792.7 mil, local headquarters , negative income in the last year , Commercial Lending Specialization, 32 total offices , Holding Company: Liberty Shares, Inc.
First Citizens Bank: Liberty County Branch at 119 East General Screven Way, branch established on 1996/12/04. Info updated 2011/03/31: Bank assets: $99.0 mil, Deposits: $87.8 mil, headquarters in Glennville, GA, negative income in the last year , Commercial Lending Specialization, 3 total offices , Holding Company: Citizens Investors, Llc
The Coastal Bank: Hinesville Branch at 101 West Hendry Street, branch established on 1916/01/01. Info updated 2009/04/15: Bank assets: $448.7 mil, Deposits: $375.7 mil, headquarters in Savannah, GA, positive income , Commercial Lending Specialization, 7 total offices , Holding Company: Coastal Bankshares, Inc.
Bank of America, National Association: Fort Stewart Branch at 102 West General Screven Way, branch established on 2004/12/15. Info updated 2009/11/18: Bank assets: $1,451,969.3 mil, Deposits: $1,077,176.8 mil, headquarters in Charlotte, NC, positive income , 5782 total offices , Holding Company: Bank Of America Corporation
South Georgia Bank: Hinesville Branch at 737 South Main Street, branch established on 2010/01/11. Info updated 2009/10/26: Bank assets: $133.0 mil, Deposits: $116.6 mil, headquarters in Glennville, GA, positive income , Commercial Lending Specialization, 4 total offices , Holding Company: South Group Bancshares, Inc.
Wells Fargo Bank, National Association: Hinesville Branch at 159 W Hendry St, branch established on 1928/01/01. Info updated 2011/04/05: Bank assets: $1,161,490.0 mil, Deposits: $905,653.0 mil, headquarters in Sioux Falls, SD, positive income , 6395 total offices , Holding Company: Wells Fargo & Company
For population 15 years and over in Hinesville:
Never married: 28.4%Now married: 49.8%Separated: 4.3%Widowed: 3.3%Divorced: 14.3% For population 25 years and over in Hinesville:
High school or higher: 94.2%Bachelor's degree or higher: 21.4%Graduate or professional degree: 7.0%Unemployed: 8.8%Mean travel time to work (commute): 24.3 minutes
Education Gini index (Inequality in education) Here:
9.6Georgia average:
12.2
Religion statistics for Hinesville, GA (based on Liberty County data)
Religion Adherents Congregations Evangelical Protestant 11,631 43 Mainline Protestant 1,966 12 Catholic 1,259 1 Other 1,191 3 Black Protestant 1,179 13 None 46,227 -
Source: Clifford Grammich, Kirk Hadaway, Richard Houseal, Dale E.Jones, Alexei Krindatch, Richie Stanley and Richard H.Taylor. 2012. 2010 U.S.Religion Census: Religious Congregations & Membership Study. Association of Statisticians of American Religious Bodies. Jones, Dale E., et al. 2002. Congregations and Membership in the United States 2000. Nashville, TN: Glenmary Research Center. Graphs represent county-level data
Food Environment Statistics: Number of grocery stores : 7Liberty County :
1.16 / 10,000 pop.State :
1.91 / 10,000 pop.
Number of supercenters and club stores : 1Liberty County :
0.17 / 10,000 pop.Georgia :
0.15 / 10,000 pop.
Number of convenience stores (no gas) : 9Here :
1.49 / 10,000 pop.Georgia :
0.86 / 10,000 pop.
Number of convenience stores (with gas) : 35Liberty County :
5.79 / 10,000 pop.Georgia :
5.12 / 10,000 pop.
Number of full-service restaurants : 26Liberty County :
4.30 / 10,000 pop.Georgia :
7.41 / 10,000 pop.
Adult obesity rate : Liberty County :
29.6%Georgia :
27.8%
Low-income preschool obesity rate : Liberty County :
8.2%Georgia :
14.6%
Health and Nutrition: Healthy diet rate : Hinesville:
48.0%Georgia:
48.9%
Average overall health of teeth and gums : Hinesville:
48.2%Georgia:
46.5%
Average BMI : This city:
29.2Georgia:
28.9
People feeling badly about themselves : Hinesville:
19.3%State:
20.4%
People not drinking alcohol at all : This city:
11.6%Georgia:
10.8%
Average hours sleeping at night : Overweight people : This city:
33.3%Georgia:
33.5%
General health condition : This city:
57.6%State:
56.2%
Average condition of hearing : Hinesville:
84.5%State:
80.8%
More about Health and Nutrition of Hinesville, GA Residents
Local government employment and payroll (March 2022)
Function
Full-time employees
Monthly full-time payroll
Average yearly full-time wage
Part-time employees
Monthly part-time payroll
Police Protection - Officers
84 $379,402 $54,200 0 $0 Firefighters
48 $207,738 $51,935 0 $0 Other and Unallocable
19 $89,552 $56,559 0 $0 Police - Other
12 $39,567 $39,567 11 $26,120 Other Government Administration
10 $55,767 $66,920 14 $7,885 Housing and Community Development (Local)
7 $34,237 $58,692 0 $0 Correction
6 $26,401 $52,802 2 $4,615 Water Supply
6 $21,135 $42,270 0 $0 Financial Administration
4 $24,503 $73,509 0 $0 Fire - Other
2 $14,344 $86,064 0 $0
Totals for Government
198 $892,647 $54,100 27 $38,620
Hinesville government finances - Expenditure in 2021 (per resident):
Construction - Regular Highways: $506,000 ($14.28)
Local Fire Protection: $261,000 ($7.36)General - Other: $251,000 ($7.08)Housing and Community Development: $12,000 ($0.34)Parks and Recreation: $12,000 ($0.34)Central Staff Services: $2,000 ($0.06)Current Operations - Police Protection: $6,921,000 ($195.28)
Sewerage: $6,733,000 ($189.98)General - Other: $4,592,000 ($129.57)Local Fire Protection: $3,494,000 ($98.59)Solid Waste Management: $3,253,000 ($91.79)Water Utilities: $3,202,000 ($90.35)Central Staff Services: $1,931,000 ($54.48)Regular Highways: $1,475,000 ($41.62)Housing and Community Development: $751,000 ($21.19)Protective Inspection and Regulation - Other: $737,000 ($20.80)Financial Administration: $688,000 ($19.41)Parks and Recreation: $483,000 ($13.63)Public Welfare - Other: $476,000 ($13.43)Libraries: $351,000 ($9.90)Judicial and Legal Services: $332,000 ($9.37)General Public Buildings: $112,000 ($3.16)General - Interest on Debt: $1,259,000 ($35.52)
Intergovernmental to Local - Other - Libraries: $351,000 ($9.90)
Other - General - Other: $333,000 ($9.40)Other Capital Outlay - Police Protection: $267,000 ($7.53)
Financial Administration: $136,000 ($3.84)Local Fire Protection: $109,000 ($3.08)Protective Inspection and Regulation - Other: $75,000 ($2.12)General - Other: $19,000 ($0.54)Central Staff Services: $5,000 ($0.14)Judicial and Legal Services: $4,000 ($0.11)Public Welfare - Other: $3,000 ($0.08)Total Salaries and Wages: $133,000 ($3.75)
Water Utilities - Interest on Debt: $487,000 ($13.74)
Hinesville government finances - Revenue in 2021 (per resident):
Charges - Sewerage: $10,164,000 ($286.79)
Solid Waste Management: $3,272,000 ($92.32)Other: $1,624,000 ($45.82)Regular Highways: $870,000 ($24.55)Federal Intergovernmental - Public Welfare: $172,000 ($4.85)
Housing and Community Development: $162,000 ($4.57)Other: $32,000 ($0.90)Local Intergovernmental - General Local Government Support: $4,937,000 ($139.30)
Other: $3,162,000 ($89.22)Miscellaneous - Fines and Forfeits: $1,101,000 ($31.07)
General Revenue - Other: $210,000 ($5.93)Interest Earnings: $86,000 ($2.43)Revenue - Water Utilities: $2,437,000 ($68.76)
Transit Utilities: $887,000 ($25.03)State Intergovernmental - Other: $2,224,000 ($62.75)
Housing and Community Development: $310,000 ($8.75)Public Welfare: $243,000 ($6.86)General Local Government Support: $37,000 ($1.04)Tax - Property: $7,634,000 ($215.40)
Insurance Premiums Sales: $2,678,000 ($75.56)Public Utilities Sales: $1,726,000 ($48.70)Alcoholic Beverage Sales: $452,000 ($12.75)Other License: $312,000 ($8.80)Occupation and Business License - Other: $190,000 ($5.36)Other Selective Sales: $145,000 ($4.09)Alcoholic Beverage License: $136,000 ($3.84)Other: $34,000 ($0.96)
Hinesville government finances - Debt in 2021 (per resident):
Long Term Debt - Beginning Outstanding - Unspecified Public Purpose: $43,676,000 ($1232.36)
Outstanding Unspecified Public Purpose: $42,254,000 ($1192.23)Retired Unspecified Public Purpose: $1,760,000 ($49.66)Issue, Unspecified Public Purpose: $338,000 ($9.54)
Hinesville government finances - Cash and Securities in 2021 (per resident):
Other Funds - Cash and Securities: $28,729,000 ($810.61)
18.85% of this county's 2021 resident taxpayers lived in other counties in 2020 ($39,623 average adjusted gross income )
Here:
18.85%Georgia average:
10.21%
0.70% of residents moved from foreign countries ($1,893 average AGI )Liberty County:
0.70%Georgia average:
0.04%
Top counties from which taxpayers relocated into this county between 2020 and 2021:
18.69% of this county's 2020 resident taxpayers moved to other counties in 2021 ($41,478 average adjusted gross income )
Here:
18.69%Georgia average:
9.60%
0.52% of residents moved to foreign countries ($1,287 average AGI )Liberty County:
0.52%Georgia average:
0.03%
Top counties to which taxpayers relocated from this county between 2020 and 2021:
Businesses in Hinesville, GA
Name Count Name Count
AT&T 2 Knights Inn 1 Ace Hardware 1 Kroger 1 Advance Auto Parts 1 La Quinta 1 Applebee's 1 Little Caesars Pizza 1 Arby's 1 Lowe's 1 AutoZone 1 Marriott 1 Baskin-Robbins 1 McDonald's 3 Bath & Body Works 1 Nike 4 Best Western 1 Papa John's Pizza 1 Blockbuster 1 Payless 1 Burger King 1 Penske 1 CVS 1 Pizza Hut 2 Chevrolet 1 Popeyes 1 Church's Chicken 1 Quality 1 Comfort Suites 1 Quiznos 1 Cricket Wireless 2 RadioShack 1 Curves 1 Ruby Tuesday 1 Dairy Queen 1 SONIC Drive-In 1 Domino's Pizza 1 Sears 1 Econo Lodge 1 Sprint Nextel 1 FedEx 1 Starbucks 1 Ford 1 Subway 5 GNC 1 T-Mobile 2 GameStop 1 Taco Bell 1 Goodwill 1 U-Haul 7 H&R Block 3 UPS 5 Hardee's 1 Waffle House 1 Hilton 1 Walmart 1 Holiday Inn 1 YMCA 2 KFC 1
Strongest AM radio stations in Hinesville:
WGML (990 AM; 0 kW; HINESVILLE, GA; Owner: POWERHOUSE OF DELIVERANCE CHURCH, INC.)
WLOP (1370 AM; 5 kW; JESUP, GA; Owner: JESUP BROADCASTING CORP.)
WOKV (690 AM; 50 kW; JACKSONVILLE, FL; Owner: COX RADIO, INC.)
WBMQ (630 AM; 5 kW; SAVANNAH, GA; Owner: CUMULUS LICENSING CORP.)
WTKS (1290 AM; 5 kW; SAVANNAH, GA; Owner: CAPSTAR TX LIMITED PARTNERSHIP)
WJLG (900 AM; 4 kW; SAVANNAH, GA; Owner: CUMULUS LICENSING CORP.)
WFVR (910 AM; 50 kW; VALDOSTA, GA; Owner: RAMA COMMUNICATIONS, INC.)
WOBS (1530 AM; daytime; 50 kW; JACKSONVILLE, FL; Owner: WORD BROADCASTING NETWORK, INC.)
WCGA (1100 AM; daytime; 10 kW; WOODBINE, GA; Owner: COX BROADCAST GROUP, INC.)
WMAC (940 AM; 50 kW; MACON, GA; Owner: CUMULUS LICENSING CORP.)
WGSR (1570 AM; 50 kW; FERNANDINA BEACH, FL; Owner: RJM COMMUNICATIONS, INC)
WBAJ (890 AM; daytime; 50 kW; BLYTHEWOOD, SC; Owner: FAMILY FIRST)
WCEO (840 AM; daytime; 50 kW; COLUMBIA, SC; Owner: EASTERN BROADCASTING GROUP, INC.)
Strongest FM radio stations in Hinesville:
WSGA (104.7 FM; HINESVILLE, GA; Owner: BULLIE BROADCASTING CORPORATION)
WZAT (102.1 FM; SAVANNAH, GA; Owner: CUMULUS LICENSING CORP.)
WQBT (94.1 FM; SAVANNAH, GA; Owner: CAPSTAR TX LIMITED PARTNERSHIP)
WAEV (97.3 FM; SAVANNAH, GA; Owner: CAPSTAR TX LIMITED PARTNERSHIP)
WJCL-FM (96.5 FM; SAVANNAH, GA; Owner: CUMULUS LICENSING CORP.)
WIXV (95.5 FM; SAVANNAH, GA; Owner: CUMULUS LICENSING CORP.)
WGCO (98.3 FM; MIDWAY, GA; Owner: MONTEREY LICENSES, LLC)
WEAS-FM (93.1 FM; SAVANNAH, GA; Owner: CUMULUS LICENSING CORP.)
WLPT (88.3 FM; JESUP, GA; Owner: AUGUSTA RADIO FELLOWSHIP INSTITUTE, INC.)
WSVH (91.1 FM; SAVANNAH, GA; Owner: GEORGIA PUBLIC TELECOMMUNICATIONS COMMISSION)
WSKX (92.3 FM; HINESVILLE, GA; Owner: COMMUNICATIONS CAPITAL COMPANY II OF GEORGIA, LLC)
WYFS (89.5 FM; SAVANNAH, GA; Owner: BIBLE BROADCASTING NETWORK, INC.)
WRHQ (105.3 FM; RICHMOND HILL, GA; Owner: THOROUGHBRED COMMUNICATIONS, INC.)
WWSN (103.3 FM; WAYCROSS, GA; Owner: QANTUM OF BRUNSWICK LICENSE COMPANY, LLC)
WCGN (106.3 FM; GLENNVILLE, GA; Owner: BULLIE BROADCASTING CORPORATION)
WLVH (101.1 FM; HARDEEVILLE, SC; Owner: CAPSTAR TX LIMITED PARTNERSHIP)
WMCD (100.1 FM; STATESBORO, GA; Owner: RADIO STATESBORO, INC.)
WIFO-FM (105.5 FM; JESUP, GA; Owner: JESUP BROADCASTING CORP.)
TV broadcast stations around Hinesville:
WTOC-TV (Channel 11; SAVANNAH, GA; Owner: RAYCOM AMERICA, INC.)
WGSA (Channel 34; BAXLEY, GA; Owner: SOUTHERN TV CORPORATION)
WSAV-TV (Channel 3; SAVANNAH, GA; Owner: MEDIA GENERAL COMMUNICATIONS, INC.)
WTGS (Channel 28; HARDEEVILLE, SC; Owner: BLUENOSE BROADCASTING OF SAVANNAH LLC)
WJCL (Channel 22; SAVANNAH, GA; Owner: PIEDMONT TELEVISION OF SAVANNAH LICENSE LLC)
WVAN-TV (Channel 9; SAVANNAH, GA; Owner: GEORGIA PUBLIC TELECOMMUNICATIONS COMMISSION)
W39BV (Channel 39; HINESVILLE-RICHMOND, GA; Owner: SOUTHERN TV CORPORATION)
WGSA-CA (Channel 50; SAVANNAH, GA; Owner: SOUTHERN TV CORPORATION)
WPXC-TV (Channel 21; BRUNSWICK, GA; Owner: PAXSON JAX LICENSE, INC.)
WHDS-LP (Channel 32; SAVANNAH, GA; Owner: BROADCAST CORP. OF AMERICA)
WXSX-LP (Channel 13; SAVANNAH, GA; Owner: THE BOX WORLDWIDE LLC)
National Bridge Inventory (NBI) Statistics 4 Number of bridges16ft / 5.2m Total length $1,127,000 Total costs32,350 Total average daily traffic554 Total average daily truck traffic48,525 Total future (year 2032) average daily traffic
FCC Registered Cell Phone Towers: 2 (
See the full list of FCC Registered Cell Phone Towers in Hinesville )
FCC Registered Antenna Towers: 223 (
See the full list of FCC Registered Antenna Towers )
FCC Registered Private Land Mobile Towers: 5 (
See the full list of FCC Registered Private Land Mobile Towers in Hinesville, GA )
FCC Registered Broadcast Land Mobile Towers: 12 (
See the full list of FCC Registered Broadcast Land Mobile Towers )
FCC Registered Microwave Towers: 19 (
See the full list of FCC Registered Microwave Towers in this town )
FCC Registered Paging Towers: 3 (
See the full list of FCC Registered Paging Towers )
FCC Registered Amateur Radio Licenses: 115 (
See the full list of FCC Registered Amateur Radio Licenses in Hinesville )
FAA Registered Aircraft: 4
Aircraft: SLIGAR JOHN B RANS S14 (Category: Land, Seats: 2, Weight: Up to 12,499 Pounds), Engine: ROTAX 503 DCDI (52 HP) (2 Cycle)N-Number: 237JB, N237JB, N-237JB, Serial Number: JS01-9865, Year manufactured: 1996, Airworthiness Date: 03/26/2007, Certificate Issue Date: 08/23/2019Registrant (Individual): Sean M Heath, 3422 John Wells Rd, Hinesville, GA 31313Aircraft: MOONEY M20J (Category: Land, Seats: 4, Weight: Up to 12,499 Pounds, Speed: 126 mph), Engine: LYCOMING I0360 SER A&C (200 HP) (Reciprocating)N-Number: 611PS, N611PS, N-611PS, Serial Number: 24-1278, Year manufactured: 1982, Airworthiness Date: 02/27/1982, Certificate Issue Date: 08/03/1987Registrant (Corporation): P C Simonton And Associates Inc, Po Box 649, Hinesville, GA 31310Aircraft: CESSNA 150F (Category: Land, Seats: 2, Weight: Up to 12,499 Pounds, Speed: 90 mph), Engine: CONT MOTOR 0-200 SERIES (100 HP) (Reciprocating)N-Number: 7794F, N7794F, N-7794F, Serial Number: 15063894, Year manufactured: 1966, Airworthiness Date: 05/07/1966, Certificate Issue Date: 02/08/2006Registrant (Individual): Charles L Martin, 397 Saint Johns Rd, Hinesville, GA 31313Aircraft: BEECH V35B (Category: Land, Seats: 6, Weight: Up to 12,499 Pounds, Speed: 150 mph), Engine: CONT MOTOR IO 520 SERIES (285 HP) (Reciprocating)N-Number: 7PK, N7PK, N-7PK, Serial Number: D-9608, Year manufactured: 1974, Airworthiness Date: 03/20/1974, Certificate Issue Date: 04/06/1974Registrant (Corporation): Paul Krebs Constr Co, 1618 Airport Rd, Hinesville, GA 31313
Home Mortgage Disclosure Act Aggregated Statistics For Year 2009(Based on 1 full and 2 partial tracts) A) FHA, FSA/RHS & VA B) Conventional C) Refinancings D) Home Improvement Loans E) Loans on Dwellings For 5+ Families F) Non-occupant Loans on G) Loans On Manufactured Number Average Value Number Average Value Number Average Value Number Average Value Number Average Value Number Average Value Number Average Value
LOANS ORIGINATED 193 $138,003 34 $83,899 410 $138,750 24 $22,505 3 $507,287 112 $150,476 8 $377,974 APPLICATIONS APPROVED, NOT ACCEPTED 0 $0 3 $72,843 27 $135,964 3 $43,177 0 $0 3 $55,773 0 $0 APPLICATIONS DENIED 31 $128,085 10 $94,954 184 $114,847 28 $32,719 0 $0 29 $82,776 4 $86,330 APPLICATIONS WITHDRAWN 26 $140,753 2 $110,660 108 $124,769 12 $54,637 0 $0 11 $84,426 1 $92,960 FILES CLOSED FOR INCOMPLETENESS 8 $148,768 1 $37,810 35 $140,681 1 $19,700 0 $0 3 $47,837 0 $0
Aggregated Statistics For Year 2008(Based on 1 full and 2 partial tracts) A) FHA, FSA/RHS & VA B) Conventional C) Refinancings D) Home Improvement Loans E) Loans on Dwellings For 5+ Families F) Non-occupant Loans on G) Loans On Manufactured Number Average Value Number Average Value Number Average Value Number Average Value Number Average Value Number Average Value Number Average Value
LOANS ORIGINATED 248 $129,051 103 $123,164 243 $115,424 45 $45,422 5 $320,044 116 $106,507 9 $106,198 APPLICATIONS APPROVED, NOT ACCEPTED 11 $141,909 16 $86,258 38 $100,677 7 $39,416 0 $0 13 $54,138 1 $27,570 APPLICATIONS DENIED 17 $110,149 51 $108,500 251 $110,253 58 $51,750 1 $368,000 57 $68,313 6 $60,452 APPLICATIONS WITHDRAWN 18 $106,538 26 $104,567 84 $117,159 15 $47,303 0 $0 20 $66,142 1 $18,000 FILES CLOSED FOR INCOMPLETENESS 3 $81,793 10 $150,378 27 $131,722 6 $34,240 0 $0 3 $62,360 0 $0
Aggregated Statistics For Year 2007(Based on 1 full and 2 partial tracts) A) FHA, FSA/RHS & VA B) Conventional C) Refinancings D) Home Improvement Loans E) Loans on Dwellings For 5+ Families F) Non-occupant Loans on G) Loans On Manufactured Number Average Value Number Average Value Number Average Value Number Average Value Number Average Value Number Average Value Number Average Value
LOANS ORIGINATED 212 $132,002 169 $92,153 279 $132,395 59 $34,517 6 $798,102 131 $89,632 13 $87,537 APPLICATIONS APPROVED, NOT ACCEPTED 5 $121,702 17 $120,269 50 $81,781 8 $22,720 0 $0 12 $110,525 1 $20,480 APPLICATIONS DENIED 14 $100,427 52 $107,920 325 $101,843 92 $47,499 0 $0 46 $69,205 7 $45,973 APPLICATIONS WITHDRAWN 25 $118,013 32 $95,486 151 $102,566 33 $74,779 0 $0 22 $77,382 0 $0 FILES CLOSED FOR INCOMPLETENESS 17 $139,998 9 $91,163 27 $93,987 1 $75,410 0 $0 4 $68,255 0 $0
Aggregated Statistics For Year 2006(Based on 1 full and 2 partial tracts) A) FHA, FSA/RHS & VA B) Conventional C) Refinancings D) Home Improvement Loans E) Loans on Dwellings For 5+ Families F) Non-occupant Loans on G) Loans On Manufactured Number Average Value Number Average Value Number Average Value Number Average Value Number Average Value Number Average Value Number Average Value
LOANS ORIGINATED 362 $114,225 270 $76,438 303 $84,020 71 $29,902 5 $1,148,242 172 $62,468 16 $52,112 APPLICATIONS APPROVED, NOT ACCEPTED 15 $110,322 33 $79,185 49 $95,003 14 $24,144 0 $0 23 $66,202 2 $61,720 APPLICATIONS DENIED 12 $103,257 82 $73,269 330 $92,874 120 $32,642 0 $0 54 $58,754 6 $51,855 APPLICATIONS WITHDRAWN 29 $118,988 51 $91,830 201 $96,182 20 $54,328 0 $0 27 $76,767 1 $31,510 FILES CLOSED FOR INCOMPLETENESS 3 $137,450 15 $59,443 68 $104,082 4 $54,238 0 $0 8 $72,362 0 $0
Aggregated Statistics For Year 2005(Based on 1 full and 2 partial tracts) A) FHA, FSA/RHS & VA B) Conventional C) Refinancings D) Home Improvement Loans E) Loans on Dwellings For 5+ Families F) Non-occupant Loans on G) Loans On Manufactured Number Average Value Number Average Value Number Average Value Number Average Value Number Average Value Number Average Value Number Average Value
LOANS ORIGINATED 233 $107,123 251 $75,783 287 $75,738 73 $33,453 6 $313,890 178 $59,835 8 $75,466 APPLICATIONS APPROVED, NOT ACCEPTED 12 $96,942 33 $70,429 46 $74,666 9 $41,689 0 $0 24 $58,423 2 $36,510 APPLICATIONS DENIED 12 $97,003 65 $78,973 340 $80,777 97 $35,432 0 $0 45 $65,406 7 $49,829 APPLICATIONS WITHDRAWN 24 $103,030 42 $83,459 170 $90,326 37 $71,109 0 $0 19 $87,757 4 $129,588 FILES CLOSED FOR INCOMPLETENESS 1 $148,000 17 $70,522 93 $102,022 2 $89,195 0 $0 14 $84,893 0 $0
Aggregated Statistics For Year 2004(Based on 1 full and 2 partial tracts) A) FHA, FSA/RHS & VA B) Conventional C) Refinancings D) Home Improvement Loans E) Loans on Dwellings For 5+ Families F) Non-occupant Loans on G) Loans On Manufactured Number Average Value Number Average Value Number Average Value Number Average Value Number Average Value Number Average Value Number Average Value
LOANS ORIGINATED 404 $96,652 210 $74,414 386 $83,102 36 $12,961 3 $108,827 171 $67,283 13 $151,457 APPLICATIONS APPROVED, NOT ACCEPTED 11 $87,054 31 $66,660 76 $82,695 2 $21,815 0 $0 19 $65,469 11 $59,950 APPLICATIONS DENIED 27 $89,444 66 $71,756 313 $74,823 63 $29,735 0 $0 51 $61,419 20 $48,456 APPLICATIONS WITHDRAWN 70 $96,693 41 $74,219 215 $84,852 9 $66,139 0 $0 34 $66,991 1 $60,000 FILES CLOSED FOR INCOMPLETENESS 21 $92,538 10 $105,557 69 $90,221 5 $45,632 0 $0 11 $62,808 1 $33,090
Detailed HMDA statistics for the following Tracts:
0102.02
, 0102.03 , 0103.00
Private Mortgage Insurance Companies Aggregated Statistics For Year 2009(Based on 1 full and 2 partial tracts) A) Conventional B) Refinancings Number Average Value Number Average Value
LOANS ORIGINATED 4 $131,742 2 $105,600 APPLICATIONS APPROVED, NOT ACCEPTED 1 $131,560 4 $167,052 APPLICATIONS DENIED 0 $0 1 $126,900 APPLICATIONS WITHDRAWN 0 $0 0 $0 FILES CLOSED FOR INCOMPLETENESS 1 $124,000 0 $0
Aggregated Statistics For Year 2008(Based on 1 full and 2 partial tracts) A) Conventional B) Refinancings C) Non-occupant Loans on Number Average Value Number Average Value Number Average Value
LOANS ORIGINATED 37 $111,071 14 $167,319 13 $75,986 APPLICATIONS APPROVED, NOT ACCEPTED 15 $112,956 4 $127,785 3 $95,560 APPLICATIONS DENIED 5 $71,396 0 $0 4 $62,065 APPLICATIONS WITHDRAWN 0 $0 0 $0 0 $0 FILES CLOSED FOR INCOMPLETENESS 1 $108,720 2 $97,115 2 $97,115
Aggregated Statistics For Year 2007(Based on 1 full and 2 partial tracts) A) Conventional B) Refinancings C) Non-occupant Loans on D) Loans On Manufactured Number Average Value Number Average Value Number Average Value Number Average Value
LOANS ORIGINATED 72 $112,342 29 $120,088 17 $104,229 1 $93,750 APPLICATIONS APPROVED, NOT ACCEPTED 7 $107,701 7 $76,836 2 $62,450 0 $0 APPLICATIONS DENIED 1 $58,850 0 $0 0 $0 0 $0 APPLICATIONS WITHDRAWN 2 $106,355 2 $88,255 1 $93,000 0 $0 FILES CLOSED FOR INCOMPLETENESS 1 $101,630 0 $0 0 $0 0 $0
Aggregated Statistics For Year 2006(Based on 1 full and 2 partial tracts) A) Conventional B) Refinancings C) Non-occupant Loans on Number Average Value Number Average Value Number Average Value
LOANS ORIGINATED 56 $83,365 24 $109,181 26 $60,692 APPLICATIONS APPROVED, NOT ACCEPTED 8 $87,644 10 $95,952 4 $83,858 APPLICATIONS DENIED 0 $0 1 $49,660 0 $0 APPLICATIONS WITHDRAWN 3 $152,100 1 $66,960 0 $0 FILES CLOSED FOR INCOMPLETENESS 0 $0 0 $0 0 $0
Aggregated Statistics For Year 2005(Based on 1 full and 2 partial tracts) A) Conventional B) Refinancings C) Non-occupant Loans on Number Average Value Number Average Value Number Average Value
LOANS ORIGINATED 64 $83,293 24 $89,853 36 $63,447 APPLICATIONS APPROVED, NOT ACCEPTED 15 $83,091 10 $89,644 7 $72,691 APPLICATIONS DENIED 0 $0 0 $0 0 $0 APPLICATIONS WITHDRAWN 6 $95,968 2 $63,110 5 $72,108 FILES CLOSED FOR INCOMPLETENESS 1 $37,810 0 $0 0 $0
Aggregated Statistics For Year 2004(Based on 1 full and 2 partial tracts) A) Conventional B) Refinancings C) Non-occupant Loans on Number Average Value Number Average Value Number Average Value
LOANS ORIGINATED 61 $82,415 27 $93,426 23 $51,640 APPLICATIONS APPROVED, NOT ACCEPTED 12 $71,159 9 $81,979 10 $62,329 APPLICATIONS DENIED 2 $40,515 2 $75,235 2 $40,515 APPLICATIONS WITHDRAWN 6 $94,617 3 $114,530 4 $64,205 FILES CLOSED FOR INCOMPLETENESS 0 $0 0 $0 0 $0
Detailed PMIC statistics for the following Tracts:
0102.02
, 0102.03 , 0103.00 Fire-safe hotels and motels in Hinesville, Georgia:
Econolodge, 726 Oglethorpe Hwy, Hinesville, Georgia 31313 Phone: (912) 368-2275, Fax: (912) 368-5894
Days Inn, 1024 E Oglethorpe Hwy, Hinesville, Georgia 31313 Phone: (912) 332-7461, Fax: (912) 463-4142
Comfort Suites, 70 Wallace Martin Dr, Hinesville, Georgia 31313 Phone: (912) 877-3000, Fax: (912) 877-3333
Baymont Inn & Suites, 773 Veterans Pkwy, Hinesville, Georgia 31313 Phone: (912) 408-4444, Fax: (912) 368-4944
Country Inn & Suites, 742 General Stewart Way, Hinesville, Georgia 31313 Phone: (912) 877-7777, Fax: (912) 877-6767
Americas Best Value Inn, 706 E Oglethorpe Hwy, Hinesville, Georgia 31313 Phone: (912) 876-4466, Fax: (912) 876-4469
Holiday Inn Express Hotel & Suites, 1388 E Oglethorpe Hwy, Hinesville, Georgia 31313 Phone: (912) 877-5611, Fax: (912) 877-2410
Hampton Inn, 1148 E Oglehtorpe Hwy, Hinesville, Georgia 31313 Phone: (912) 877-4090, Fax: (912) 877-4190
6 other hotels and motels
All 14 fire-safe hotels and motels in Hinesville, Georgia
Most common first names in Hinesville, GA among deceased individuals Name Count Lived (average)
James 61 67.9 years John 60 68.0 years Mary 53 73.4 years William 50 71.1 years Robert 33 69.4 years Charles 32 64.3 years Willie 24 67.6 years Thomas 23 67.5 years George 20 70.6 years Margaret 18 71.2 years
Most common last names in Hinesville, GA among deceased individuals Last name Count Lived (average)
Smith 34 67.5 years Martin 28 76.1 years Williams 24 69.6 years Johnson 23 65.8 years Wells 23 70.9 years Brown 22 74.3 years Jones 21 61.1 years Davis 18 70.5 years Wilson 17 68.0 years Bacon 17 65.7 years
Hinesville compared to Georgia state average:
Median house value below state average. Unemployed percentage below state average. Black race population percentage above state average. Median age significantly below state average. Length of stay since moving in significantly above state average. Hinesville on our top lists :
#82 on the list of "Top 101 cities with largest percentage of males in industries: public administration (population 5,000+)"
#3 on the list of "Top 101 counties with the highest percentage of residents relocating from foreign countries between 2010 and 2011"
#4 on the list of "Top 101 counties with the highest percentage of residents relocating from other counties between 2010 and 2011"
#11 on the list of "Top 101 counties with the highest percentage of residents relocating to other counties in 2011"
#11 on the list of "Top 101 counties with the highest percentage of residents relocating to foreign countries in 2011"
#21 on the list of "Top 101 counties with the lowest number of deaths per 1000 residents 2007-2013 (pop. 50,000+)"
Top Patent Applicants
Jihad Cabey (1)
Annette Puckerin (1)
Heine F. Nzumafo (1)
Colin Peters (1)
Linda Gale Brown (1)
Total of 5 patent applications in 2008-2024.
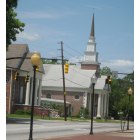
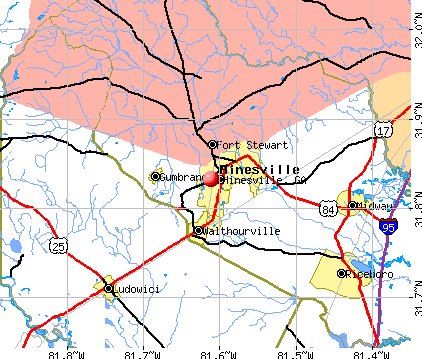


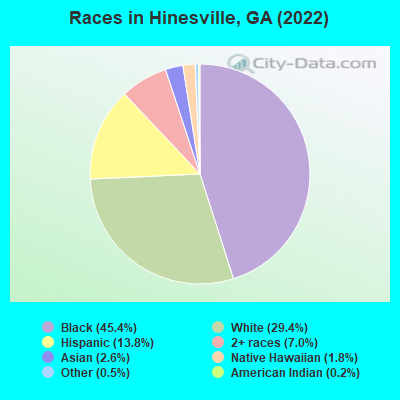
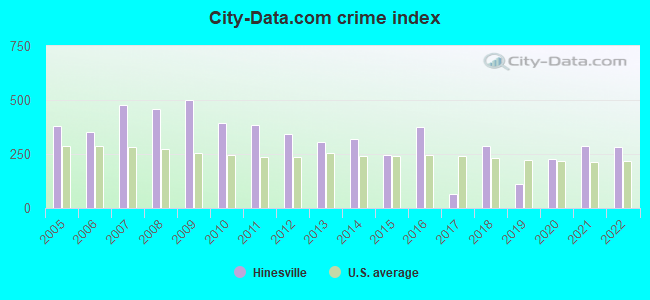
 Recent articles from our blog. Our writers, many of them Ph.D. graduates or candidates, create easy-to-read articles on a wide variety of topics.

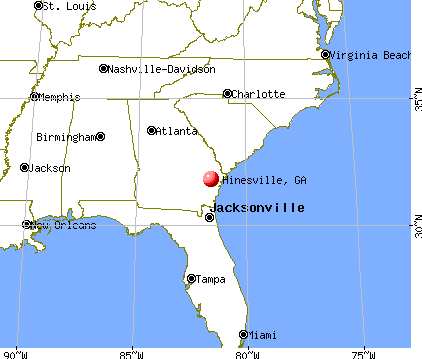
 (33.4 miles
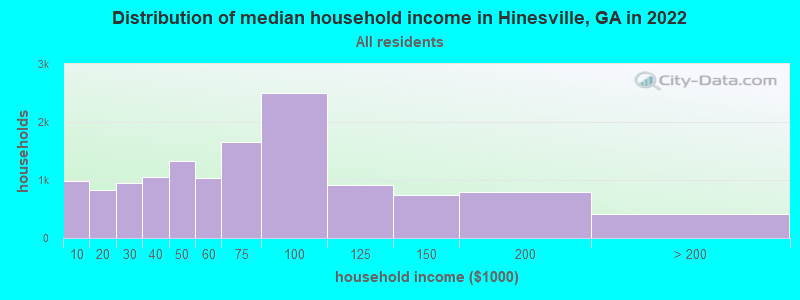
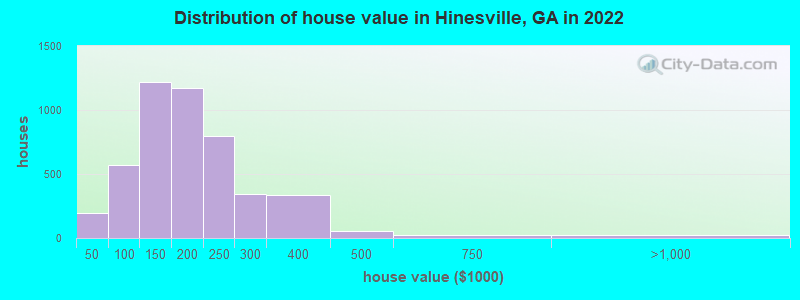

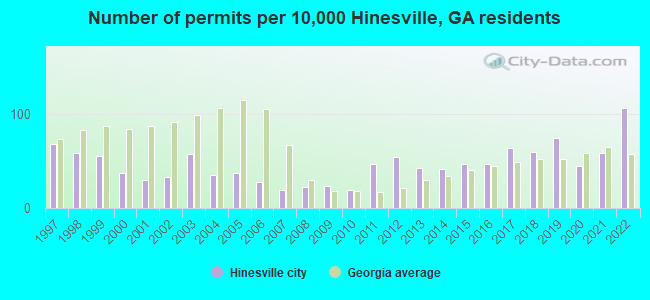
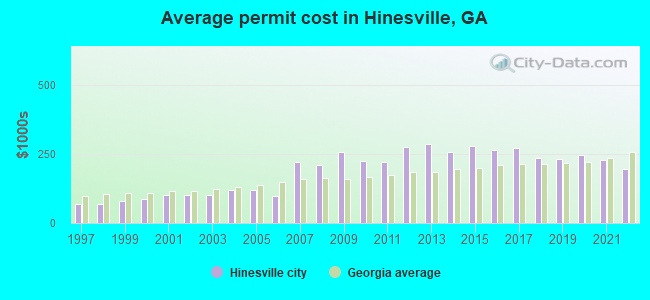
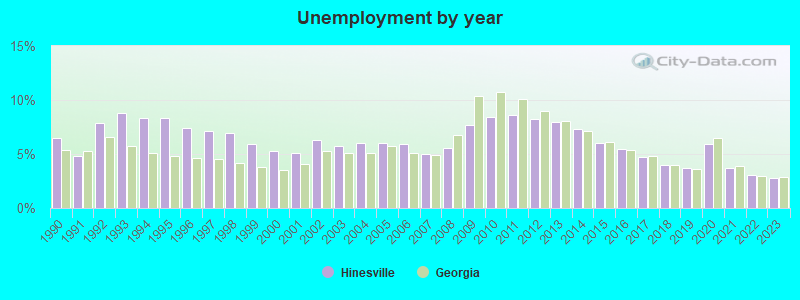
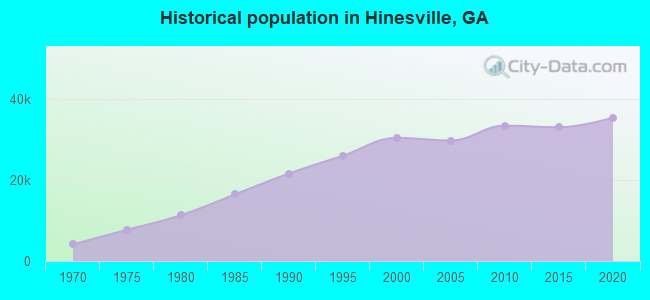
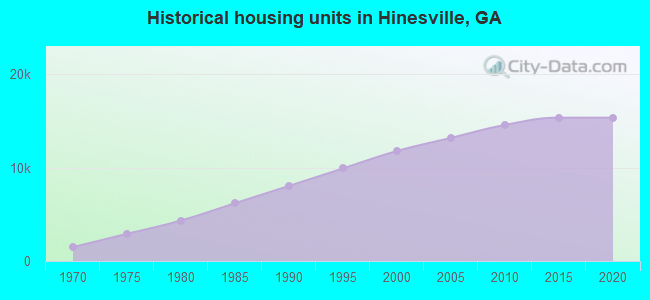

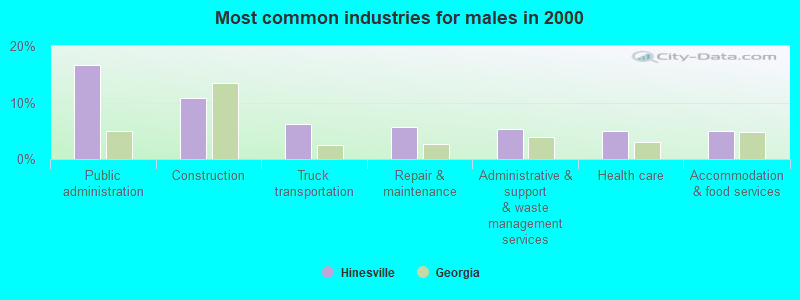
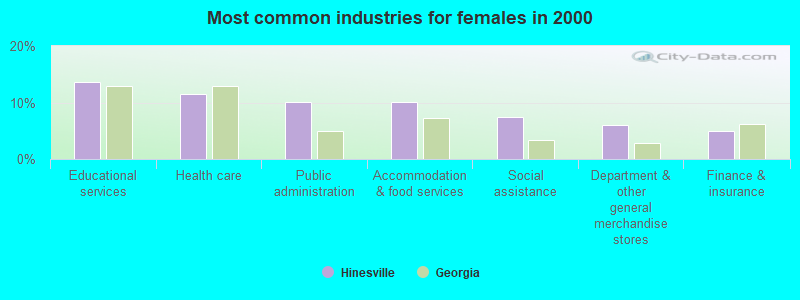
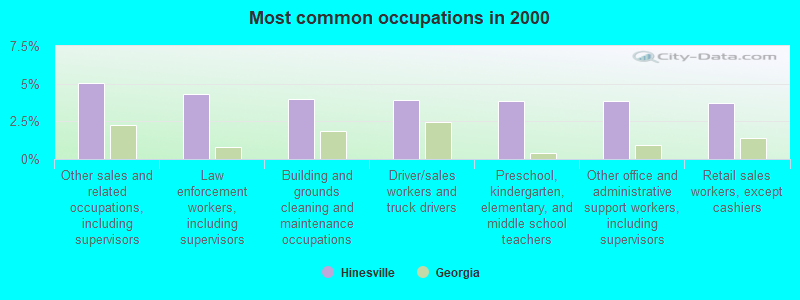
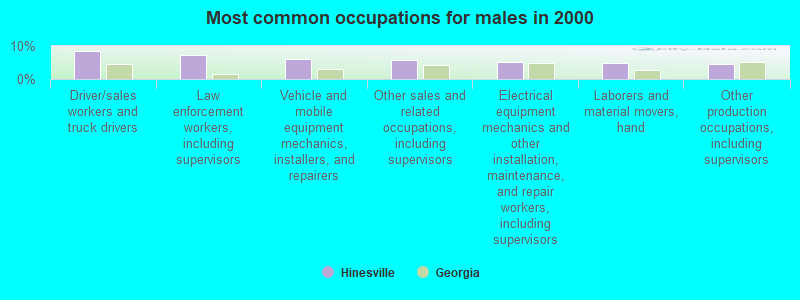
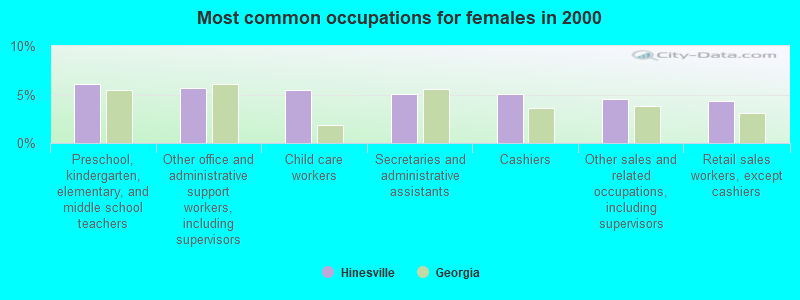


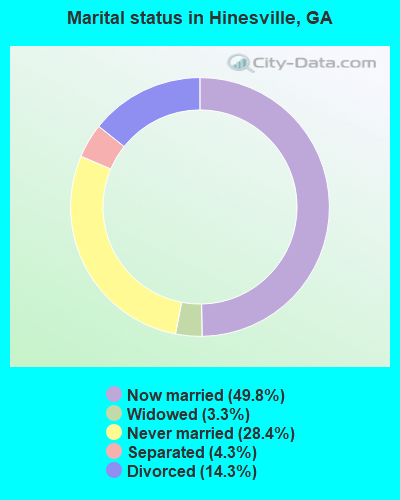
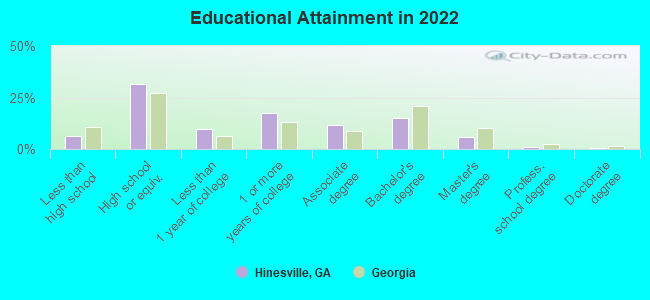
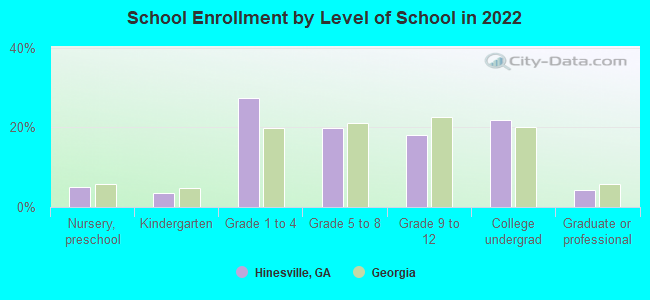
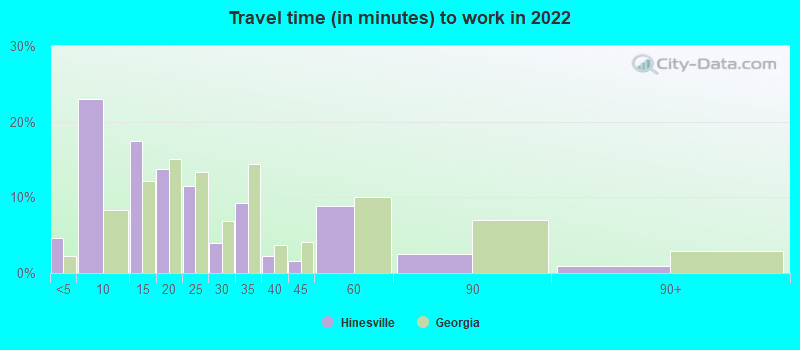
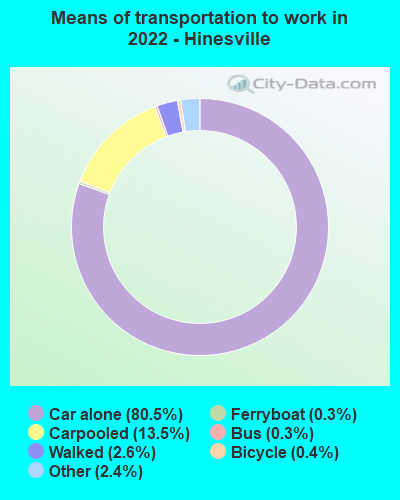
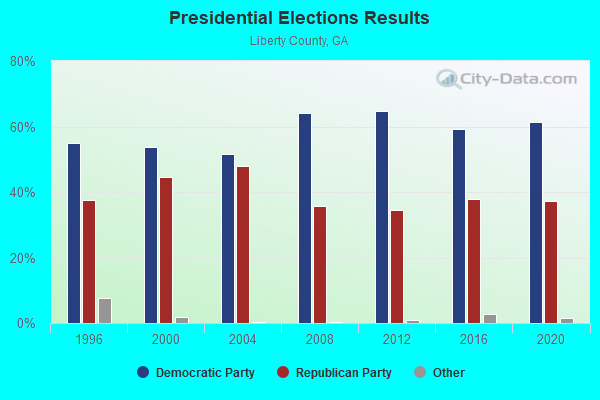
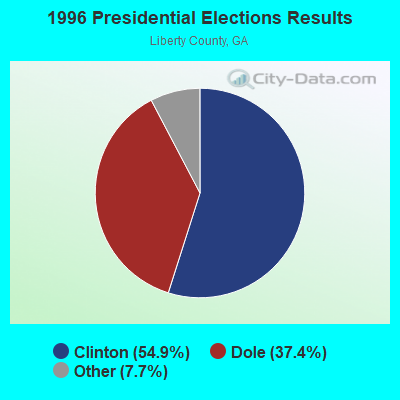
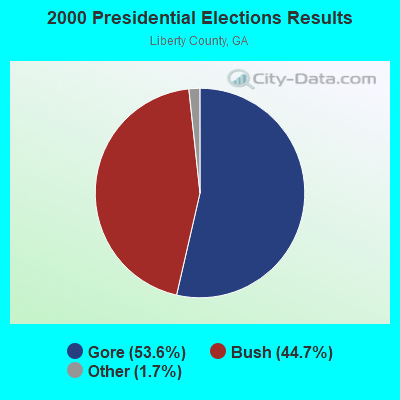
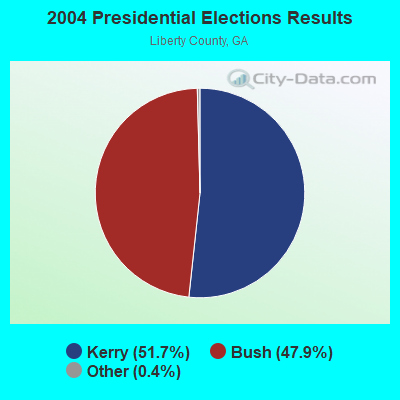
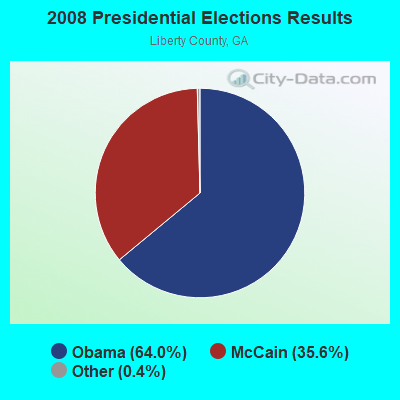
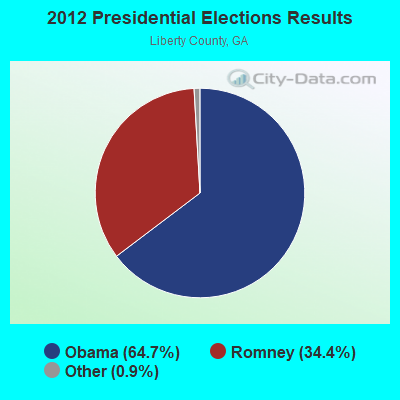
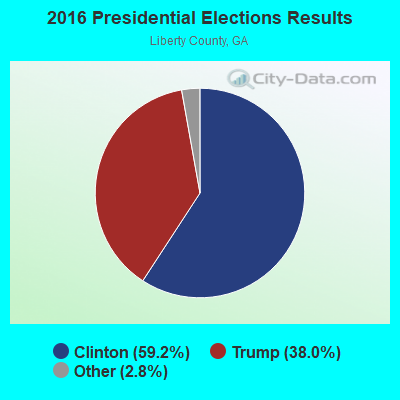
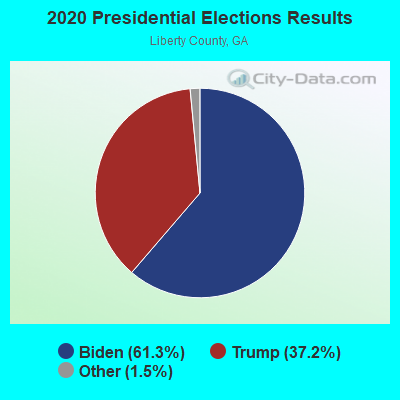
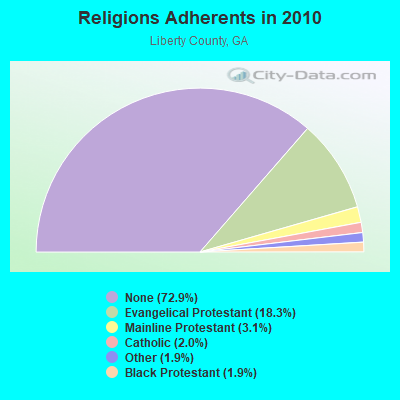
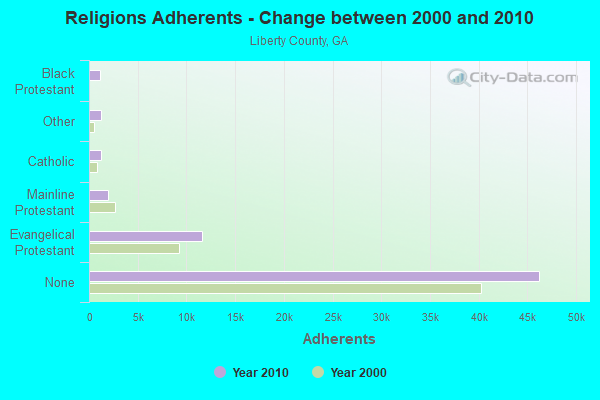
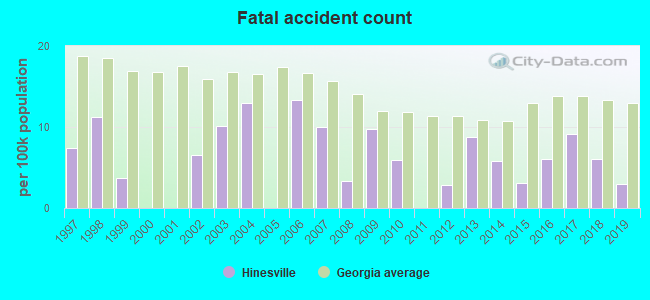
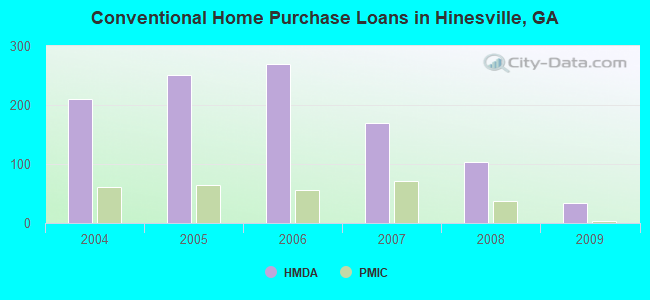
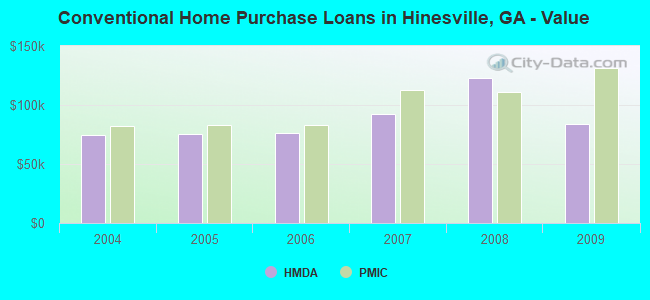
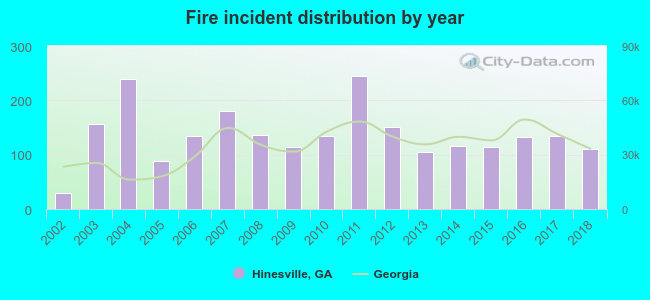 Based on the data from the years 2002 - 2018 the average number of fire incidents per year is 136. The highest number of fires - 244 took place in 2011, and the least - 30 in 2002. The data has a rising trend.
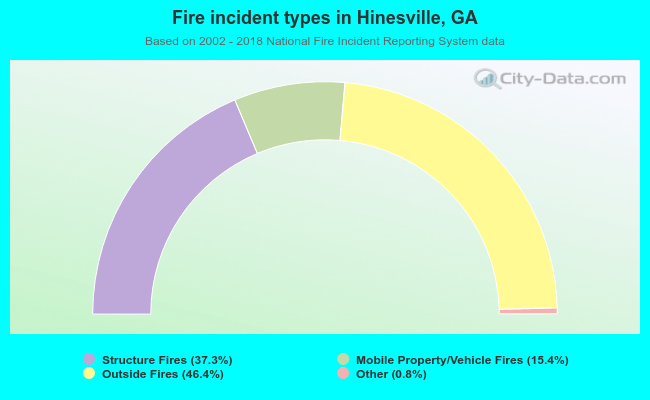 When looking into fire subcategories, the most incidents belonged to: Outside Fires (46.4%), and Structure Fires (37.3%).