Hazel Park, Michigan
Submit your own pictures of this city and show them to the world
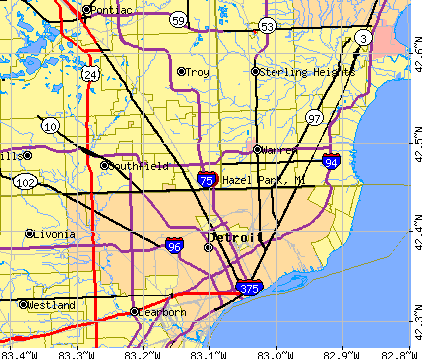
- OSM Map
- General Map
- Google Map
- MSN Map
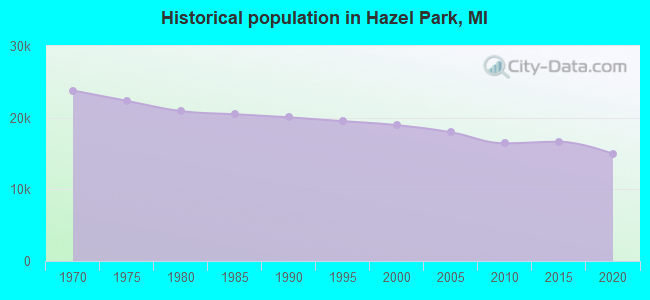
Population change since 2000: -21.8%
 |
| Males: 7,492 | |
| Females: 7,346 |
| Median resident age: | 37.7 years |
| Michigan median age: | 40.3 years |
Zip codes: 48030.
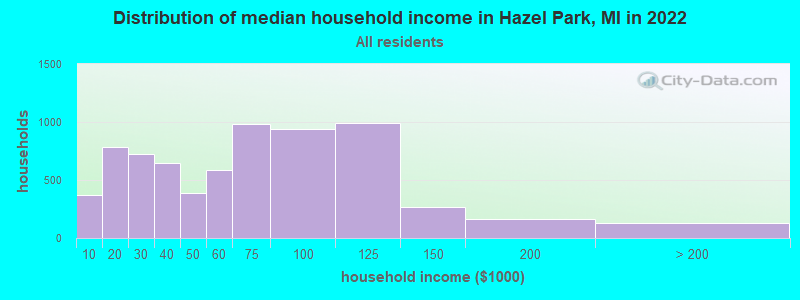
| Hazel Park: | $58,273 |
| MI: | $66,986 |
Estimated per capita income in 2022: $31,554 (it was $16,723 in 2000)
Hazel Park city income, earnings, and wages data
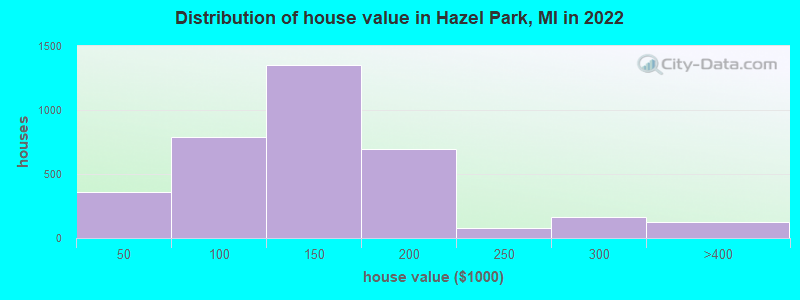
Estimated median house or condo value in 2022: $141,256 (it was $77,100 in 2000)
| Hazel Park: | $141,256 |
| MI: | $224,400 |
Mean prices in 2022: all housing units: $385,845; detached houses: $411,064; townhouses or other attached units: $279,603; in 2-unit structures: $305,018; in 3-to-4-unit structures: $206,955; in 5-or-more-unit structures: $228,603; mobile homes: $52,080; occupied boats, rvs, vans, etc.: $331,049
Median gross rent in 2022: $1,182.
(13.7% for White Non-Hispanic residents, 27.2% for Black residents, 14.3% for Hispanic or Latino residents, 70.3% for American Indian residents, 7.3% for other race residents, 20.7% for two or more races residents)
Detailed information about poverty and poor residents in Hazel Park, MI
Compare current foreclosures in Hazel Park, MI:
| Photo | Address | Area | Beds / Baths | Price | Details |
|---|---|---|---|---|---|

|
#1
Battelle Ave
Hazel Park, MI 48030
|
730 sq. feet
|
1 baths 2 beds |
show details | |

|
#2
Tawas Ave
Hazel Park, MI 48030
|
750 sq. feet
|
1 baths 3 beds |
show details | |

|
#3
W Bernhard Ave
Hazel Park, MI 48030
|
1,385 sq. feet
|
1 baths 3 beds |
show details | |

|
#4
W Hayes Ave
Hazel Park, MI 48030
|
1,865 sq. feet
|
1 baths 3 beds |
show details | |

|
#5
W Woodruff Ave
Hazel Park, MI 48030
|
1,202 sq. feet
|
1 baths 3 beds |
show details | |

|
#6
E George Ave
Hazel Park, MI 48030
|
1,344 sq. feet
|
1 baths 3 beds |
show details | |

|
#7
E Maxlow Ave
Hazel Park, MI 48030
|
1,149 sq. feet
|
1 baths 4 beds |
show details | |

|
#8
Hamata Ave
Hazel Park, MI 48030
|
753 sq. feet
|
1 baths 2 beds |
show details | |

|
#9
E Milton Ave
Hazel Park, MI 48030
|
1,782 sq. feet
|
2 baths 3 beds |
show details | |

|
#10
W Jarvis Ave
Hazel Park, MI 48030
|
1,136 sq. feet
|
1 baths 4 beds |
show details |
| Photo | Address | Area | Beds / Baths | Price | Details |
|---|---|---|---|---|---|

|
#11
E Harry Ave
Hazel Park, MI 48030
|
733 sq. feet
|
1 baths 2 beds |
show details | |

|
#12
Hazelwood Ave
Hazel Park, MI 48030
|
1,144 sq. feet
|
1 baths 3 beds |
show details | |

|
#13
E Muir Ave
Hazel Park, MI 48030
|
1,781 sq. feet
|
1 baths 3 beds |
show details | |

|
#14
E Morehouse Ave
Hazel Park, MI 48030
|
975 sq. feet
|
1 baths 3 beds |
show details | |

|
#15
Chestnut Ave
Hazel Park, MI 48030
|
941 sq. feet
|
1 baths 3 beds |
show details | |

|
#16
Caledonia Ave
Hazel Park, MI 48030
|
1,984 sq. feet
|
1 baths 2 beds |
show details | |

|
#17
E Brickley Ave
Hazel Park, MI 48030
|
1,328 sq. feet
|
2 baths 3 beds |
show details | |

|
#18
E Muir Ave
Hazel Park, MI 48030
|
1,637 sq. feet
|
1 baths 3 beds |
show details | |

|
#19
Tawas Ave
Hazel Park, MI 48030
|
922 sq. feet
|
1 baths 3 beds |
show details | |

|
#20
W George Ave
Hazel Park, MI 48030
|
726 sq. feet
|
1 baths 3 beds |
show details |
| Photo | Address | Area | Beds / Baths | Price | Details |
|---|---|---|---|---|---|

|
#21
Vassar Ave
Hazel Park, MI 48030
|
1,461 sq. feet
|
1 baths 1 beds |
show details | |

|
#22
W Milton Ave
Hazel Park, MI 48030
|
2,716 sq. feet
|
2 baths 3 beds |
show details | |

|
#23
E Shevlin Ave
Hazel Park, MI 48030
|
674 sq. feet
|
1 baths 2 beds |
show details | |

|
#24
E Evelyn Ave
Hazel Park, MI 48030
|
1,853 sq. feet
|
1 baths 5 beds |
show details | |

|
#25
E Elza Ave
Hazel Park, MI 48030
|
1,265 sq. feet
|
2 baths 3 beds |
show details | |

|
#26
E Meyers Ave
Hazel Park, MI 48030
|
950 sq. feet
|
1 baths 3 beds |
show details | |

|
#27
Davey Ave
Hazel Park, MI 48030
|
860 sq. feet
|
1 baths 2 beds |
show details | |

|
#28
E Hayes Ave
Hazel Park, MI 48030
|
1,782 sq. feet
|
1 baths 4 beds |
show details | |

|
#29
E Pearl Ave
Hazel Park, MI 48030
|
1,892 sq. feet
|
1 baths 3 beds |
show details | |

|
#30
E Mapledale Ave
Hazel Park, MI 48030
|
1,419 sq. feet
|
1 baths 2 beds |
show details |
| Photo | Address | Area | Beds / Baths | Price | Details |
|---|---|---|---|---|---|

|
#31
W Coy Ave
Hazel Park, MI 48030
|
1,041 sq. feet
|
1 baths 3 beds |
show details | |

|
#32
Caledonia Ave
Hazel Park, MI 48030
|
2,098 sq. feet
|
1 baths 3 beds |
show details | |

|
#33
E Elza Ave
Hazel Park, MI 48030
|
976 sq. feet
|
1 baths 2 beds |
show details | |

|
#34
E Milton Ave
Hazel Park, MI 48030
|
- sq. feet
|
- baths - beds |
show details | |

|
#35
W Mapledale Ave
Hazel Park, MI 48030
|
- sq. feet
|
- baths - beds |
show details | |

|
#36
W 9 Mile Rd
Hazel Park, MI 48030
|
- sq. feet
|
- baths - beds |
show details | |

|
#37
Crossley Ave
Hazel Park, MI 48030
|
- sq. feet
|
- baths - beds |
show details | |

|
#38
E Mapledale Ave
Hazel Park, MI 48030
|
- sq. feet
|
- baths - beds |
show details | |

|
#39
E Woodward Heights Blvd Apt 238
Hazel Park, MI 48030
|
- sq. feet
|
- baths - beds |
show details | |

|
#40
W Milton Ave
Hazel Park, MI 48030
|
- sq. feet
|
- baths - beds |
show details |
| Photo | Address | Area | Beds / Baths | Price | Details |
|---|---|---|---|---|---|

|
#41
E Browning Ave
Hazel Park, MI 48030
|
- sq. feet
|
- baths - beds |
show details | |

|
#42
Easterling Ave
Hazel Park, MI 48030
|
- sq. feet
|
- baths - beds |
show details | |

|
#43
E Meyers Ave
Hazel Park, MI 48030
|
- sq. feet
|
- baths - beds |
show details | |

|
Check over 1 million property listings on Foreclosure.com!
|
browse all offers | |||


- 11,11173.9%White alone
- 1,4449.6%Two or more races
- 1,2768.5%Black alone
- 8755.8%Hispanic
- 3322.2%Asian alone
- 670.4%Other race alone
- 270.2%American Indian alone
- 100.07%Native Hawaiian and Other
Pacific Islander alone
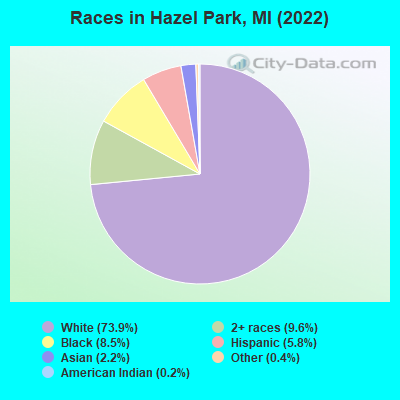
Races in Hazel Park detailed stats: ancestries, foreign born residents, place of birth
According to our research of Michigan and other state lists, there were 54 registered sex offenders living in Hazel Park, Michigan as of June 03, 2024.
The ratio of all residents to sex offenders in Hazel Park is 309 to 1.
The ratio of registered sex offenders to all residents in this city is near the state average.
Type |
2009 |
2010 |
2011 |
2012 |
2013 |
2014 |
2015 |
2016 |
2017 |
2018 |
2019 |
2020 |
2021 |
2022 |
|---|---|---|---|---|---|---|---|---|---|---|---|---|---|---|
| Murders (per 100,000) | 0 (0.0) | 0 (0.0) | 1 (6.1) | 0 (0.0) | 0 (0.0) | 0 (0.0) | 0 (0.0) | 1 (6.0) | 0 (0.0) | 2 (12.1) | 1 (6.1) | 1 (6.1) | 0 (0.0) | 3 (20.2) |
| Rapes (per 100,000) | 7 (39.2) | 9 (54.8) | 7 (42.7) | 4 (24.2) | 20 (120.2) | 19 (114.0) | 11 (66.0) | 4 (24.0) | 7 (42.3) | 12 (72.7) | 8 (48.5) | 0 (0.0) | 7 (43.2) | 3 (20.2) |
| Robberies (per 100,000) | 28 (156.9) | 19 (115.7) | 20 (121.9) | 19 (114.9) | 24 (144.2) | 12 (72.0) | 11 (66.0) | 13 (78.1) | 12 (72.5) | 12 (72.7) | 2 (12.1) | 6 (36.7) | 6 (37.1) | 7 (47.1) |
| Assaults (per 100,000) | 56 (313.7) | 43 (261.8) | 37 (225.5) | 66 (399.0) | 39 (234.3) | 38 (228.0) | 70 (420.3) | 37 (222.4) | 48 (290.0) | 31 (187.9) | 29 (176.0) | 26 (159.1) | 34 (210.0) | 28 (188.6) |
| Burglaries (per 100,000) | 128 (717.0) | 157 (956.0) | 161 (981.1) | 117 (707.3) | 90 (540.8) | 90 (540.0) | 84 (504.4) | 53 (318.6) | 57 (344.4) | 38 (230.3) | 20 (121.4) | 30 (183.6) | 27 (166.8) | 34 (229.0) |
| Thefts (per 100,000) | 235 (1,316) | 314 (1,912) | 283 (1,725) | 285 (1,723) | 283 (1,701) | 216 (1,296) | 206 (1,237) | 243 (1,461) | 257 (1,553) | 217 (1,315) | 212 (1,287) | 165 (1,010) | 161 (994.5) | 173 (1,165) |
| Auto thefts (per 100,000) | 137 (767.5) | 133 (809.9) | 119 (725.2) | 95 (574.3) | 61 (366.5) | 62 (372.0) | 46 (276.2) | 73 (438.8) | 59 (356.5) | 29 (175.7) | 28 (169.9) | 20 (122.4) | 33 (203.8) | 46 (309.8) |
| Arson (per 100,000) | 7 (39.2) | 4 (24.4) | 3 (18.3) | 1 (6.0) | 2 (12.0) | 2 (12.0) | 4 (24.0) | 2 (12.0) | 4 (24.2) | 5 (30.3) | 1 (6.1) | 0 (0.0) | 4 (24.7) | 1 (6.7) |
| City-Data.com crime index | 305.4 | 339.1 | 323.6 | 298.0 | 321.5 | 277.8 | 263.6 | 215.0 | 228.3 | 224.6 | 163.4 | 118.1 | 155.5 | 195.8 |
The City-Data.com crime index weighs serious crimes and violent crimes more heavily. Higher means more crime, U.S. average is 246.1. It adjusts for the number of visitors and daily workers commuting into cities.
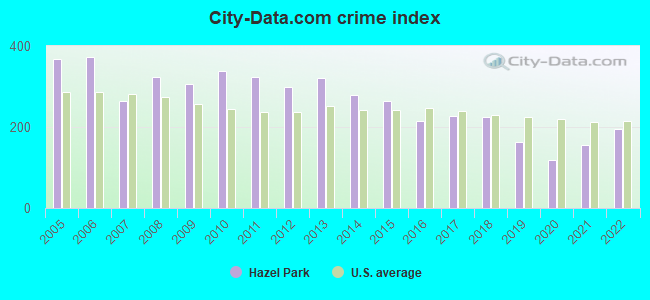
Crime rate in Hazel Park detailed stats: murders, rapes, robberies, assaults, burglaries, thefts, arson
Full-time law enforcement employees in 2021, including police officers: 38 (33 officers - 28 male; 5 female).
| Officers per 1,000 residents here: | 2.04 |
| Michigan average: | 1.86 |
 Recent articles from our blog. Our writers, many of them Ph.D. graduates or candidates, create easy-to-read articles on a wide variety of topics.

 | Where to live near Troy, Michigan :) (19 replies) |
| Black Detroiters are fleeing the city at an alarming rate (19 replies) |
| Do Detroit's suburbs suffer from Detroit's reputation? (68 replies) |
| What Suburbs Are On The Rise? (70 replies) |
| Detroit suburbs (63 replies) |
| Impressions of Hazel Park please (9 replies) |
Latest news from Hazel Park, MI collected exclusively by city-data.com from local newspapers, TV, and radio stations
Ancestries: German (8.7%), Irish (8.0%), English (7.8%), Polish (7.7%), American (7.1%), Italian (3.4%).
Current Local Time: EST time zone
Land area: 2.82 square miles.
Population density: 5,265 people per square mile (average).
984 residents are foreign born (4.3% Asia, 1.0% Europe).
| This city: | 6.5% |
| Michigan: | 6.9% |
Median real estate property taxes paid for housing units with mortgages in 2022: $2,454 (1.6%)
Median real estate property taxes paid for housing units with no mortgage in 2022: $1,794 (1.4%)
Nearest city with pop. 50,000+: Royal Oak, MI  (4.1 miles , pop. 60,062).
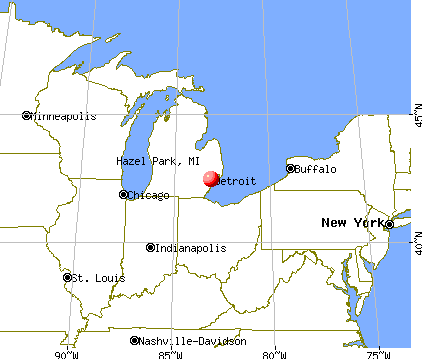
Nearest city with pop. 200,000+: Detroit, MI (5.0 miles , pop. 951,270).
Nearest city with pop. 1,000,000+: Chicago, IL (238.8 miles , pop. 2,896,016).
Nearest cities:
), )Latitude: 42.46 N, Longitude: 83.10 W
Daytime population change due to commuting: -3,215 (-21.4%)
Workers who live and work in this city: 2,035 (24.7%)

Hazel Park, Michigan accommodation & food services, waste management - Economy and Business Data
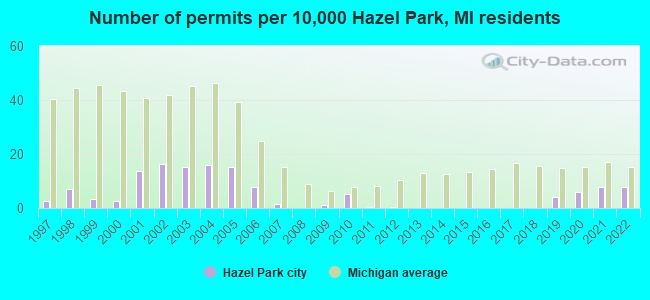
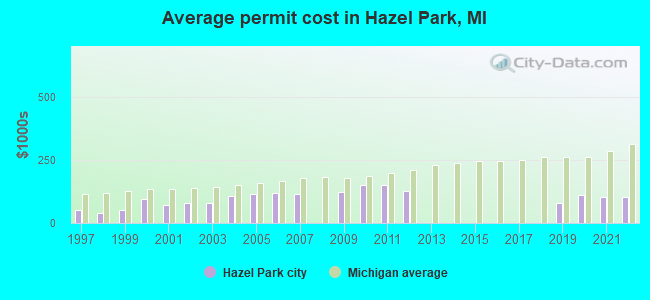
Single-family new house construction building permits:
- 2022: 15 buildings, average cost: $101,600
- 2021: 15 buildings, average cost: $103,100
- 2020: 11 buildings, average cost: $110,000
- 2019: 8 buildings, average cost: $80,000
- 2012: 1 building, cost: $125,000
- 2011: 1 building, cost: $148,500
- 2010: 10 buildings, average cost: $148,500
- 2009: 2 buildings, average cost: $122,400
- 2007: 3 buildings, average cost: $115,000
- 2006: 15 buildings, average cost: $119,600
- 2005: 29 buildings, average cost: $115,300
- 2004: 30 buildings, average cost: $105,800
- 2003: 29 buildings, average cost: $78,800
- 2002: 31 buildings, average cost: $80,500
- 2001: 26 buildings, average cost: $73,400
- 2000: 5 buildings, average cost: $94,600
- 1999: 6 buildings, average cost: $53,300
- 1998: 13 buildings, average cost: $40,400
- 1997: 5 buildings, average cost: $53,400
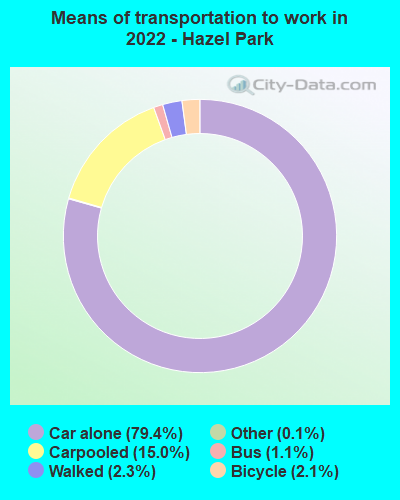
| Here: | 2.6% |
| Michigan: | 3.5% |
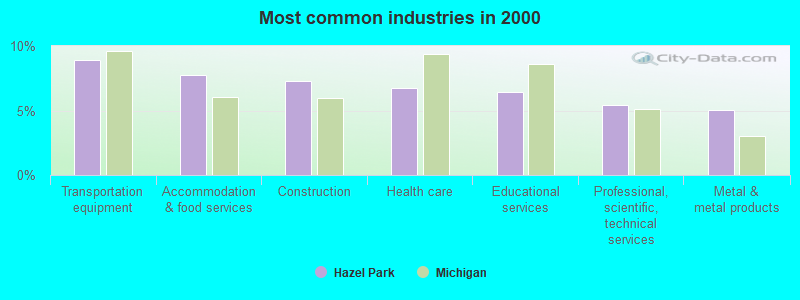
- Transportation equipment (8.9%)
- Accommodation & food services (7.8%)
- Construction (7.3%)
- Health care (6.8%)
- Educational services (6.5%)
- Professional, scientific, technical services (5.4%)
- Metal & metal products (5.1%)
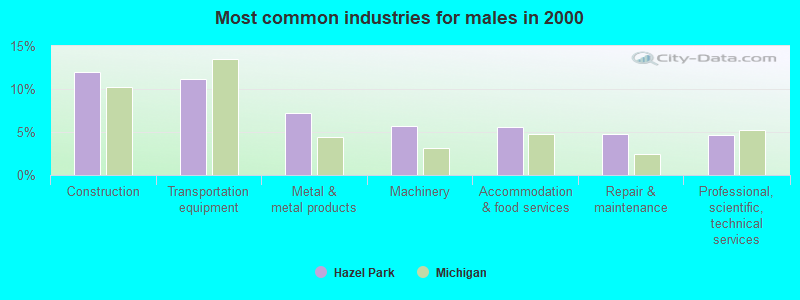
- Construction (12.0%)
- Transportation equipment (11.2%)
- Metal & metal products (7.2%)
- Machinery (5.7%)
- Accommodation & food services (5.6%)
- Repair & maintenance (4.7%)
- Professional, scientific, technical services (4.6%)
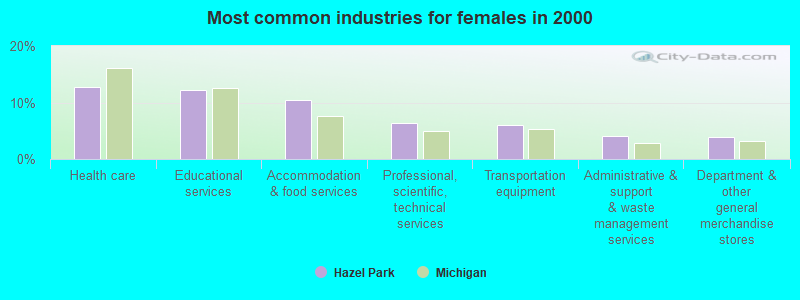
- Health care (12.8%)
- Educational services (12.2%)
- Accommodation & food services (10.4%)
- Professional, scientific, technical services (6.3%)
- Transportation equipment (6.1%)
- Administrative & support & waste management services (4.0%)
- Department & other general merchandise stores (3.9%)
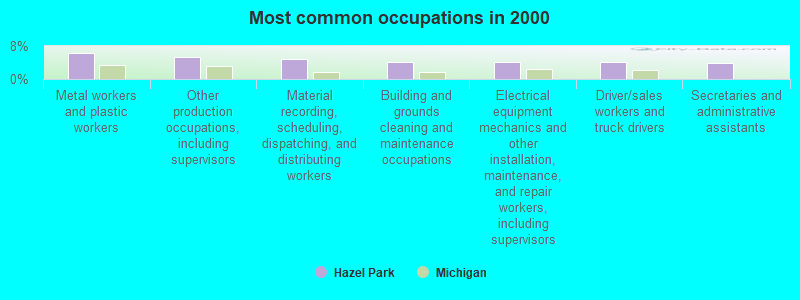
- Metal workers and plastic workers (6.3%)
- Other production occupations, including supervisors (5.3%)
- Material recording, scheduling, dispatching, and distributing workers (4.8%)
- Building and grounds cleaning and maintenance occupations (4.1%)
- Electrical equipment mechanics and other installation, maintenance, and repair workers, including supervisors (4.1%)
- Driver/sales workers and truck drivers (4.0%)
- Secretaries and administrative assistants (3.9%)
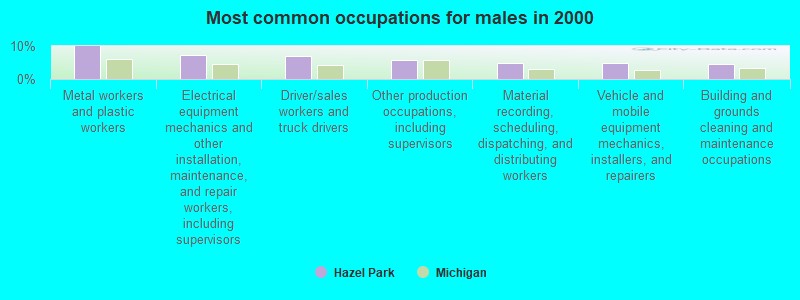
- Metal workers and plastic workers (9.9%)
- Electrical equipment mechanics and other installation, maintenance, and repair workers, including supervisors (7.3%)
- Driver/sales workers and truck drivers (6.9%)
- Other production occupations, including supervisors (5.7%)
- Material recording, scheduling, dispatching, and distributing workers (4.9%)
- Vehicle and mobile equipment mechanics, installers, and repairers (4.8%)
- Building and grounds cleaning and maintenance occupations (4.5%)

- Secretaries and administrative assistants (8.1%)
- Other office and administrative support workers, including supervisors (5.5%)
- Other production occupations, including supervisors (4.8%)
- Cashiers (4.7%)
- Material recording, scheduling, dispatching, and distributing workers (4.6%)
- Information and record clerks, except customer service representatives (4.4%)
- Other teachers, instructors, education, training, and library occupations (4.2%)
Average climate in Hazel Park, Michigan
Based on data reported by over 4,000 weather stations


|
|

(lower is better)
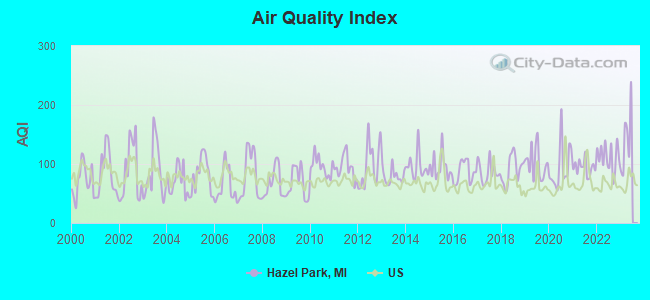
Air Quality Index (AQI) level in 2022 was 111. This is significantly worse than average.
| City: | 111 |
| U.S.: | 73 |
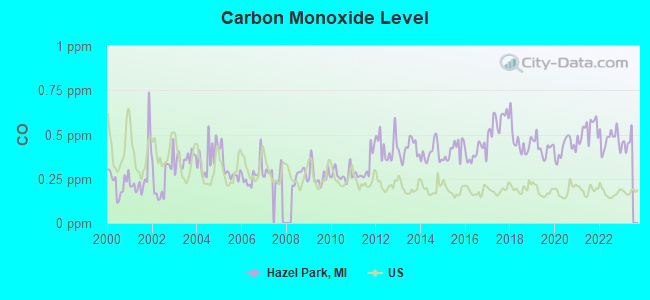
Carbon Monoxide (CO) [ppm] level in 2022 was 0.470. This is significantly worse than average. Closest monitor was 4.3 miles away from the city center.
| City: | 0.470 |
| U.S.: | 0.251 |
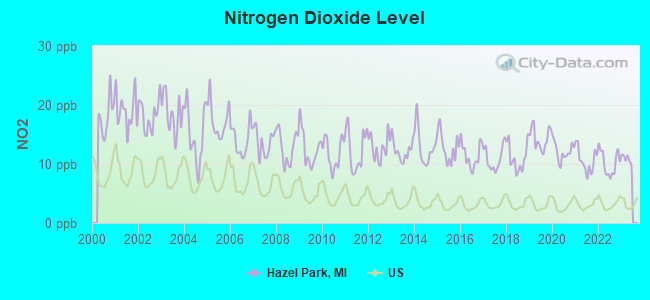
Nitrogen Dioxide (NO2) [ppb] level in 2022 was 10.2. This is significantly worse than average. Closest monitor was 3.5 miles away from the city center.
| City: | 10.2 |
| U.S.: | 5.1 |
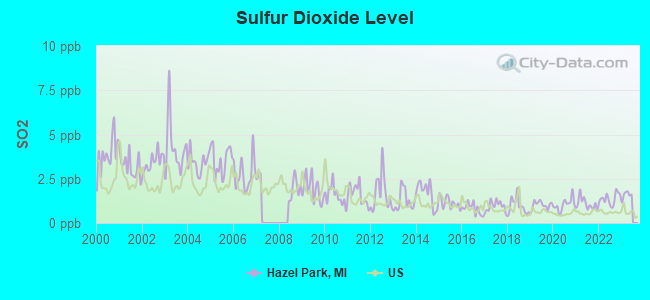
Sulfur Dioxide (SO2) [ppb] level in 2022 was 1.37. This is about average. Closest monitor was 3.5 miles away from the city center.
| City: | 1.37 |
| U.S.: | 1.51 |
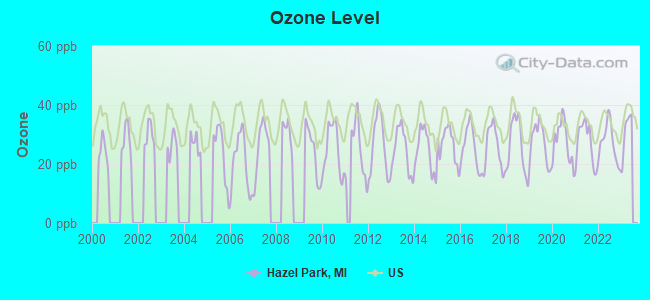
Ozone [ppb] level in 2022 was 27.2. This is better than average. Closest monitor was 3.5 miles away from the city center.
| City: | 27.2 |
| U.S.: | 33.3 |
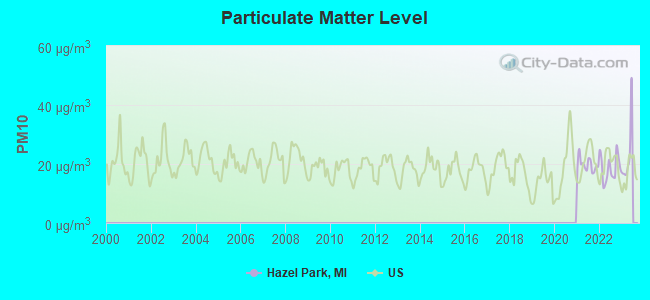
Particulate Matter (PM10) [µg/m3] level in 2022 was 18.6. This is about average. Closest monitor was 10.8 miles away from the city center.
| City: | 18.6 |
| U.S.: | 19.2 |
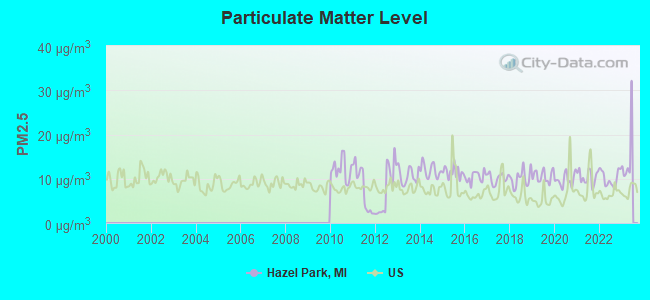
Particulate Matter (PM2.5) [µg/m3] level in 2022 was 10.1. This is worse than average. Closest monitor was 4.3 miles away from the city center.
| City: | 10.1 |
| U.S.: | 8.1 |
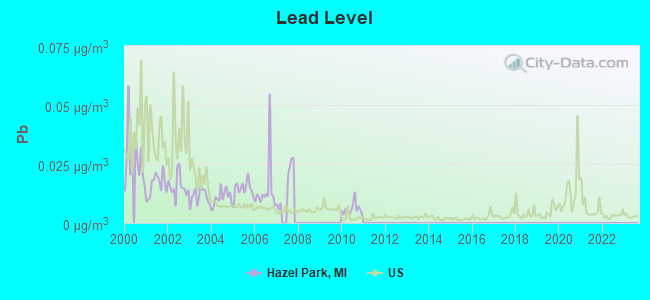
Lead (Pb) [µg/m3] level in 2010 was 0.00596. This is significantly better than average. Closest monitor was 3.1 miles away from the city center.
| City: | 0.00596 |
| U.S.: | 0.00931 |
Tornado activity:
Hazel Park-area historical tornado activity is slightly above Michigan state average. It is 28% greater than the overall U.S. average.
On 7/4/1957, a category F4 (max. wind speeds 207-260 mph) tornado 4.4 miles away from the Hazel Park city center injured 6 people and caused between $50,000 and $500,000 in damages.
On 3/20/1976, a category F4 tornado 13.4 miles away from the city center killed one person and injured 55 people and caused between $5,000,000 and $50,000,000 in damages.
Earthquake activity:
Hazel Park-area historical earthquake activity is significantly above Michigan state average. It is 48% smaller than the overall U.S. average.On 9/25/1998 at 19:52:52, a magnitude 5.2 (4.8 MB, 4.3 MS, 5.2 LG, 4.5 MW, Depth: 3.1 mi, Class: Moderate, Intensity: VI - VII) earthquake occurred 154.2 miles away from Hazel Park center
On 1/31/1986 at 16:46:43, a magnitude 5.0 (5.0 MB) earthquake occurred 115.9 miles away from Hazel Park center
On 7/12/1986 at 08:19:37, a magnitude 4.5 (4.5 MB, Class: Light, Intensity: IV - V) earthquake occurred 148.4 miles away from Hazel Park center
On 7/27/1980 at 18:52:21, a magnitude 5.2 (5.1 MB, 4.7 MS, 5.0 UK, 5.2 UK) earthquake occurred 297.6 miles away from the city center
On 5/2/2015 at 16:23:07, a magnitude 4.2 (4.2 MW, Depth: 2.8 mi) earthquake occurred 120.1 miles away from Hazel Park center
On 8/23/2011 at 17:51:04, a magnitude 5.8 (5.8 MW, Depth: 3.7 mi) earthquake occurred 416.3 miles away from the city center
Magnitude types: regional Lg-wave magnitude (LG), body-wave magnitude (MB), surface-wave magnitude (MS), moment magnitude (MW)
Natural disasters:
The number of natural disasters in Oakland County (12) is smaller than the US average (15).Major Disasters (Presidential) Declared: 6
Emergencies Declared: 5
Causes of natural disasters: Storms: 6, Floods: 5, Tornadoes: 3, Winter Storms: 2, Blizzard: 1, Hurricane: 1, Power Outage: 1, Snowstorm: 1, Wind: 1, Other: 1 (Note: some incidents may be assigned to more than one category).

Hospitals and medical centers in Hazel Park:
Other hospitals and medical centers near Hazel Park:
- SOUTHEAST MICHIGAN SURGICAL HOSPITAL Acute Care Hospitals (about 1 miles away; WARREN, MI)
- HILTON CONV HOME (Nursing Home, about 2 miles away; FERNDALE, MI)
- HILTON CONVALESCENT HOME (Nursing Home, about 2 miles away; FERNDALE, MI)
- FMC DIALYSIS - MADISON HEIGHTS (Dialysis Facility, about 2 miles away; MADISON HEIGHTS, MI)
- PINNACLE HOME HEALTH CARE, INC (Home Health Center, about 2 miles away; MADISON HEIGHTS, MI)
- STATE FAIR DIALYSIS - DAVITA (Dialysis Facility, about 2 miles away; DETROIT, MI)
- OMNI HOME HEALTH CARE, INC (Home Health Center, about 2 miles away; WARREN, MI)
Amtrak stations near Hazel Park:
- 4 miles: ROYAL OAK (201 S. SHERMAN DR.) . Services: enclosed waiting area, public payphones, vending machines, paid short-term parking, taxi stand, intercity bus service, public transit connection.
- 7 miles: DETROIT (11 W. BALTIMORE AVE.) . Services: ticket office, partially wheelchair accessible, enclosed waiting area, public restrooms, public payphones, free short-term parking, call for car rental service, taxi stand, public transit connection.
- 8 miles: BIRMINGHAM (449 S. ETON ST.) . Services: public payphones, free short-term parking, free long-term parking, call for taxi service, public transit connection.
Colleges/universities with over 2000 students nearest to Hazel Park:
- University of Detroit Mercy (about 4 miles; Detroit, MI; Full-time enrollment: 3,406)
- Wayne State University (about 8 miles; Detroit, MI; FT enrollment: 20,204)
- Macomb Community College (about 8 miles; Warren, MI; FT enrollment: 15,669)
- Lawrence Technological University (about 8 miles; Southfield, MI; FT enrollment: 2,430)
- Wayne County Community College District (about 10 miles; Detroit, MI; FT enrollment: 10,554)
- Baker College of Clinton Township (about 12 miles; Clinton Township, MI; FT enrollment: 3,413)
- Henry Ford Community College (about 12 miles; Dearborn, MI; FT enrollment: 12,610)
Public high schools in Hazel Park:
- HAZEL PARK HIGH SCHOOL (Students: 1,138, Location: 23400 HUGHES AVE, Grades: 9-12)
- HAZEL PARK ALTERNATIVE HIGH SCHOOL (Students: 915, Location: 1620 EAST ELZA AVE, Grades: 9-12)
- MOMENTUM ACADEMY (Location: 99 E WOODWARD HEIGHTS BLVD, Grades: PK-9, Charter school)
- HAZEL PARK ADVANTAGE ALTERNATIVE SCHOOL (Location: 420 WEST 9 MILE RD, Grades: KG-11)
- HAZEL PARK ADULT EDUCATION (Location: 420 WEST 9 MILE RD, Grades: 9-12)
- HAZEL PARK ACCESS ALTERNATIVE SCHOOL (Location: 1543 E. EIGHT MILE ROAD, Grades: 9-12)
- INVEST ROOSEVELT ALTERNATIVE HIGH SCHOOL (Location: 24131 S CHRYSLER DR, Grades: 9-12)
- HAZEL PARK MICHIGAN ONLINE HIGH SCHOOL (Location: 1543 E 8 MILE RD, Grades: 9-12)
Public elementary/middle schools in Hazel Park:
- HAZEL PARK JUNIOR HIGH SCHOOL (Students: 549, Location: 22770 HIGHLAND AVE, Grades: 6-8)
- UNITED OAKS ELEMENTARY SCHOOL (Students: 446, Location: 1001 EAST HARRY AVE, Grades: KG-5)
- HOOVER ELEMENTARY SCHOOL (Students: 417, Location: 23720 HOOVER AVE, Grades: PK-5)
- WEBSTER ELEMENTARY SCHOOL (Location: 431 WEST JARVIS AVE, Grades: PK-5)
- INVEST GRACE ALTERNATIVE ELEM/MIDDLE SCHOOL (Location: 570 E MAPLEDALE AVE, Grades: KG-8)
Points of interest:
Notable locations in Hazel Park: West Nine Mile Road Station (A), Hazel Park City Hall (B), Hazel Park Memorial Public Library (C), Hazel Park Police Station (D), Oakland County District Courthouse (E), Hazel Park Fire Department (F). Display/hide their locations on the map
Shopping Center: Hazel Park Retail Center Shopping Center (1). Display/hide its location on the map
Churches in Hazel Park include: Church of Christ Hazel Park (A), Power and Praise Worship Center (B), Saint Justin's Catholic Church (C). Display/hide their locations on the map
Parks in Hazel Park include: Scout Park (1), Tucker Park (2), Hazel Park Harness Raceway (3), Felker Field (4), Grba Field (5), Green Acres Park (6), Karam Park (7), Kennedy Park (8), Madge Park (9). Display/hide their locations on the map
Birthplace of: Archie McCardell - Chief executive and Army soldier, Bill Virdon - Baseball player and coach, Myles Jury - Mixed martial artist, Connor Barwin - College football player (Cincinnati Bearcats).
| This city: | 2.5 people |
| Michigan: | 2.5 people |
| This city: | 60.2% |
| Whole state: | 66.0% |
| This city: | 9.4% |
| Whole state: | 6.4% |
Likely homosexual households (counted as self-reported same-sex unmarried-partner households)
- Lesbian couples: 0.5% of all households
- Gay men: 0.3% of all households
7 people in homes for the mentally ill in 2000
Banks with branches in Hazel Park (2011 data):
- PNC Bank, National Association: 9 Mile Chrysler Drive Branch at 22711 South Chrysler Drive, branch established on 1951/12/31. Info updated 2012/03/20: Bank assets: $263,309.6 mil, Deposits: $197,343.0 mil, headquarters in Wilmington, DE, positive income, Commercial Lending Specialization, 3085 total offices, Holding Company: Pnc Financial Services Group, Inc., The
For population 15 years and over in Hazel Park:
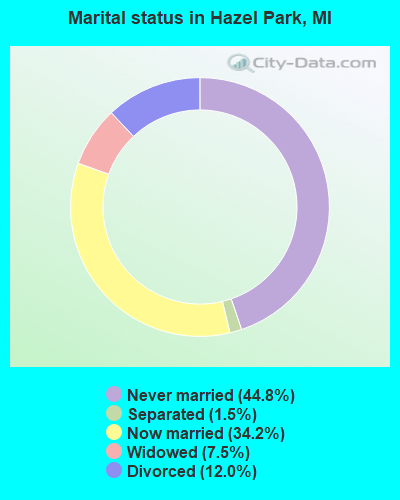
- Never married: 44.8%
- Now married: 34.2%
- Separated: 1.5%
- Widowed: 7.5%
- Divorced: 12.0%
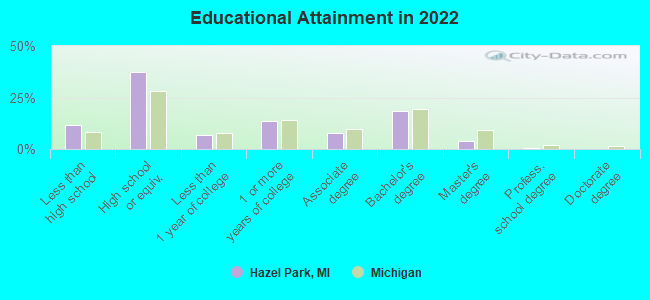
For population 25 years and over in Hazel Park:
- High school or higher: 87.9%
- Bachelor's degree or higher: 22.5%
- Graduate or professional degree: 4.7%
- Unemployed: 8.8%
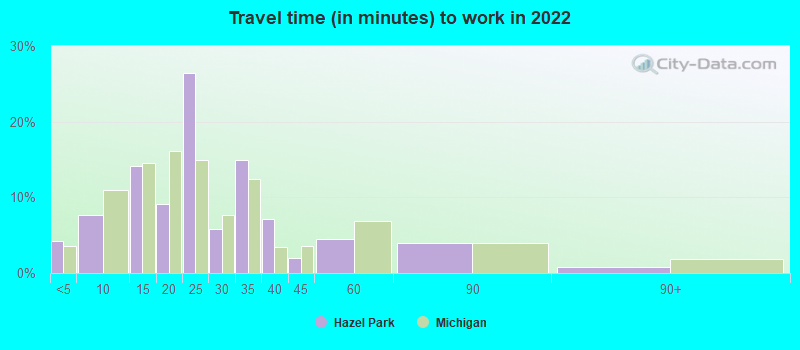
- Mean travel time to work (commute): 19.7 minutes
| Here: | 10.9 |
| Michigan average: | 11.0 |
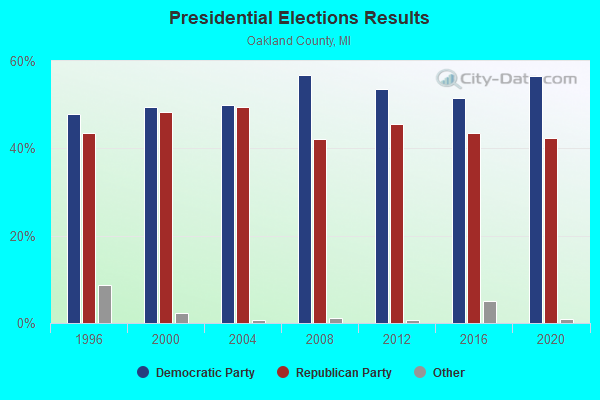
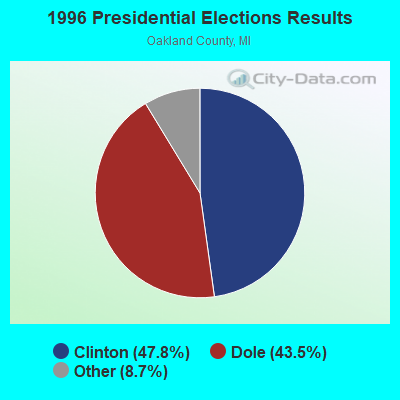
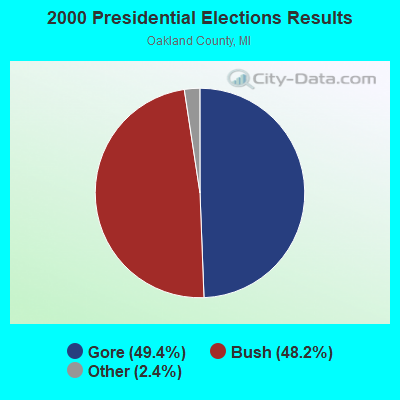
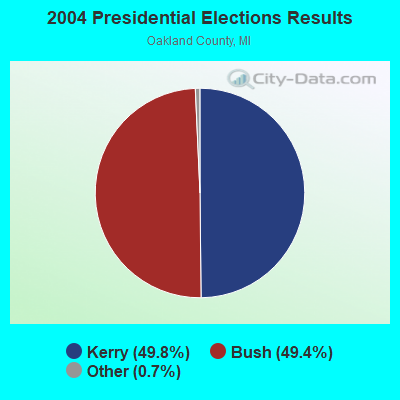
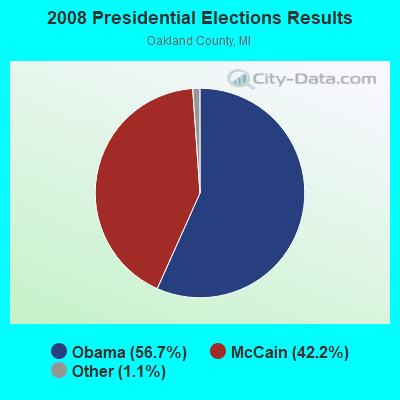
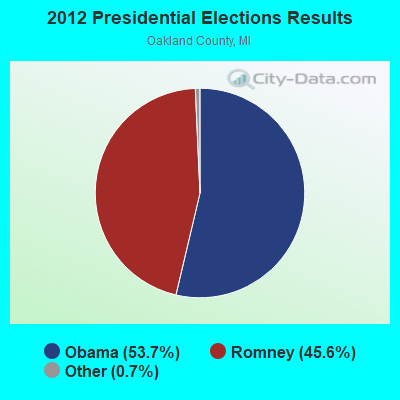
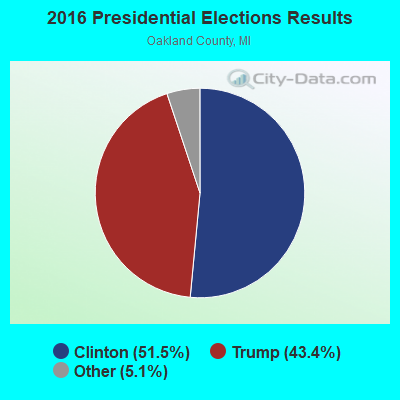
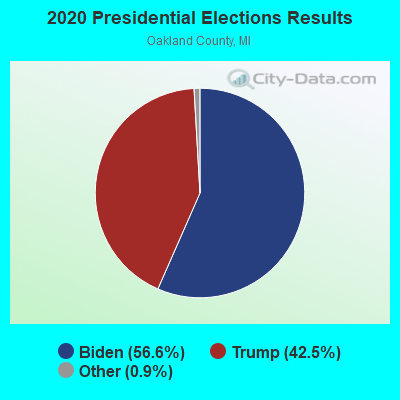
Graphs represent county-level data. Detailed 2008 Election Results
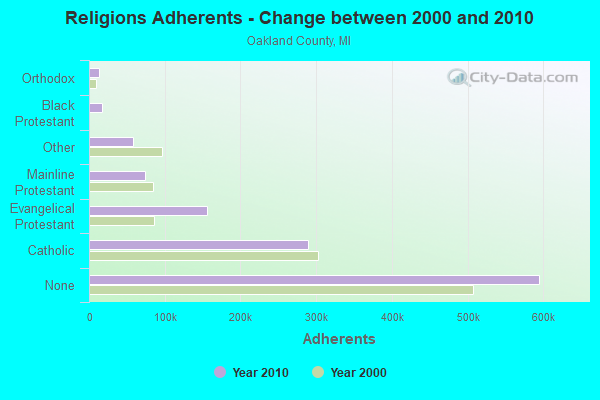
Religion statistics for Hazel Park, MI (based on Oakland County data)
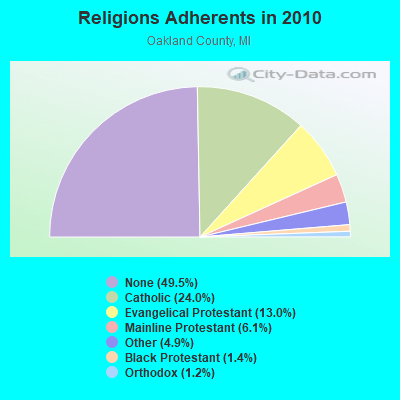
| Religion | Adherents | Congregations |
|---|---|---|
| Catholic | 289,116 | 64 |
| Evangelical Protestant | 155,826 | 319 |
| Mainline Protestant | 73,373 | 159 |
| Other | 58,590 | 117 |
| Black Protestant | 16,826 | 35 |
| Orthodox | 13,844 | 23 |
| None | 594,787 | - |
Food Environment Statistics:
| Oakland County: | 2.44 / 10,000 pop. |
| Michigan: | 2.34 / 10,000 pop. |
| This county: | 0.18 / 10,000 pop. |
| State: | 0.18 / 10,000 pop. |
| Oakland County: | 1.35 / 10,000 pop. |
| Michigan: | 1.52 / 10,000 pop. |
| Here: | 2.43 / 10,000 pop. |
| Michigan: | 2.99 / 10,000 pop. |
| This county: | 8.18 / 10,000 pop. |
| Michigan: | 6.80 / 10,000 pop. |
| Oakland County: | 8.8% |
| State: | 9.7% |
| This county: | 25.6% |
| State: | 29.7% |
| Oakland County: | 13.0% |
| State: | 13.4% |
Health and Nutrition:
| Here: | 51.1% |
| Michigan: | 50.3% |
| Here: | 49.3% |
| Michigan: | 47.9% |
| Hazel Park: | 28.9 |
| Michigan: | 28.7 |
| Hazel Park: | 21.5% |
| Michigan: | 20.6% |
| This city: | 11.6% |
| Michigan: | 10.4% |
| Hazel Park: | 6.8 |
| State: | 6.8 |
| Here: | 34.9% |
| Michigan: | 34.1% |
| Hazel Park: | 58.4% |
| Michigan: | 57.0% |
| Hazel Park: | 79.6% |
| Michigan: | 79.6% |
More about Health and Nutrition of Hazel Park, MI Residents
| Local government employment and payroll (March 2022) | |||||
| Function | Full-time employees | Monthly full-time payroll | Average yearly full-time wage | Part-time employees | Monthly part-time payroll |
|---|---|---|---|---|---|
| Police Protection - Officers | 38 | $235,793 | $74,461 | 4 | $4,034 |
| Firefighters | 20 | $153,346 | $92,008 | 0 | $0 |
| Judicial and Legal | 11 | $63,684 | $69,473 | 6 | $12,435 |
| Other and Unallocable | 9 | $35,257 | $47,009 | 1 | $318 |
| Sewerage | 8 | $37,632 | $56,448 | 0 | $0 |
| Solid Waste Management | 8 | $29,666 | $44,499 | 0 | $0 |
| Financial Administration | 5 | $27,509 | $66,022 | 1 | $1,196 |
| Other Government Administration | 5 | $42,349 | $101,638 | 4 | $7,954 |
| Local Libraries | 4 | $14,681 | $44,043 | 8 | $7,200 |
| Parks and Recreation | 4 | $9,599 | $28,797 | 5 | $4,256 |
| Water Supply | 4 | $16,269 | $48,807 | 1 | $2,126 |
| Health | 1 | $3,543 | $42,516 | 1 | $689 |
| Streets and Highways | 0 | $0 | 3 | $6,271 | |
| Welfare | 0 | $0 | 2 | $4,780 | |
| Totals for Government | 117 | $669,329 | $68,649 | 36 | $51,259 |
Hazel Park government finances - Expenditure in 2021 (per resident):
- Current Operations - Police Protection: $6,069,000 ($409.02)
General - Other: $5,026,000 ($338.72)
Sewerage: $3,724,000 ($250.98)
Regular Highways: $3,202,000 ($215.80)
Local Fire Protection: $3,001,000 ($202.25)
Solid Waste Management: $1,997,000 ($134.59)
Central Staff Services: $1,934,000 ($130.34)
Judicial and Legal Services: $1,846,000 ($124.41)
Parks and Recreation: $894,000 ($60.25)
Financial Administration: $589,000 ($39.70)
Protective Inspection and Regulation - Other: $492,000 ($33.16)
General Public Buildings: $126,000 ($8.49)
- General - Interest on Debt: $271,000 ($18.26)
- Intergovernmental to Local - Other - Sewerage: $1,761,000 ($118.68)
Other - General - Other: $120,000 ($8.09)
- Other Capital Outlay - Regular Highways: $4,241,000 ($285.82)
Water Utilities: $223,000 ($15.03)
General - Other: $198,000 ($13.34)
Police Protection: $148,000 ($9.97)
Local Fire Protection: $69,000 ($4.65)
- Total Salaries and Wages: $11,473,000 ($773.22)
- Water Utilities - Interest on Debt: $14,000 ($0.94)
Hazel Park government finances - Revenue in 2021 (per resident):
- Charges - Other: $14,993,000 ($1010.45)
- Federal Intergovernmental - Other: $1,254,000 ($84.51)
Housing and Community Development: $86,000 ($5.80)
- Local Intergovernmental - Other: $1,026,000 ($69.15)
- Miscellaneous - Rents: $1,162,000 ($78.31)
General Revenue - Other: $1,145,000 ($77.17)
Fines and Forfeits: $288,000 ($19.41)
Sale of Property: $54,000 ($3.64)
Donations From Private Sources: $3,000 ($0.20)
Interest Earnings: $1,000 ($0.07)
- State Intergovernmental - General Local Government Support: $2,430,000 ($163.77)
Highways: $1,815,000 ($122.32)
Other: $1,098,000 ($74.00)
- Tax - Property: $7,104,000 ($478.77)
Other License: $1,404,000 ($94.62)
Occupation and Business License - Other: $377,000 ($25.41)
Hazel Park government finances - Debt in 2021 (per resident):
- Long Term Debt - Beginning Outstanding - Unspecified Public Purpose: $8,677,000 ($584.78)
Outstanding Unspecified Public Purpose: $7,316,000 ($493.06)
Retired Unspecified Public Purpose: $1,361,000 ($91.72)
Hazel Park government finances - Cash and Securities in 2021 (per resident):
- Other Funds - Cash and Securities: $17,133,000 ($1154.67)
5.91% of this county's 2021 resident taxpayers lived in other counties in 2020 ($79,655 average adjusted gross income)
| Here: | 5.91% |
| Michigan average: | 5.83% |
0.01% of residents moved from foreign countries ($78 average AGI)
Oakland County: 0.01% Michigan average: 0.00%
Top counties from which taxpayers relocated into this county between 2020 and 2021:
| from Wayne County, MI | |
| from Macomb County, MI | |
| from Genesee County, MI |
6.21% of this county's 2020 resident taxpayers moved to other counties in 2021 ($89,748 average adjusted gross income)
| Here: | 6.21% |
| Michigan average: | 5.95% |
0.01% of residents moved to foreign countries ($55 average AGI)
Oakland County: 0.01% Michigan average: 0.00%
Top counties to which taxpayers relocated from this county between 2020 and 2021:
| to Wayne County, MI | |
| to Macomb County, MI | |
| to Genesee County, MI |
| Businesses in Hazel Park, MI | ||||
| Name | Count | Name | Count | |
|---|---|---|---|---|
| AT&T | 1 | H&R Block | 1 | |
| Ace Hardware | 1 | Hardee's | 1 | |
| AutoZone | 1 | Kroger | 1 | |
| Blockbuster | 1 | McDonald's | 1 | |
| CVS | 1 | Taco Bell | 1 | |
| ColorTyme | 1 | Tim Hortons | 1 | |
| Dairy Queen | 1 | UPS | 1 | |
| Fashion Bug | 1 | Wendy's | 1 | |
| FedEx | 1 | |||
Strongest AM radio stations in Hazel Park:
- WWJ (950 AM; 50 kW; DETROIT, MI; Owner: INFINITY BROADCASTING OPERATIONS, INC.)
- WXYT (1270 AM; 50 kW; DETROIT, MI; Owner: INFINITY BROADCASTING CORP. OF DETROIT)
- WEXL (1340 AM; 1 kW; ROYAL OAK, MI; Owner: WMUZ RADIO, INC.)
- WJR (760 AM; 50 kW; DETROIT, MI; Owner: ABC, INC.)
- WDFN (1130 AM; 50 kW; DETROIT, MI; Owner: AMFM RADIO LICENSES, L.L.C.)
- WCHB (1200 AM; 50 kW; TAYLOR, MI; Owner: RADIO ONE OF DETROIT, LLC)
- WFDF (910 AM; 50 kW; FLINT, MI; Owner: ABC, INC.)
- WQBH (1400 AM; 1 kW; DETROIT, MI; Owner: QUEEN'S BROADCASTING CORP.)
- WUFL (1030 AM; daytime; 5 kW; STERLING HEIGHTS, MI; Owner: FAMILY LIFE BROADCASTING SYSTEM)
- WXDX (1310 AM; 5 kW; DEARBORN, MI; Owner: AMFM RADIO LICENSES, L.L.C.)
- WDEO (990 AM; 9 kW; YPSILANTI, MI; Owner: WORD BROADCASTERS, INC.)
- WOAP (1080 AM; 50 kW; OWOSSO, MI)
- WTKA (1050 AM; 10 kW; ANN ARBOR, MI; Owner: CAPSTAR TX LIMITED PARTNERSHIP)
Strongest FM radio stations in Hazel Park:
- WOMC (104.3 FM; DETROIT, MI; Owner: INFINITY BROADCASTING CORPORATION OF MICHIGAN)
- WMGC-FM (105.1 FM; DETROIT, MI; Owner: GREATER BOSTON RADIO, INC.)
- WCSX (94.7 FM; BIRMINGHAM, MI; Owner: GREATER BOSTON RADIO, INC.)
- WDVD (96.3 FM; DETROIT, MI; Owner: ABC, INC.)
- WKRK-FM (97.1 FM; DETROIT, MI; Owner: INFINITY BROADCASTING OPERATIONS, INC.)
- WYCD (99.5 FM; DETROIT, MI; Owner: INFINITY BROADCASTING CORPORATION OF MICHIGAN)
- WJLB (97.9 FM; DETROIT, MI; Owner: AMFM RADIO LICENSES, L.L.C.)
- WDTJ (105.9 FM; DETROIT, MI; Owner: RADIO ONE OF DETROIT, LLC)
- WDRQ (93.1 FM; DETROIT, MI; Owner: ABC, INC.)
- WNIC (100.3 FM; DEARBORN, MI; Owner: AMFM RADIO LICENSES, L.L.C.)
- WRIF (101.1 FM; DETROIT, MI; Owner: GREATER BOSTON RADIO, INC.)
- WVMV (98.7 FM; DETROIT, MI; Owner: INFINITY BROADCASTING OPERATIONS, INC.)
- WDTR-FM (90.9 FM; DETROIT, MI; Owner: BOARD OF EDUCATION, CITY OF DETROIT)
- WKQI (95.5 FM; DETROIT, MI; Owner: AMFM RADIO LICENSES, L.L.C.)
- WMXD (92.3 FM; DETROIT, MI; Owner: AMFM RADIO LICENSES, L.L.C.)
- WDTW (106.7 FM; DETROIT, MI; Owner: AMFM RADIO LICENSES, L.L.C.)
- WDET-FM (101.9 FM; DETROIT, MI; Owner: WAYNE STATE UNIVERSITY)
- WGPR (107.5 FM; DETROIT, MI; Owner: WGPR, INC.)
- WMUZ (103.5 FM; DETROIT, MI; Owner: WMUZ RADIO, INC.)
- WHPR-FM (88.1 FM; HIGHLAND PARK, MI; Owner: R.J.'S LATE NIGHT ENTERTAINMENT CORPORATION)
TV broadcast stations around Hazel Park:
- WWJ-TV (Channel 62; DETROIT, MI; Owner: CBS BROADCASTING INC.)
- WDWB (Channel 20; DETROIT, MI; Owner: WXON LICENSE, INC.)
- WTVS (Channel 56; DETROIT, MI; Owner: DETROIT EDUC. TV FOUNDATION)
- WBXD-CA (Channel 5; DETROIT, MI; Owner: THE BOX WORLDWIDE LLC)
- WJBK (Channel 2; DETROIT, MI; Owner: FOX TELEVISION STATIONS, INC.)
- WDIV-TV (Channel 4; DETROIT, MI; Owner: POST-NEWSWEEK STATIONS, MICHIGAN, INC.)
- WXYZ-TV (Channel 7; DETROIT, MI; Owner: CHANNEL 7 OF DETROIT, INC.)
- WKBD (Channel 50; DETROIT, MI; Owner: VIACOM STATIONS GROUP OF DETROIT INC.)
- WLPC-LP (Channel 26; DETROIT, MI; Owner: GLENN R. AND KARIN A. PLUMMER)
- WADL (Channel 38; MOUNT CLEMENS, MI; Owner: ADELL BROADCASTING CORPORATION)
- WDWO-CA (Channel 18; DETROIT, MI; Owner: TCT OF MICHIGAN, INC.)
- W33BY (Channel 68; DETROIT, MI; Owner: HIGHLAND PARK BROADCASTING, L.P.)
- W48AV (Channel 48; DETROIT, MI; Owner: PAXSON COMMUNICATIONS LICENSE COMPANY, LLC)
- WFUM (Channel 28; FLINT, MI; Owner: UNIVERSITY OF MICHIGAN)
- National Bridge Inventory (NBI) Statistics
- 18Number of bridges
- 141ft / 42.5mTotal length
- $284,000Total costs
- 1,947,600Total average daily traffic
- 134,009Total average daily truck traffic
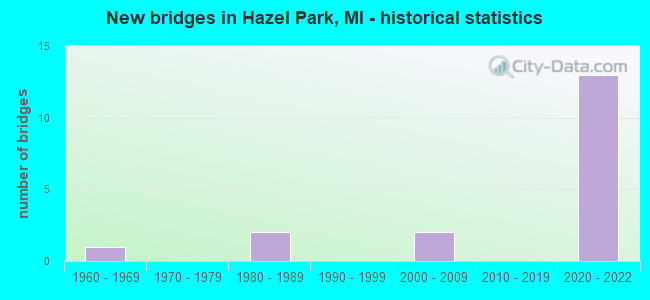
- New bridges - historical statistics
- 11960-1969
- 21980-1989
- 22000-2009
- 132020-2022
FCC Registered Antenna Towers:
3- Christophe Le Scanve, 1400 E 10 Mile Rd - 16661454 (Lat: 42.476083 Lon: -83.093806), Type: 12.1, Structure height: 26125 m, Overall height: 12.1 m, Registrant: Cellco Partnership, Network.Regulatory@verizonwireless.Com, Np2ne Network Engineering, Alpha-retta, Phone: (770) 797-1070
- Christophe Le Scanve, 1400 E 10 Mile Rd - 16661454 (Lat: 42.476083 Lon: -83.093806), Type: 12.1, Structure height: 26125 m, Overall height: 12.1 m, Registrant: Cellco Partnership, Network.Regulatory@verizonwireless.Com, Np2ne Network Engineering, Alpha-retta, Phone: (770) 797-1070
- Christophe Le Scanve, 1400 E 10 Mile Rd - 16661454 (Lat: 42.476083 Lon: -83.093806), Type: 12.1, Structure height: 26125 m, Overall height: 12.1 m, Registrant: Cellco Partnership, Network.Regulatory@verizonwireless.Com, Np2ne Network Engineering, Alpha-retta, Phone: (770) 797-1070
FCC Registered Broadcast Land Mobile Towers:
8 (See the full list of FCC Registered Broadcast Land Mobile Towers in Hazel Park, MI)FCC Registered Microwave Towers:
4- Sw Corner Int Of I 75 & I 696 (Lat: 42.475861 Lon: -83.112417), Overall height: 48.8 m, Call Sign: WPJC968,
Assigned Frequencies: 21855.0 MHz, 23055.0 MHz, 22005.0 MHz, 22155.0 MHz, 22155.0 MHz, 23205.0 MHz, 23205.0 MHz, 23355.0 MHz, 23505.0 MHz, 23505.0 MHz... (+5 more), Grant Date: 08/10/2012, Expiration Date: 10/28/2022, Cancellation Date: 03/24/2020, Registrant: Michigan Department Of Transportation, 8885 Ricks Road, Lansing, MI 48909, Phone: (517) 636-0635, Email:
- DET0208, 345 W. Ten Mile Rd. (Lat: 42.475833 Lon: -83.108056), Type: Pole, Structure height: 32 m, Call Sign: WQEF786, Licensee ID: L01728370,
Assigned Frequencies: 19620.0 MHz, 19360.0 MHz, 19680.0 MHz, Grant Date: 01/17/2006, Expiration Date: 01/17/2016, Cancellation Date: 09/05/2013, Certifier: Joseph M Sandri Jr., Registrant: Fibertower Network Services, Corp., Debtor-In-Possession, 1875 Eye Street, Nw, 5th Floor, Room 505, Washington, DC 20006, Phone: (202) 223-1028, Email:
- DET0208, 345 W. Ten Mile Rd. (Lat: 42.475833 Lon: -83.108056), Type: Pole, Structure height: 32 m, Call Sign: WQEG253,
Assigned Frequencies: 19620.0 MHz, 19360.0 MHz, Grant Date: 01/18/2006, Expiration Date: 02/01/2006, Cancellation Date: 04/08/2006, Certifier: Eric M Botto, Registrant: Fletcher, Heald & Hildreth, P.L.C., 1300 N. 17th St, Arlington, VA 22209, Phone: (703) 812-0400, Fax: (703) 812-0486, Email:
- DET0225, 24999 South Chrysler Dr. (Lat: 42.477139 Lon: -83.113222), Type: Tower, Structure height: 48.8 m, Call Sign: WQGE310, Licensee ID: L01728370,
Assigned Frequencies: 18120.0 MHz, Grant Date: 12/20/2006, Expiration Date: 12/20/2016, Cancellation Date: 09/06/2013, Certifier: Joseph M Sandri Jr., Registrant: Fibertower Network Services, Corp., Debtor-In-Possession, 1875 Eye Street, Nw, 5th Floor, Room 505, Washington, DC 20006, Phone: (202) 223-1028, Email:
FCC Registered Amateur Radio Licenses:
67 (See the full list of FCC Registered Amateur Radio Licenses in Hazel Park)FAA Registered Aircraft:
2- Aircraft: PIPER PA-38-112 (Category: Land, Seats: 2, Weight: Up to 12,499 Pounds, Speed: 183 mph), Engine: LYCOMING 0-320 SERIES (180 HP) (4 Cycle)
N-Number: 2539G, N2539G, N-2539G, Serial Number: 38-79A0550, Year manufactured: 1979, Airworthiness Date: 01/30/1979, Certificate Issue Date: 11/19/2012
Registrant (LLC): J & P Aviation LLC, 404 E Harry Ave, Hazel Park, MI 48030 - Aircraft: BENSEN-REED B-8M (Category: Land, Weight: Up to 12,499 Pounds, Speed: 45 mph), Engine: MCCULLOCH 4318A&E/0-100 (72 HP) (Reciprocating)
N-Number: 116R, N116R, N-116R, Serial Number: 1234526, Year manufactured: 1967, Certificate Issue Date: 09/18/1972
Registrant (Individual): Marshall H Rogers, 23116 Couzens, Hazel Park, MI 48030
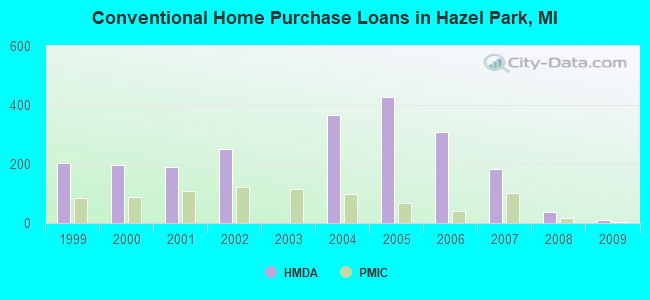
| Home Mortgage Disclosure Act Aggregated Statistics For Year 2009 (Based on 4 full tracts) | ||||||||||||
| A) FHA, FSA/RHS & VA Home Purchase Loans | B) Conventional Home Purchase Loans | C) Refinancings | D) Home Improvement Loans | F) Non-occupant Loans on < 5 Family Dwellings (A B C & D) | G) Loans On Manufactured Home Dwelling (A B C & D) | |||||||
|---|---|---|---|---|---|---|---|---|---|---|---|---|
| Number | Average Value | Number | Average Value | Number | Average Value | Number | Average Value | Number | Average Value | Number | Average Value | |
| LOANS ORIGINATED | 61 | $59,590 | 11 | $45,273 | 79 | $80,063 | 13 | $16,000 | 12 | $36,417 | 0 | $0 |
| APPLICATIONS APPROVED, NOT ACCEPTED | 7 | $58,286 | 2 | $33,500 | 13 | $89,923 | 3 | $12,000 | 2 | $33,500 | 0 | $0 |
| APPLICATIONS DENIED | 29 | $51,276 | 10 | $43,100 | 47 | $63,064 | 33 | $17,606 | 6 | $33,667 | 3 | $44,333 |
| APPLICATIONS WITHDRAWN | 12 | $59,333 | 2 | $15,500 | 19 | $78,684 | 3 | $82,000 | 3 | $42,667 | 1 | $54,000 |
| FILES CLOSED FOR INCOMPLETENESS | 0 | $0 | 0 | $0 | 11 | $77,091 | 2 | $13,000 | 3 | $43,667 | 0 | $0 |
Detailed HMDA statistics for the following Tracts: 1750.00 , 1751.00, 1752.00, 1753.00
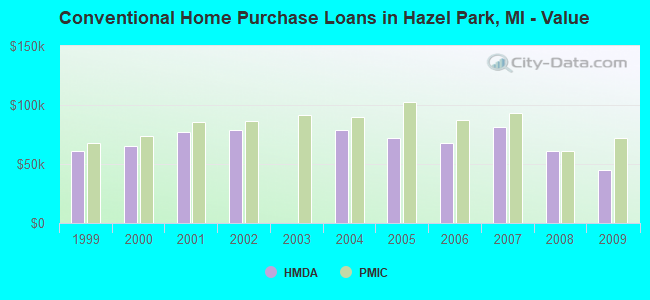
| Private Mortgage Insurance Companies Aggregated Statistics For Year 2009 (Based on 3 full tracts) | ||||||
| A) Conventional Home Purchase Loans | B) Refinancings | C) Non-occupant Loans on < 5 Family Dwellings (A & B) | ||||
|---|---|---|---|---|---|---|
| Number | Average Value | Number | Average Value | Number | Average Value | |
| LOANS ORIGINATED | 2 | $72,000 | 1 | $48,000 | 0 | $0 |
| APPLICATIONS APPROVED, NOT ACCEPTED | 1 | $85,000 | 2 | $73,500 | 1 | $76,000 |
| APPLICATIONS DENIED | 0 | $0 | 0 | $0 | 0 | $0 |
| APPLICATIONS WITHDRAWN | 0 | $0 | 0 | $0 | 0 | $0 |
| FILES CLOSED FOR INCOMPLETENESS | 0 | $0 | 0 | $0 | 0 | $0 |
Detailed PMIC statistics for the following Tracts: 1750.00 , 1751.00, 1752.00, 1753.00
2002 - 2018 National Fire Incident Reporting System (NFIRS) incidents
- Fire incident types reported to NFIRS in Hazel Park, MI
- 61158.2%Structure Fires
- 24823.6%Mobile Property/Vehicle Fires
- 17817.0%Outside Fires
- 121.1%Other
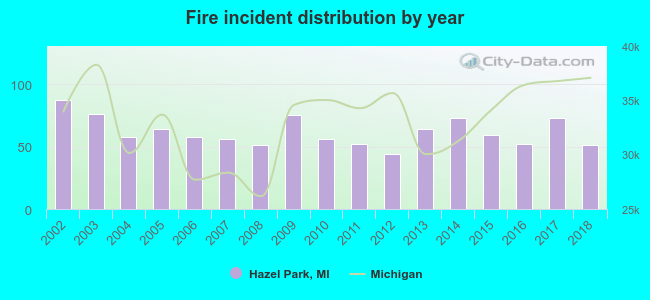 According to the data from the years 2002 - 2018 the average number of fire incidents per year is 62. The highest number of fires - 87 took place in 2002, and the least - 44 in 2012. The data has a dropping trend.
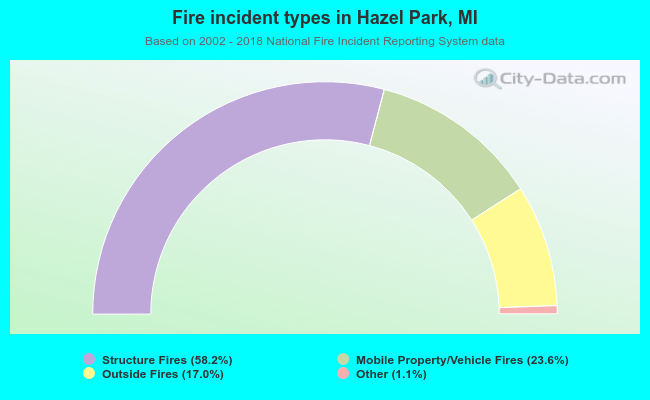 When looking into fire subcategories, the most incidents belonged to: Structure Fires (58.2%), and Mobile Property/Vehicle Fires (23.6%).
| Most common first names in Hazel Park, MI among deceased individuals | ||
| Name | Count | Lived (average) |
|---|---|---|
| John | 189 | 71.7 years |
| Mary | 171 | 75.1 years |
| James | 139 | 68.7 years |
| William | 132 | 71.9 years |
| Joseph | 120 | 72.9 years |
| Robert | 87 | 68.8 years |
| George | 81 | 71.8 years |
| Helen | 79 | 76.6 years |
| Charles | 73 | 72.6 years |
| Frank | 71 | 73.0 years |
| Most common last names in Hazel Park, MI among deceased individuals | ||
| Last name | Count | Lived (average) |
|---|---|---|
| Smith | 57 | 73.7 years |
| Johnson | 35 | 73.3 years |
| Brown | 30 | 72.3 years |
| Miller | 26 | 77.1 years |
| Thomas | 24 | 73.8 years |
| Clark | 24 | 75.9 years |
| Taylor | 23 | 73.7 years |
| Williams | 22 | 70.7 years |
| Davis | 22 | 72.2 years |
| White | 22 | 76.2 years |
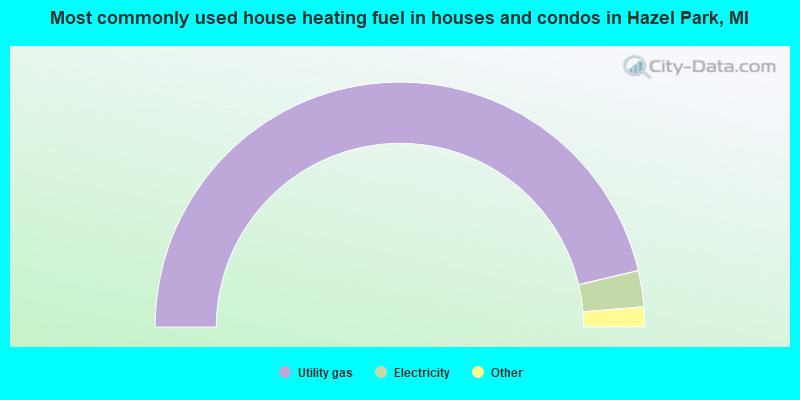
- 92.6%Utility gas
- 4.8%Electricity
- 2.1%Bottled, tank, or LP gas
- 0.2%Wood
- 0.2%No fuel used
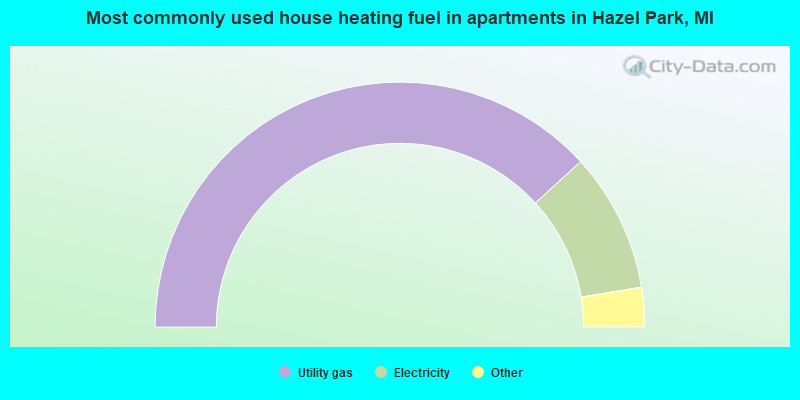
- 76.4%Utility gas
- 18.4%Electricity
- 3.2%Bottled, tank, or LP gas
- 0.8%Fuel oil, kerosene, etc.
- 0.8%No fuel used
- 0.4%Other fuel
Hazel Park compared to Michigan state average:
- Median house value below state average.
- Black race population percentage below state average.
- Median age below state average.
- Length of stay since moving in above state average.
Hazel Park on our top lists:
- #21 on the list of "Top 101 cities with the most residents born in Iraq (population 500+)"
- #62 on the list of "Top 101 cities with the most residents born in Sierra Leone (population 500+)"
- #71 (48030) on the list of "Top 101 zip codes with the largest percentage of Scottish first ancestries (pop 5,000+)"
- #6 on the list of "Top 101 counties with the highest percentage of residents that visited a dentist within the past year"
- #12 on the list of "Top 101 counties with the most Orthodox congregations"
- #14 on the list of "Top 101 counties with the most Orthodox adherents"
- #38 on the list of "Top 101 counties with the most Mainline Protestant adherents"
- #39 on the list of "Top 101 counties with the most Catholic adherents"
State forum archive:

|
|
Total of 46 patent applications in 2008-2024.