Girard, Ohio Submit your own pictures of this city and show them to the world
OSM Map
General Map
Google Map
MSN Map
OSM Map
General Map
Google Map
MSN Map
OSM Map
General Map
Google Map
MSN Map
OSM Map
General Map
Google Map
MSN Map
Please wait while loading the map...
Population in 2022: 9,496 (100% urban, 0% rural). Population change since 2000: -12.9%Males: 4,611 Females: 4,885
March 2022 cost of living index in Girard: 88.8 (less than average, U.S. average is 100) Percentage of residents living in poverty in 2022: 18.1%for White Non-Hispanic residents , 17.7% for Black residents , 38.8% for Hispanic or Latino residents , 15.2% for two or more races residents )
Profiles of local businesses
Business Search - 14 Million verified businesses
Data:
Median household income ($)
Median household income (% change since 2000)
Household income diversity
Ratio of average income to average house value (%)
Ratio of average income to average rent
Median household income ($) - White
Median household income ($) - Black or African American
Median household income ($) - Asian
Median household income ($) - Hispanic or Latino
Median household income ($) - American Indian and Alaska Native
Median household income ($) - Multirace
Median household income ($) - Other Race
Median household income for houses/condos with a mortgage ($)
Median household income for apartments without a mortgage ($)
Races - White alone (%)
Races - White alone (% change since 2000)
Races - Black alone (%)
Races - Black alone (% change since 2000)
Races - American Indian alone (%)
Races - American Indian alone (% change since 2000)
Races - Asian alone (%)
Races - Asian alone (% change since 2000)
Races - Hispanic (%)
Races - Hispanic (% change since 2000)
Races - Native Hawaiian and Other Pacific Islander alone (%)
Races - Native Hawaiian and Other Pacific Islander alone (% change since 2000)
Races - Two or more races (%)
Races - Two or more races (% change since 2000)
Races - Other race alone (%)
Races - Other race alone (% change since 2000)
Racial diversity
Unemployment (%)
Unemployment (% change since 2000)
Unemployment (%) - White
Unemployment (%) - Black or African American
Unemployment (%) - Asian
Unemployment (%) - Hispanic or Latino
Unemployment (%) - American Indian and Alaska Native
Unemployment (%) - Multirace
Unemployment (%) - Other Race
Population density (people per square mile)
Population - Males (%)
Population - Females (%)
Population - Males (%) - White
Population - Males (%) - Black or African American
Population - Males (%) - Asian
Population - Males (%) - Hispanic or Latino
Population - Males (%) - American Indian and Alaska Native
Population - Males (%) - Multirace
Population - Males (%) - Other Race
Population - Females (%) - White
Population - Females (%) - Black or African American
Population - Females (%) - Asian
Population - Females (%) - Hispanic or Latino
Population - Females (%) - American Indian and Alaska Native
Population - Females (%) - Multirace
Population - Females (%) - Other Race
Coronavirus confirmed cases (May 31, 2024)
Deaths caused by coronavirus (May 31, 2024)
Coronavirus confirmed cases (per 100k population) (May 31, 2024)
Deaths caused by coronavirus (per 100k population) (May 31, 2024)
Daily increase in number of cases (May 31, 2024)
Weekly increase in number of cases (May 31, 2024)
Cases doubled (in days) (May 31, 2024)
Hospitalized patients (Apr 18, 2022)
Negative test results (Apr 18, 2022)
Total test results (Apr 18, 2022)
COVID Vaccine doses distributed (per 100k population) (Sep 19, 2023)
COVID Vaccine doses administered (per 100k population) (Sep 19, 2023)
COVID Vaccine doses distributed (Sep 19, 2023)
COVID Vaccine doses administered (Sep 19, 2023)
Likely homosexual households (%)
Likely homosexual households (% change since 2000)
Likely homosexual households - Lesbian couples (%)
Likely homosexual households - Lesbian couples (% change since 2000)
Likely homosexual households - Gay men (%)
Likely homosexual households - Gay men (% change since 2000)
Cost of living index
Median gross rent ($)
Median contract rent ($)
Median monthly housing costs ($)
Median house or condo value ($)
Median house or condo value ($ change since 2000)
Mean house or condo value by units in structure - 1, detached ($)
Mean house or condo value by units in structure - 1, attached ($)
Mean house or condo value by units in structure - 2 ($)
Mean house or condo value by units in structure by units in structure - 3 or 4 ($)
Mean house or condo value by units in structure - 5 or more ($)
Mean house or condo value by units in structure - Boat, RV, van, etc. ($)
Mean house or condo value by units in structure - Mobile home ($)
Median house or condo value ($) - White
Median house or condo value ($) - Black or African American
Median house or condo value ($) - Asian
Median house or condo value ($) - Hispanic or Latino
Median house or condo value ($) - American Indian and Alaska Native
Median house or condo value ($) - Multirace
Median house or condo value ($) - Other Race
Median resident age
Resident age diversity
Median resident age - Males
Median resident age - Females
Median resident age - White
Median resident age - Black or African American
Median resident age - Asian
Median resident age - Hispanic or Latino
Median resident age - American Indian and Alaska Native
Median resident age - Multirace
Median resident age - Other Race
Median resident age - Males - White
Median resident age - Males - Black or African American
Median resident age - Males - Asian
Median resident age - Males - Hispanic or Latino
Median resident age - Males - American Indian and Alaska Native
Median resident age - Males - Multirace
Median resident age - Males - Other Race
Median resident age - Females - White
Median resident age - Females - Black or African American
Median resident age - Females - Asian
Median resident age - Females - Hispanic or Latino
Median resident age - Females - American Indian and Alaska Native
Median resident age - Females - Multirace
Median resident age - Females - Other Race
Commute - mean travel time to work (minutes)
Travel time to work - Less than 5 minutes (%)
Travel time to work - Less than 5 minutes (% change since 2000)
Travel time to work - 5 to 9 minutes (%)
Travel time to work - 5 to 9 minutes (% change since 2000)
Travel time to work - 10 to 19 minutes (%)
Travel time to work - 10 to 19 minutes (% change since 2000)
Travel time to work - 20 to 29 minutes (%)
Travel time to work - 20 to 29 minutes (% change since 2000)
Travel time to work - 30 to 39 minutes (%)
Travel time to work - 30 to 39 minutes (% change since 2000)
Travel time to work - 40 to 59 minutes (%)
Travel time to work - 40 to 59 minutes (% change since 2000)
Travel time to work - 60 to 89 minutes (%)
Travel time to work - 60 to 89 minutes (% change since 2000)
Travel time to work - 90 or more minutes (%)
Travel time to work - 90 or more minutes (% change since 2000)
Marital status - Never married (%)
Marital status - Now married (%)
Marital status - Separated (%)
Marital status - Widowed (%)
Marital status - Divorced (%)
Median family income ($)
Median family income (% change since 2000)
Median non-family income ($)
Median non-family income (% change since 2000)
Median per capita income ($)
Median per capita income (% change since 2000)
Median family income ($) - White
Median family income ($) - Black or African American
Median family income ($) - Asian
Median family income ($) - Hispanic or Latino
Median family income ($) - American Indian and Alaska Native
Median family income ($) - Multirace
Median family income ($) - Other Race
Median year house/condo built
Median year apartment built
Year house built - Built 2005 or later (%)
Year house built - Built 2000 to 2004 (%)
Year house built - Built 1990 to 1999 (%)
Year house built - Built 1980 to 1989 (%)
Year house built - Built 1970 to 1979 (%)
Year house built - Built 1960 to 1969 (%)
Year house built - Built 1950 to 1959 (%)
Year house built - Built 1940 to 1949 (%)
Year house built - Built 1939 or earlier (%)
Average household size
Household density (households per square mile)
Average household size - White
Average household size - Black or African American
Average household size - Asian
Average household size - Hispanic or Latino
Average household size - American Indian and Alaska Native
Average household size - Multirace
Average household size - Other Race
Occupied housing units (%)
Vacant housing units (%)
Owner occupied housing units (%)
Renter occupied housing units (%)
Vacancy status - For rent (%)
Vacancy status - For sale only (%)
Vacancy status - Rented or sold, not occupied (%)
Vacancy status - For seasonal, recreational, or occasional use (%)
Vacancy status - For migrant workers (%)
Vacancy status - Other vacant (%)
Residents with income below the poverty level (%)
Residents with income below 50% of the poverty level (%)
Children below poverty level (%)
Poor families by family type - Married-couple family (%)
Poor families by family type - Male, no wife present (%)
Poor families by family type - Female, no husband present (%)
Poverty status for native-born residents (%)
Poverty status for foreign-born residents (%)
Poverty among high school graduates not in families (%)
Poverty among people who did not graduate high school not in families (%)
Residents with income below the poverty level (%) - White
Residents with income below the poverty level (%) - Black or African American
Residents with income below the poverty level (%) - Asian
Residents with income below the poverty level (%) - Hispanic or Latino
Residents with income below the poverty level (%) - American Indian and Alaska Native
Residents with income below the poverty level (%) - Multirace
Residents with income below the poverty level (%) - Other Race
Air pollution - Air Quality Index (AQI)
Air pollution - CO
Air pollution - NO2
Air pollution - SO2
Air pollution - Ozone
Air pollution - PM10
Air pollution - PM25
Air pollution - Pb
Crime - Murders per 100,000 population
Crime - Rapes per 100,000 population
Crime - Robberies per 100,000 population
Crime - Assaults per 100,000 population
Crime - Burglaries per 100,000 population
Crime - Thefts per 100,000 population
Crime - Auto thefts per 100,000 population
Crime - Arson per 100,000 population
Crime - City-data.com crime index
Crime - Violent crime index
Crime - Property crime index
Crime - Murders per 100,000 population (5 year average)
Crime - Rapes per 100,000 population (5 year average)
Crime - Robberies per 100,000 population (5 year average)
Crime - Assaults per 100,000 population (5 year average)
Crime - Burglaries per 100,000 population (5 year average)
Crime - Thefts per 100,000 population (5 year average)
Crime - Auto thefts per 100,000 population (5 year average)
Crime - Arson per 100,000 population (5 year average)
Crime - City-data.com crime index (5 year average)
Crime - Violent crime index (5 year average)
Crime - Property crime index (5 year average)
1996 Presidential Elections Results (%) - Democratic Party (Clinton)
1996 Presidential Elections Results (%) - Republican Party (Dole)
1996 Presidential Elections Results (%) - Other
2000 Presidential Elections Results (%) - Democratic Party (Gore)
2000 Presidential Elections Results (%) - Republican Party (Bush)
2000 Presidential Elections Results (%) - Other
2004 Presidential Elections Results (%) - Democratic Party (Kerry)
2004 Presidential Elections Results (%) - Republican Party (Bush)
2004 Presidential Elections Results (%) - Other
2008 Presidential Elections Results (%) - Democratic Party (Obama)
2008 Presidential Elections Results (%) - Republican Party (McCain)
2008 Presidential Elections Results (%) - Other
2012 Presidential Elections Results (%) - Democratic Party (Obama)
2012 Presidential Elections Results (%) - Republican Party (Romney)
2012 Presidential Elections Results (%) - Other
2016 Presidential Elections Results (%) - Democratic Party (Clinton)
2016 Presidential Elections Results (%) - Republican Party (Trump)
2016 Presidential Elections Results (%) - Other
2020 Presidential Elections Results (%) - Democratic Party (Biden)
2020 Presidential Elections Results (%) - Republican Party (Trump)
2020 Presidential Elections Results (%) - Other
Ancestries Reported - Arab (%)
Ancestries Reported - Czech (%)
Ancestries Reported - Danish (%)
Ancestries Reported - Dutch (%)
Ancestries Reported - English (%)
Ancestries Reported - French (%)
Ancestries Reported - French Canadian (%)
Ancestries Reported - German (%)
Ancestries Reported - Greek (%)
Ancestries Reported - Hungarian (%)
Ancestries Reported - Irish (%)
Ancestries Reported - Italian (%)
Ancestries Reported - Lithuanian (%)
Ancestries Reported - Norwegian (%)
Ancestries Reported - Polish (%)
Ancestries Reported - Portuguese (%)
Ancestries Reported - Russian (%)
Ancestries Reported - Scotch-Irish (%)
Ancestries Reported - Scottish (%)
Ancestries Reported - Slovak (%)
Ancestries Reported - Subsaharan African (%)
Ancestries Reported - Swedish (%)
Ancestries Reported - Swiss (%)
Ancestries Reported - Ukrainian (%)
Ancestries Reported - United States (%)
Ancestries Reported - Welsh (%)
Ancestries Reported - West Indian (%)
Ancestries Reported - Other (%)
Educational Attainment - No schooling completed (%)
Educational Attainment - Less than high school (%)
Educational Attainment - High school or equivalent (%)
Educational Attainment - Less than 1 year of college (%)
Educational Attainment - 1 or more years of college (%)
Educational Attainment - Associate degree (%)
Educational Attainment - Bachelor's degree (%)
Educational Attainment - Master's degree (%)
Educational Attainment - Professional school degree (%)
Educational Attainment - Doctorate degree (%)
School Enrollment - Nursery, preschool (%)
School Enrollment - Kindergarten (%)
School Enrollment - Grade 1 to 4 (%)
School Enrollment - Grade 5 to 8 (%)
School Enrollment - Grade 9 to 12 (%)
School Enrollment - College undergrad (%)
School Enrollment - Graduate or professional (%)
School Enrollment - Not enrolled in school (%)
School enrollment - Public schools (%)
School enrollment - Private schools (%)
School enrollment - Not enrolled (%)
Median number of rooms in houses and condos
Median number of rooms in apartments
Housing units lacking complete plumbing facilities (%)
Housing units lacking complete kitchen facilities (%)
Density of houses
Urban houses (%)
Rural houses (%)
Households with people 60 years and over (%)
Households with people 65 years and over (%)
Households with people 75 years and over (%)
Households with one or more nonrelatives (%)
Households with no nonrelatives (%)
Population in households (%)
Family households (%)
Nonfamily households (%)
Population in families (%)
Family households with own children (%)
Median number of bedrooms in owner occupied houses
Mean number of bedrooms in owner occupied houses
Median number of bedrooms in renter occupied houses
Mean number of bedrooms in renter occupied houses
Median number of vehichles in owner occupied houses
Mean number of vehichles in owner occupied houses
Median number of vehichles in renter occupied houses
Mean number of vehichles in renter occupied houses
Mortgage status - with mortgage (%)
Mortgage status - with second mortgage (%)
Mortgage status - with home equity loan (%)
Mortgage status - with both second mortgage and home equity loan (%)
Mortgage status - without a mortgage (%)
Average family size
Average family size - White
Average family size - Black or African American
Average family size - Asian
Average family size - Hispanic or Latino
Average family size - American Indian and Alaska Native
Average family size - Multirace
Average family size - Other Race
Geographical mobility - Same house 1 year ago (%)
Geographical mobility - Moved within same county (%)
Geographical mobility - Moved from different county within same state (%)
Geographical mobility - Moved from different state (%)
Geographical mobility - Moved from abroad (%)
Place of birth - Born in state of residence (%)
Place of birth - Born in other state (%)
Place of birth - Native, outside of US (%)
Place of birth - Foreign born (%)
Housing units in structures - 1, detached (%)
Housing units in structures - 1, attached (%)
Housing units in structures - 2 (%)
Housing units in structures - 3 or 4 (%)
Housing units in structures - 5 to 9 (%)
Housing units in structures - 10 to 19 (%)
Housing units in structures - 20 to 49 (%)
Housing units in structures - 50 or more (%)
Housing units in structures - Mobile home (%)
Housing units in structures - Boat, RV, van, etc. (%)
House/condo owner moved in on average (years ago)
Renter moved in on average (years ago)
Year householder moved into unit - Moved in 1999 to March 2000 (%)
Year householder moved into unit - Moved in 1995 to 1998 (%)
Year householder moved into unit - Moved in 1990 to 1994 (%)
Year householder moved into unit - Moved in 1980 to 1989 (%)
Year householder moved into unit - Moved in 1970 to 1979 (%)
Year householder moved into unit - Moved in 1969 or earlier (%)
Means of transportation to work - Drove car alone (%)
Means of transportation to work - Carpooled (%)
Means of transportation to work - Public transportation (%)
Means of transportation to work - Bus or trolley bus (%)
Means of transportation to work - Streetcar or trolley car (%)
Means of transportation to work - Subway or elevated (%)
Means of transportation to work - Railroad (%)
Means of transportation to work - Ferryboat (%)
Means of transportation to work - Taxicab (%)
Means of transportation to work - Motorcycle (%)
Means of transportation to work - Bicycle (%)
Means of transportation to work - Walked (%)
Means of transportation to work - Other means (%)
Working at home (%)
Industry diversity
Most Common Industries - Agriculture, forestry, fishing and hunting, and mining (%)
Most Common Industries - Agriculture, forestry, fishing and hunting (%)
Most Common Industries - Mining, quarrying, and oil and gas extraction (%)
Most Common Industries - Construction (%)
Most Common Industries - Manufacturing (%)
Most Common Industries - Wholesale trade (%)
Most Common Industries - Retail trade (%)
Most Common Industries - Transportation and warehousing, and utilities (%)
Most Common Industries - Transportation and warehousing (%)
Most Common Industries - Utilities (%)
Most Common Industries - Information (%)
Most Common Industries - Finance and insurance, and real estate and rental and leasing (%)
Most Common Industries - Finance and insurance (%)
Most Common Industries - Real estate and rental and leasing (%)
Most Common Industries - Professional, scientific, and management, and administrative and waste management services (%)
Most Common Industries - Professional, scientific, and technical services (%)
Most Common Industries - Management of companies and enterprises (%)
Most Common Industries - Administrative and support and waste management services (%)
Most Common Industries - Educational services, and health care and social assistance (%)
Most Common Industries - Educational services (%)
Most Common Industries - Health care and social assistance (%)
Most Common Industries - Arts, entertainment, and recreation, and accommodation and food services (%)
Most Common Industries - Arts, entertainment, and recreation (%)
Most Common Industries - Accommodation and food services (%)
Most Common Industries - Other services, except public administration (%)
Most Common Industries - Public administration (%)
Occupation diversity
Most Common Occupations - Management, business, science, and arts occupations (%)
Most Common Occupations - Management, business, and financial occupations (%)
Most Common Occupations - Management occupations (%)
Most Common Occupations - Business and financial operations occupations (%)
Most Common Occupations - Computer, engineering, and science occupations (%)
Most Common Occupations - Computer and mathematical occupations (%)
Most Common Occupations - Architecture and engineering occupations (%)
Most Common Occupations - Life, physical, and social science occupations (%)
Most Common Occupations - Education, legal, community service, arts, and media occupations (%)
Most Common Occupations - Community and social service occupations (%)
Most Common Occupations - Legal occupations (%)
Most Common Occupations - Education, training, and library occupations (%)
Most Common Occupations - Arts, design, entertainment, sports, and media occupations (%)
Most Common Occupations - Healthcare practitioners and technical occupations (%)
Most Common Occupations - Health diagnosing and treating practitioners and other technical occupations (%)
Most Common Occupations - Health technologists and technicians (%)
Most Common Occupations - Service occupations (%)
Most Common Occupations - Healthcare support occupations (%)
Most Common Occupations - Protective service occupations (%)
Most Common Occupations - Fire fighting and prevention, and other protective service workers including supervisors (%)
Most Common Occupations - Law enforcement workers including supervisors (%)
Most Common Occupations - Food preparation and serving related occupations (%)
Most Common Occupations - Building and grounds cleaning and maintenance occupations (%)
Most Common Occupations - Personal care and service occupations (%)
Most Common Occupations - Sales and office occupations (%)
Most Common Occupations - Sales and related occupations (%)
Most Common Occupations - Office and administrative support occupations (%)
Most Common Occupations - Natural resources, construction, and maintenance occupations (%)
Most Common Occupations - Farming, fishing, and forestry occupations (%)
Most Common Occupations - Construction and extraction occupations (%)
Most Common Occupations - Installation, maintenance, and repair occupations (%)
Most Common Occupations - Production, transportation, and material moving occupations (%)
Most Common Occupations - Production occupations (%)
Most Common Occupations - Transportation occupations (%)
Most Common Occupations - Material moving occupations (%)
People in Group quarters - Institutionalized population (%)
People in Group quarters - Correctional institutions (%)
People in Group quarters - Federal prisons and detention centers (%)
People in Group quarters - Halfway houses (%)
People in Group quarters - Local jails and other confinement facilities (including police lockups) (%)
People in Group quarters - Military disciplinary barracks (%)
People in Group quarters - State prisons (%)
People in Group quarters - Other types of correctional institutions (%)
People in Group quarters - Nursing homes (%)
People in Group quarters - Hospitals/wards, hospices, and schools for the handicapped (%)
People in Group quarters - Hospitals/wards and hospices for chronically ill (%)
People in Group quarters - Hospices or homes for chronically ill (%)
People in Group quarters - Military hospitals or wards for chronically ill (%)
People in Group quarters - Other hospitals or wards for chronically ill (%)
People in Group quarters - Hospitals or wards for drug/alcohol abuse (%)
People in Group quarters - Mental (Psychiatric) hospitals or wards (%)
People in Group quarters - Schools, hospitals, or wards for the mentally retarded (%)
People in Group quarters - Schools, hospitals, or wards for the physically handicapped (%)
People in Group quarters - Institutions for the deaf (%)
People in Group quarters - Institutions for the blind (%)
People in Group quarters - Orthopedic wards and institutions for the physically handicapped (%)
People in Group quarters - Wards in general hospitals for patients who have no usual home elsewhere (%)
People in Group quarters - Wards in military hospitals for patients who have no usual home elsewhere (%)
People in Group quarters - Juvenile institutions (%)
People in Group quarters - Long-term care (%)
People in Group quarters - Homes for abused, dependent, and neglected children (%)
People in Group quarters - Residential treatment centers for emotionally disturbed children (%)
People in Group quarters - Training schools for juvenile delinquents (%)
People in Group quarters - Short-term care, detention or diagnostic centers for delinquent children (%)
People in Group quarters - Type of juvenile institution unknown (%)
People in Group quarters - Noninstitutionalized population (%)
People in Group quarters - College dormitories (includes college quarters off campus) (%)
People in Group quarters - Military quarters (%)
People in Group quarters - On base (%)
People in Group quarters - Barracks, unaccompanied personnel housing (UPH), (Enlisted/Officer), ;and similar group living quarters for military personnel (%)
People in Group quarters - Transient quarters for temporary residents (%)
People in Group quarters - Military ships (%)
People in Group quarters - Group homes (%)
People in Group quarters - Homes or halfway houses for drug/alcohol abuse (%)
People in Group quarters - Homes for the mentally ill (%)
People in Group quarters - Homes for the mentally retarded (%)
People in Group quarters - Homes for the physically handicapped (%)
People in Group quarters - Other group homes (%)
People in Group quarters - Religious group quarters (%)
People in Group quarters - Dormitories (%)
People in Group quarters - Agriculture workers' dormitories on farms (%)
People in Group quarters - Job Corps and vocational training facilities (%)
People in Group quarters - Other workers' dormitories (%)
People in Group quarters - Crews of maritime vessels (%)
People in Group quarters - Other nonhousehold living situations (%)
People in Group quarters - Other noninstitutional group quarters (%)
Residents speaking English at home (%)
Residents speaking English at home - Born in the United States (%)
Residents speaking English at home - Native, born elsewhere (%)
Residents speaking English at home - Foreign born (%)
Residents speaking Spanish at home (%)
Residents speaking Spanish at home - Born in the United States (%)
Residents speaking Spanish at home - Native, born elsewhere (%)
Residents speaking Spanish at home - Foreign born (%)
Residents speaking other language at home (%)
Residents speaking other language at home - Born in the United States (%)
Residents speaking other language at home - Native, born elsewhere (%)
Residents speaking other language at home - Foreign born (%)
Class of Workers - Employee of private company (%)
Class of Workers - Self-employed in own incorporated business (%)
Class of Workers - Private not-for-profit wage and salary workers (%)
Class of Workers - Local government workers (%)
Class of Workers - State government workers (%)
Class of Workers - Federal government workers (%)
Class of Workers - Self-employed workers in own not incorporated business and Unpaid family workers (%)
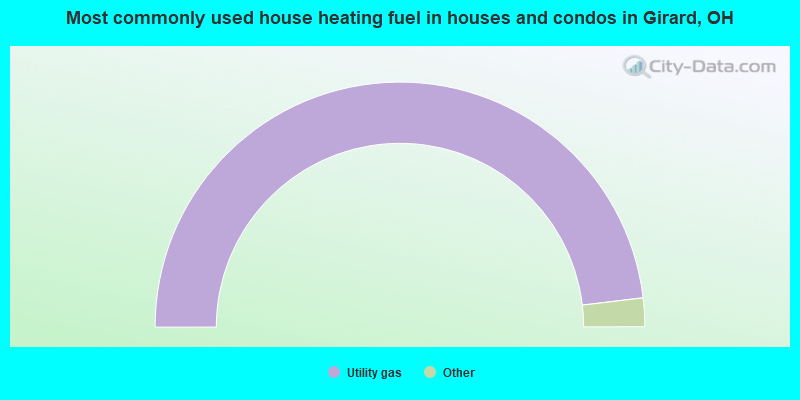
House heating fuel used in houses and condos - Utility gas (%)
House heating fuel used in houses and condos - Bottled, tank, or LP gas (%)
House heating fuel used in houses and condos - Electricity (%)
House heating fuel used in houses and condos - Fuel oil, kerosene, etc. (%)
House heating fuel used in houses and condos - Coal or coke (%)
House heating fuel used in houses and condos - Wood (%)
House heating fuel used in houses and condos - Solar energy (%)
House heating fuel used in houses and condos - Other fuel (%)
House heating fuel used in houses and condos - No fuel used (%)
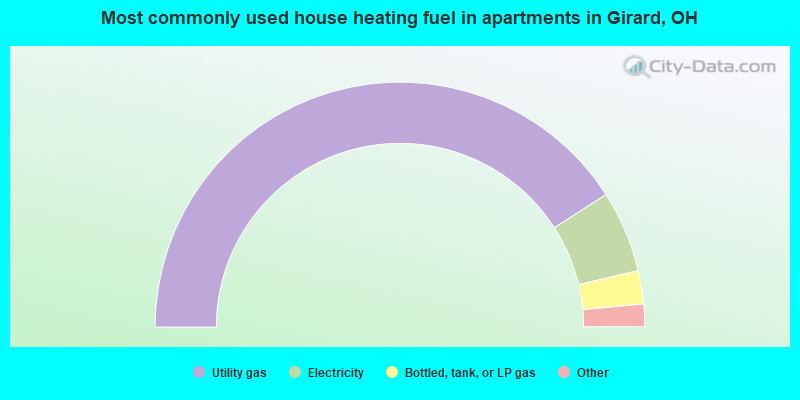
House heating fuel used in apartments - Utility gas (%)
House heating fuel used in apartments - Bottled, tank, or LP gas (%)
House heating fuel used in apartments - Electricity (%)
House heating fuel used in apartments - Fuel oil, kerosene, etc. (%)
House heating fuel used in apartments - Coal or coke (%)
House heating fuel used in apartments - Wood (%)
House heating fuel used in apartments - Solar energy (%)
House heating fuel used in apartments - Other fuel (%)
House heating fuel used in apartments - No fuel used (%)
Armed forces status - In Armed Forces (%)
Armed forces status - Civilian (%)
Armed forces status - Civilian - Veteran (%)
Armed forces status - Civilian - Nonveteran (%)
Fatal accidents locations in years 2005-2021
Fatal accidents locations in 2005
Fatal accidents locations in 2006
Fatal accidents locations in 2007
Fatal accidents locations in 2008
Fatal accidents locations in 2009
Fatal accidents locations in 2010
Fatal accidents locations in 2011
Fatal accidents locations in 2012
Fatal accidents locations in 2013
Fatal accidents locations in 2014
Fatal accidents locations in 2015
Fatal accidents locations in 2016
Fatal accidents locations in 2017
Fatal accidents locations in 2018
Fatal accidents locations in 2019
Fatal accidents locations in 2020
Fatal accidents locations in 2021
Alcohol use - People drinking some alcohol every month (%)
Alcohol use - People not drinking at all (%)
Alcohol use - Average days/month drinking alcohol
Alcohol use - Average drinks/week
Alcohol use - Average days/year people drink much
Audiometry - Average condition of hearing (%)
Audiometry - People that can hear a whisper from across a quiet room (%)
Audiometry - People that can hear normal voice from across a quiet room (%)
Audiometry - Ears ringing, roaring, buzzing (%)
Audiometry - Had a job exposure to loud noise (%)
Audiometry - Had off-work exposure to loud noise (%)
Blood Pressure & Cholesterol - Has high blood pressure (%)
Blood Pressure & Cholesterol - Checking blood pressure at home (%)
Blood Pressure & Cholesterol - Frequently checking blood cholesterol (%)
Blood Pressure & Cholesterol - Has high cholesterol level (%)
Consumer Behavior - Money monthly spent on food at supermarket/grocery store
Consumer Behavior - Money monthly spent on food at other stores
Consumer Behavior - Money monthly spent on eating out
Consumer Behavior - Money monthly spent on carryout/delivered foods
Consumer Behavior - Income spent on food at supermarket/grocery store (%)
Consumer Behavior - Income spent on food at other stores (%)
Consumer Behavior - Income spent on eating out (%)
Consumer Behavior - Income spent on carryout/delivered foods (%)
Current Health Status - General health condition (%)
Current Health Status - Blood donors (%)
Current Health Status - Has blood ever tested for HIV virus (%)
Current Health Status - Left-handed people (%)
Dermatology - People using sunscreen (%)
Diabetes - Diabetics (%)
Diabetes - Had a blood test for high blood sugar (%)
Diabetes - People taking insulin (%)
Diet Behavior & Nutrition - Diet health (%)
Diet Behavior & Nutrition - Milk product consumption (# of products/month)
Diet Behavior & Nutrition - Meals not home prepared (#/week)
Diet Behavior & Nutrition - Meals from fast food or pizza place (#/week)
Diet Behavior & Nutrition - Ready-to-eat foods (#/month)
Diet Behavior & Nutrition - Frozen meals/pizza (#/month)
Drug Use - People that ever used marijuana or hashish (%)
Drug Use - Ever used hard drugs (%)
Drug Use - Ever used any form of cocaine (%)
Drug Use - Ever used heroin (%)
Drug Use - Ever used methamphetamine (%)
Health Insurance - People covered by health insurance (%)
Kidney Conditions-Urology - Avg. # of times urinating at night
Medical Conditions - People with asthma (%)
Medical Conditions - People with anemia (%)
Medical Conditions - People with psoriasis (%)
Medical Conditions - People with overweight (%)
Medical Conditions - Elderly people having difficulties in thinking or remembering (%)
Medical Conditions - People who ever received blood transfusion (%)
Medical Conditions - People having trouble seeing even with glass/contacts (%)
Medical Conditions - People with arthritis (%)
Medical Conditions - People with gout (%)
Medical Conditions - People with congestive heart failure (%)
Medical Conditions - People with coronary heart disease (%)
Medical Conditions - People with angina pectoris (%)
Medical Conditions - People who ever had heart attack (%)
Medical Conditions - People who ever had stroke (%)
Medical Conditions - People with emphysema (%)
Medical Conditions - People with thyroid problem (%)
Medical Conditions - People with chronic bronchitis (%)
Medical Conditions - People with any liver condition (%)
Medical Conditions - People who ever had cancer or malignancy (%)
Mental Health - People who have little interest in doing things (%)
Mental Health - People feeling down, depressed, or hopeless (%)
Mental Health - People who have trouble sleeping or sleeping too much (%)
Mental Health - People feeling tired or having little energy (%)
Mental Health - People with poor appetite or overeating (%)
Mental Health - People feeling bad about themself (%)
Mental Health - People who have trouble concentrating on things (%)
Mental Health - People moving or speaking slowly or too fast (%)
Mental Health - People having thoughts they would be better off dead (%)
Oral Health - Average years since last visit a dentist
Oral Health - People embarrassed because of mouth (%)
Oral Health - People with gum disease (%)
Oral Health - General health of teeth and gums (%)
Oral Health - Average days a week using dental floss/device
Oral Health - Average days a week using mouthwash for dental problem
Oral Health - Average number of teeth
Pesticide Use - Households using pesticides to control insects (%)
Pesticide Use - Households using pesticides to kill weeds (%)
Physical Activity - People doing vigorous-intensity work activities (%)
Physical Activity - People doing moderate-intensity work activities (%)
Physical Activity - People walking or bicycling (%)
Physical Activity - People doing vigorous-intensity recreational activities (%)
Physical Activity - People doing moderate-intensity recreational activities (%)
Physical Activity - Average hours a day doing sedentary activities
Physical Activity - Average hours a day watching TV or videos
Physical Activity - Average hours a day using computer
Physical Functioning - People having limitations keeping them from working (%)
Physical Functioning - People limited in amount of work they can do (%)
Physical Functioning - People that need special equipment to walk (%)
Physical Functioning - People experiencing confusion/memory problems (%)
Physical Functioning - People requiring special healthcare equipment (%)
Prescription Medications - Average number of prescription medicines taking
Preventive Aspirin Use - Adults 40+ taking low-dose aspirin (%)
Reproductive Health - Vaginal deliveries (%)
Reproductive Health - Cesarean deliveries (%)
Reproductive Health - Deliveries resulted in a live birth (%)
Reproductive Health - Pregnancies resulted in a delivery (%)
Reproductive Health - Women breastfeeding newborns (%)
Reproductive Health - Women that had a hysterectomy (%)
Reproductive Health - Women that had both ovaries removed (%)
Reproductive Health - Women that have ever taken birth control pills (%)
Reproductive Health - Women taking birth control pills (%)
Reproductive Health - Women that have ever used Depo-Provera or injectables (%)
Reproductive Health - Women that have ever used female hormones (%)
Sexual Behavior - People 18+ that ever had sex (vaginal, anal, or oral) (%)
Sexual Behavior - Males 18+ that ever had vaginal sex with a woman (%)
Sexual Behavior - Males 18+ that ever performed oral sex on a woman (%)
Sexual Behavior - Males 18+ that ever had anal sex with a woman (%)
Sexual Behavior - Males 18+ that ever had any sex with a man (%)
Sexual Behavior - Females 18+ that ever had vaginal sex with a man (%)
Sexual Behavior - Females 18+ that ever performed oral sex on a man (%)
Sexual Behavior - Females 18+ that ever had anal sex with a man (%)
Sexual Behavior - Females 18+ that ever had any kind of sex with a woman (%)
Sexual Behavior - Average age people first had sex
Sexual Behavior - Average number of female sex partners in lifetime (males 18+)
Sexual Behavior - Average number of female vaginal sex partners in lifetime (males 18+)
Sexual Behavior - Average age people first performed oral sex on a woman (18+)
Sexual Behavior - Average number of woman performed oral sex on in lifetime (18+)
Sexual Behavior - Average number of male sex partners in lifetime (males 18+)
Sexual Behavior - Average number of male anal sex partners in lifetime (males 18+)
Sexual Behavior - Average age people first performed oral sex on a man (18+)
Sexual Behavior - Average number of male oral sex partners in lifetime (18+)
Sexual Behavior - People using protection when performing oral sex (%)
Sexual Behavior - Average number of times people have vaginal or anal sex a year
Sexual Behavior - People having sex without condom (%)
Sexual Behavior - Average number of male sex partners in lifetime (females 18+)
Sexual Behavior - Average number of male vaginal sex partners in lifetime (females 18+)
Sexual Behavior - Average number of female sex partners in lifetime (females 18+)
Sexual Behavior - Circumcised males 18+ (%)
Sleep Disorders - Average hours sleeping at night
Sleep Disorders - People that has trouble sleeping (%)
Smoking-Cigarette Use - People smoking cigarettes (%)
Taste & Smell - People 40+ having problems with smell (%)
Taste & Smell - People 40+ having problems with taste (%)
Taste & Smell - People 40+ that ever had wisdom teeth removed (%)
Taste & Smell - People 40+ that ever had tonsils teeth removed (%)
Taste & Smell - People 40+ that ever had a loss of consciousness because of a head injury (%)
Taste & Smell - People 40+ that ever had a broken nose or other serious injury to face or skull (%)
Taste & Smell - People 40+ that ever had two or more sinus infections (%)
Weight - Average height (inches)
Weight - Average weight (pounds)
Weight - Average BMI
Weight - People that are obese (%)
Weight - People that ever were obese (%)
Weight - People trying to lose weight (%)
According to our research of Ohio and other state lists, there were 18 registered sex offenders living in Girard, Ohio as of May 31, 2024 . The ratio of all residents to sex offenders in Girard is 526 to 1.The ratio of registered sex offenders to all residents in this city is near the state average.
Officers per 1,000 residents here:
1.51Ohio average:
1.99
Latest news from Girard, OH collected exclusively by city-data.com from local newspapers, TV, and radio stations
Ancestries: American (55.1%), Italian (14.4%), German (5.9%), English (2.6%), Irish (2.0%), Croatian (1.3%).
Current Local Time:
Land area: 6.11 square miles.
Population density: 1,554 people per square mile (low).
71 residents are foreign born
Median real estate property taxes paid for housing units with mortgages in 2022: $1,181 (1.2%)Median real estate property taxes paid for housing units with no mortgage in 2022: $1,235 (1.2%)
Nearest city with pop. 50,000+: Youngstown, OH
Nearest city with pop. 200,000+: Akron, OH
Nearest city with pop. 1,000,000+: Philadelphia, PA
Nearest cities:
Latitude: 41.16 N, Longitude: 80.70 W
Daytime population change due to commuting: -1,635 (-17.2%)Workers who live and work in this city: 616 (15.1%)
Single-family new house construction building permits:
2021: 1 building , cost: $235,9002020: 3 buildings , average cost: $278,4002013: 1 building , cost: $152,0002009: 1 building , cost: $152,0002007: 4 buildings , average cost: $72,5002003: 10 buildings , average cost: $176,2002002: 8 buildings , average cost: $176,2002001: 5 buildings , average cost: $170,6002000: 9 buildings , average cost: $190,0001999: 9 buildings , average cost: $190,0001998: 6 buildings , average cost: $136,3001997: 14 buildings , average cost: $157,000Unemployment in December 2023:
Most common occupations in Girard, OH (%)
Both Males Females
Other production occupations, including supervisors (5.4%)
Laborers and material movers, hand (4.4%)
Metal workers and plastic workers (4.1%)
Retail sales workers, except cashiers (3.6%)
Other sales and related occupations, including supervisors (3.6%)
Electrical equipment mechanics and other installation, maintenance, and repair workers, including supervisors (3.5%)
Preschool, kindergarten, elementary, and middle school teachers (3.2%)
Electrical equipment mechanics and other installation, maintenance, and repair workers, including supervisors (6.5%)
Laborers and material movers, hand (6.4%)
Other production occupations, including supervisors (6.3%)
Metal workers and plastic workers (5.2%)
Driver/sales workers and truck drivers (4.7%)
Other sales and related occupations, including supervisors (4.1%)
Assemblers and fabricators (4.1%)
Cashiers (6.3%)
Secretaries and administrative assistants (5.9%)
Other office and administrative support workers, including supervisors (5.8%)
Preschool, kindergarten, elementary, and middle school teachers (5.3%)
Registered nurses (4.4%)
Other production occupations, including supervisors (4.4%)
Nursing, psychiatric, and home health aides (4.3%)
Tornado activity:
Girard-area historical tornado activity is slightly below Ohio state average. It is 4% greater than the overall U.S. average.
On 5/31/1985, a category F5 (max. wind speeds 261-318 mph) tornado 22.6 miles away from the Girard city center killed 18 people and injured 310 people and caused between $50,000,000 and $500,000,000 in damages.
On 5/31/1985, a category F4 (max. wind speeds 207-260 mph) tornado 24.0 miles away from the city center killed 16 people and injured 125 people and caused between $5,000,000 and $50,000,000 in damages.
Earthquake activity:
Girard-area historical earthquake activity is significantly above Ohio state average. It is 55% smaller than the overall U.S. average. On 9/25/1998 at 19:52:52, a magnitude 5.2 (4.8 MB, 4.3 MS, 5.2 LG, 4.5 MW, Depth: 3.1 mi, Class: Moderate, Intensity: VI - VII) earthquake occurred 27.8 miles away from the city center On 1/31/1986 at 16:46:43, a magnitude 5.0 (5.0 MB) earthquake occurred 39.0 miles away from the city center On 8/23/2011 at 17:51:04, a magnitude 5.8 (5.8 MW, Depth: 3.7 mi) earthquake occurred 268.6 miles away from Girard center On 12/31/2011 at 20:05:01, a magnitude 4.0 (4.0 ML, Depth: 3.1 mi, Class: Light, Intensity: IV - V) earthquake occurred 2.6 miles away from the city center On 7/27/1980 at 18:52:21, a magnitude 5.2 (5.1 MB, 4.7 MS, 5.0 UK, 5.2 UK) earthquake occurred 267.6 miles away from Girard center On 6/10/2019 at 14:50:45, a magnitude 4.0 (4.0 MB, Depth: 1.2 mi) earthquake occurred 53.4 miles away from Girard center Magnitude types: regional Lg-wave magnitude (LG), body-wave magnitude (MB), local magnitude (ML), surface-wave magnitude (MS), moment magnitude (MW) Natural disasters: The number of natural disasters in Trumbull County (10) is smaller than the US average (15).Major Disasters (Presidential) Declared: 6Emergencies Declared: 3Storms: 6, Floods: 5, Tornadoes: 5, Blizzard: 1, Hurricane: 1, Power Outage: 1, Snowstorm: 1, Wind: 1, Other: 1 (Note: some incidents may be assigned to more than one category). Hospitals and medical centers in Girard: HM HOME CARE (979 TIBBETTS-WICK ROAD, SUITE A)
HOME HEALTH BY WINDSOR LLC (18 EAST LIBERTY STREET)
Other hospitals and medical centers near Girard: YOUNGSTOWN - WARREN HOME DIALYSIS (Dialysis Facility, about 2 miles away; YOUNGSTOWN, OH)
MVI HOMECARE INC (Home Health Center, about 2 miles away; YOUNGSTOWN, OH)
CELTIC HEALTHCARE OF NE OHIO, INC (Home Health Center, about 2 miles away; YOUNGSTOWN, OH)
LIBERTY HEALTH CARE CENTER INC (Nursing Home, about 3 miles away; YOUNGSTOWN, OH)
CAMPUS HEALTH CARE CENTER (Nursing Home, about 3 miles away; YOUNGSTOWN, OH)
COLONIAL MANOR NURSING HOME (Nursing Home, about 3 miles away; YOUNGSTOWN, OH)
HERITAGE MANOR JEWISH HM FOR (Nursing Home, about 3 miles away; YOUNGSTOWN, OH)
Amtrak station near Girard: 5 miles: YOUNGSTOWN (530 MAHONING AVE.) Services: enclosed waiting area, public restrooms, public payphones, free short-term parking, call for taxi service.
Colleges/universities with over 2000 students nearest to Girard:
Youngstown State University (about 5 miles; Youngstown, OH ; Full-time enrollment: 11,575)
University of Mount Union (about 28 miles; Alliance, OH ; FT enrollment: 2,302)
Grove City College (about 33 miles; Grove City, PA ; FT enrollment: 2,560)
Kent State University at Kent (about 34 miles; Kent, OH ; FT enrollment: 25,431)
Slippery Rock University of Pennsylvania (about 35 miles; Slippery Rock, PA ; FT enrollment: 8,424)
Walsh University (about 41 miles; North Canton, OH ; FT enrollment: 2,553)
Malone University (about 43 miles; Canton, OH ; FT enrollment: 2,201)
Public high school in Girard:
Public elementary/middle schools in Girard:
Private elementary/middle school in Girard: ST ROSE SCHOOL Students: 251, Location: 61 E MAIN ST, Grades: KG-8)
See full list of schools located in Girard Library in Girard: GIRARD FREE LIBRARY Operating income: $855,540; Location: 105 E. PROSPECT ST.; 72,766 books ; 4,230 audio materials ; 3,759 video materials ; 266 state licensed databases ; 250 print serial subscriptions ; 150 electronic serial subscriptions )
Notable locations in Girard: (A) , Mahoning Golf Course (B) , Girard Fire Department Station 24 (C) , Girard Free Public Library (D) . Display/hide their locations on the map
Shopping Center: (1) . Display/hide its location on the map
Churches in Girard include: (A) , Girard Church of Christ (B) , Friendship Baptist Church (C) , First Assembly of God Church (D) , Faith Temple Apostolic Church (E) , Trinity Lutheran Church (F) , Shield of Faith Ministries Center (G) , Saint Rose Catholic Church (H) , Apostolic Christian Church (I) . Display/hide their locations on the map
Cemetery: (1) . Display/hide its location on the map
Reservoirs: (A) , Upper Girard Lake (B) . Display/hide their locations on the map
Streams, rivers, and creeks: (A) , Fourmile Run (B) . Display/hide their locations on the map
Park in Girard: (1) . Display/hide its location on the map
Tourist attraction:
Hotels:
Courts:
Birthplace of: Jack Blott - Football player and coach, Delos Drake - Baseball player, Kathleen Bradley - Female model, Marcellus Bowman - Player of and football.
Trumbull County has a predicted average indoor radon screening level between 2 and 4 pCi/L (pico curies per liter) - Moderate Potential Drinking water stations with addresses in Girard and their reported violations in the past:
GIRARD CITY PWS (Population served: 15,000, Purch surface water):
Past monitoring violations:
Monitoring and Reporting (DBP) - Between JUL-2009 and SEP-2009, Contaminant: Total Haloacetic Acids (HAA5). Follow-up actions: St Compliance achieved (OCT-05-2009), St Public Notif requested (DEC-04-2009), St Violation/Reminder Notice (DEC-04-2009), St Public Notif received (JUN-22-2010)
Monitoring and Reporting (DBP) - Between JUL-2009 and SEP-2009, Contaminant: TTHM. Follow-up actions: St Compliance achieved (OCT-05-2009), St Public Notif requested (DEC-04-2009), St Violation/Reminder Notice (DEC-04-2009), St Public Notif received (JUN-22-2010)
Population served: 56, Groundwater):
Past health violations:
MCL, Monthly (TCR) - In AUG-2009, Contaminant: Coliform. Follow-up actions: St Public Notif requested (AUG-17-2009), St Violation/Reminder Notice (AUG-17-2009), St Compliance achieved (MAY-07-2012)
MCL, Monthly (TCR) - In JUL-2009, Contaminant: Coliform. Follow-up actions: St Public Notif requested (AUG-04-2009), St Violation/Reminder Notice (AUG-04-2009), St Public Notif received (AUG-16-2009), St Compliance achieved (MAR-19-2010)
MCL, Monthly (TCR) - Between APR-2008 and JUN-2008, Contaminant: Coliform. Follow-up actions: St Public Notif requested (MAY-29-2008), St Violation/Reminder Notice (MAY-29-2008), St Compliance achieved (JAN-21-2009)
Past monitoring violations:
3 routine major monitoring violations
One minor monitoring violation
One regular monitoring violation
Population served: 50, Groundwater):
Past health violations:
MCL, Monthly (TCR) - Between OCT-2006 and DEC-2006, Contaminant: Coliform. Follow-up actions: St Public Notif requested (OCT-13-2006), St Violation/Reminder Notice (OCT-13-2006), St Compliance achieved (AUG-09-2007)
Past monitoring violations:
Monitoring, Repeat Major (TCR) - Between OCT-2006 and DEC-2006, Contaminant: Coliform (TCR). Follow-up actions: St Public Notif requested (DEC-11-2006), St Violation/Reminder Notice (DEC-11-2006), St Compliance achieved (AUG-09-2007)
One minor monitoring violation
Average household size: This city:
2.3 peopleOhio:
2.4 people
Percentage of family households: This city:
61.8%Whole state:
65.0%
Percentage of households with unmarried partners: This city:
7.0%Whole state:
6.8%
Likely homosexual households (counted as self-reported same-sex unmarried-partner households)
Lesbian couples: 0.3% of all households Gay men: 0.1% of all households
19 people in emergency and transitional shelters (with sleeping facilities) for people experiencing homelessness in 2010people in workers' group living quarters and job corps centers in 2010
Banks with branches in Girard (2011 data):
RBS Citizens, National Association: Girard Drive Thru Branch at 25 East Wilson, branch established on 2005/07/21; Girard Branch at 35 South State Street, branch established on 1919/01/01. Info updated 2007/09/19: Bank assets: $106,940.6 mil, Deposits: $75,690.2 mil, headquarters in Providence, RI, positive income , 1135 total offices , Holding Company: Uk Financial Investments Limited
The Farmers National Bank of Canfield: Girard Branch at 121 North State Street, branch established on 1974/09/16. Info updated 2006/11/03: Bank assets: $1,055.8 mil, Deposits: $846.0 mil, headquarters in Canfield, OH, positive income , 17 total offices , Holding Company: Farmers National Banc Corp.
JPMorgan Chase Bank, National Association: Girard Branch at 43 West Liberty Street, branch established on 1893/01/01. Info updated 2011/11/10: Bank assets: $1,811,678.0 mil, Deposits: $1,190,738.0 mil, headquarters in Columbus, OH, positive income , International Specialization, 5577 total offices , Holding Company: Jpmorgan Chase & Co.
For population 15 years and over in Girard:
Never married: 38.1%Now married: 40.3%Separated: 1.7%Widowed: 6.4%Divorced: 13.5% For population 25 years and over in Girard:
High school or higher: 91.0%Bachelor's degree or higher: 18.8%Graduate or professional degree: 7.5%Unemployed: 4.5%Mean travel time to work (commute): 18.2 minutes
Education Gini index (Inequality in education) Here:
8.1Ohio average:
11.0
Religion statistics for Girard, OH (based on Trumbull County data)
Religion Adherents Congregations Catholic 39,749 23 Evangelical Protestant 25,155 141 Mainline Protestant 23,326 87 Black Protestant 3,479 14 Orthodox 2,493 5 Other 2,198 16 None 113,912 -
Source: Clifford Grammich, Kirk Hadaway, Richard Houseal, Dale E.Jones, Alexei Krindatch, Richie Stanley and Richard H.Taylor. 2012. 2010 U.S.Religion Census: Religious Congregations & Membership Study. Association of Statisticians of American Religious Bodies. Jones, Dale E., et al. 2002. Congregations and Membership in the United States 2000. Nashville, TN: Glenmary Research Center. Graphs represent county-level data
Food Environment Statistics: Number of grocery stores : 49This county :
2.30 / 10,000 pop.Ohio :
1.89 / 10,000 pop.
Number of supercenters and club stores : 2This county :
0.09 / 10,000 pop.Ohio :
0.13 / 10,000 pop.
Number of convenience stores (no gas) : 34Trumbull County :
1.59 / 10,000 pop.Ohio :
1.25 / 10,000 pop.
Number of convenience stores (with gas) : 67Trumbull County :
3.14 / 10,000 pop.Ohio :
2.93 / 10,000 pop.
Number of full-service restaurants : 128This county :
6.00 / 10,000 pop.Ohio :
6.25 / 10,000 pop.
Adult diabetes rate : Trumbull County :
10.8%Ohio :
10.3%
Adult obesity rate : Trumbull County :
27.9%Ohio :
29.1%
Low-income preschool obesity rate : Trumbull County :
12.6%Ohio :
11.9%
Health and Nutrition:
Average overall health of teeth and gums : People feeling badly about themselves : People not drinking alcohol at all : Average hours sleeping at night : General health condition : This city:
57.0%Ohio:
57.0%
Average condition of hearing : This city:
77.7%Ohio:
79.1%
More about Health and Nutrition of Girard, OH Residents
Local government employment and payroll (March 2022)
Function
Full-time employees
Monthly full-time payroll
Average yearly full-time wage
Part-time employees
Monthly part-time payroll
Financial Administration
36 $139,969 $46,656 4 $3,895 Police Protection - Officers
23 $111,117 $57,974 6 $8,432 Judicial and Legal
17 $53,995 $38,114 0 $0 Firefighters
13 $77,409 $71,454 0 $0 Other Government Administration
1 $4,513 $54,156 9 $12,485
Totals for Government
90 $387,003 $51,600 19 $24,813
Girard government finances - Expenditure in 2017 (per resident):
Current Operations - Water Utilities: $3,772,000 ($397.22)
Sewerage: $2,633,000 ($277.27)Police Protection: $1,784,000 ($187.87)Local Fire Protection: $1,425,000 ($150.06)Regular Highways: $1,386,000 ($145.96)Judicial and Legal Services: $872,000 ($91.83)General - Other: $193,000 ($20.32)Financial Administration: $185,000 ($19.48)Central Staff Services: $143,000 ($15.06)Miscellaneous Commercial Activities - Other: $89,000 ($9.37)Parks and Recreation: $80,000 ($8.42)General - Interest on Debt: $96,000 ($10.11)
Total Salaries and Wages: $4,053,000 ($426.81)
Girard government finances - Revenue in 2017 (per resident):
Charges - Sewerage: $3,038,000 ($319.92)
Parks and Recreation: $16,000 ($1.68)Local Intergovernmental - Other: $138,000 ($14.53)
Miscellaneous - Fines and Forfeits: $267,000 ($28.12)
General Revenue - Other: $115,000 ($12.11)Royalties: $6,000 ($0.63)Revenue - Water Utilities: $4,014,000 ($422.70)
State Intergovernmental - Highways: $1,445,000 ($152.17)
Tax - Individual Income: $3,632,000 ($382.48)
Property: $1,317,000 ($138.69)Motor Vehicle License: $183,000 ($19.27)Alcoholic Beverage License: $15,000 ($1.58)Death and Gift: $5,000 ($0.53)
Girard government finances - Debt in 2017 (per resident):
Long Term Debt - Beginning Outstanding - Unspecified Public Purpose: $2,400,000 ($252.74)
Outstanding Unspecified Public Purpose: $1,967,000 ($207.14)Retired Unspecified Public Purpose: $433,000 ($45.60)
Girard government finances - Cash and Securities in 2017 (per resident):
Other Funds - Cash and Securities: $1,735,000 ($182.71)
Businesses in Girard, OH
Name Count Name Count
Arby's 1 McDonald's 1 Burger King 1 Rite Aid 1 Curves 1 Subway 2 Dairy Queen 1 U-Haul 2 Days Inn 1 UPS 4 Dunkin Donuts 1 Waffle House 1 FedEx 3
Strongest AM radio stations in Girard:
WNIO (1390 AM; 10 kW; YOUNGSTOWN, OH; Owner: YOUNGSTOWN RADIO LICENSE, L.L.C.)
WHKW (1440 AM; 5 kW; WARREN, OH; Owner: SCA LICENSE CORPORATION)
WKBN (570 AM; 5 kW; YOUNGSTOWN, OH; Owner: CITICASTERS LICENSES, L.P.)
WBBW (1240 AM; 1 kW; YOUNGSTOWN, OH; Owner: CUMULUS LICENSING CORP.)
WRTK (1540 AM; daytime; 0 kW; NILES, OH; Owner: D & E COMMUNICATIONS OF OHIO, INC.)
WKNR (850 AM; 50 kW; CLEVELAND, OH; Owner: CARON BROADCASTING, INC.)
WTAM (1100 AM; 50 kW; CLEVELAND, OH; Owner: JACOR BROADCASTING CORPORATION)
KDKA (1020 AM; 50 kW; PITTSBURGH, PA; Owner: INFINITY BROADCASTING OPERATIONS, INC.)
WHK (1220 AM; 50 kW; CLEVELAND, OH; Owner: CARON BROADCASTING, INC.)
WKST (1200 AM; 5 kW; NEW CASTLE, PA; Owner: CITICASTERS LICENSES, L.P.)
WWVA (1170 AM; 53 kW; WHEELING, WV; Owner: CAPSTAR TX LIMITED PARTNERSHIP)
WPIC (790 AM; 1 kW; SHARON, PA; Owner: CUMULUS LICENSING CORP.)
WLOA (1470 AM; 1 kW; FARRELL, PA; Owner: HOLY FAMILY COMMUNICATIONS)
Strongest FM radio stations in Girard:
WMXY (98.9 FM; YOUNGSTOWN, OH; Owner: CITICASTERS LICENSES, L.P.)
WHOT-FM (101.1 FM; YOUNGSTOWN, OH; Owner: CUMULUS LICENSING CORP.)
WYTN (91.7 FM; YOUNGSTOWN, OH; Owner: FAMILY STATIONS, INC.)
WYFM (102.9 FM; SHARON, PA; Owner: CUMULUS LICENSING CORP.)
WNCD (93.3 FM; YOUNGSTOWN, OH; Owner: YOUNGSTOWN RADIO LICENSE, L.L.C.)
WYSU (88.5 FM; YOUNGSTOWN, OH; Owner: YOUNGSTOWN STATE UNIVERSITY)
WBBG (106.1 FM; NILES, OH; Owner: CITICASTERS LICENSES, L.P.)
WAKZ (95.9 FM; SHARPSVILLE, PA; Owner: YOUNGSTOWN RADIO LICENSE, L.L.C.)
WICT (95.1 FM; GROVE CITY, PA; Owner: YOUNGSTOWN RADIO LICENSE, L.L.C.)
WWIZ (103.9 FM; MERCER, PA; Owner: CUMULUS LICENSING CORP.)
WQXK (105.1 FM; SALEM, OH; Owner: CUMULUS LICENSING CORP.)
WRBP (101.9 FM; HUBBARD, OH; Owner: STOP 26-RIVERBEND, INC.)
WKDD (98.1 FM; CANTON, OH; Owner: CITICASTERS LICENSES, L.P.)
WENZ (107.9 FM; CLEVELAND, OH; Owner: RADIO ONE LICENSES, LLC)
WLLF (96.7 FM; MERCER, PA; Owner: CUMULUS LICENSING CORP.)
WCVJ (90.9 FM; JEFFERSON, OH; Owner: AGAPE SCHOOL, INC.)
W232AI (94.3 FM; NILES, OH; Owner: RICHARD P. MARBURGER)
W248AD (97.5 FM; NEW WILMINGTON, PA; Owner: YOUNGSTOWN STATE UNIVERSITY)
WEXC (107.1 FM; GREENVILLE, PA; Owner: BEACON BROADCASTING, INC.)
TV broadcast stations around Girard:
W52DS (Channel 52; YOUNGSTOWN, OH; Owner: TRINITY BROADCASTING NETWORK)
WKBN-TV (Channel 27; YOUNGSTOWN, OH; Owner: PIEDMONT TELEVISION OF YOUNGSTOWN LICENSE LLC)
WFMJ-TV (Channel 21; YOUNGSTOWN, OH; Owner: WFMJ TELEVISION, INC.)
WYFX-LP (Channel 62; YOUNGSTOWN, OH; Owner: PIEDMONT TELEVISION OF YOUNGSTOWN LICENSE LLC)
WYTV (Channel 33; YOUNGSTOWN, OH; Owner: CHELSEY BROADCASTING COMPANY OF YOUNGSTOWN, LLC)
WNEO (Channel 45; ALLIANCE, OH; Owner: NORTHEASTERN EDUCATIONAL TELEVISION OF OHIO, INC.)
WFXI-CA (Channel 17; MERCER, PA; Owner: PIEDMONT TELEVISION OF YOUNGSTOWN LICENSE LLC)
W50BF (Channel 50; SHARON, PA; Owner: CORNERSTONE TELEVISION, INC.)
WDLI (Channel 17; CANTON, OH; Owner: TRINITY BROADCASTING NETWORK, INC.)
W56CL (Channel 56; NEW CASTLE, PA; Owner: BRUNO-GOODWORTH NETWORK, INC.)
WXOX-LP (Channel 65; CLEVELAND, OH; Owner: VENTURE TECHNOLOGIES GROUP, LLC)
W53AX (Channel 53; CLEVELAND, OH; Owner: WORD OF GOD FELLOWSHIP, INC.)
W58AM (Channel 58; YOUNGSTOWN, ETC., OH; Owner: NORTHEASTERN ED TV OF OHIO, INC.)
National Bridge Inventory (NBI) Statistics 39 Number of bridges669ft / 204m Total length $1,560,000 Total costs565,366 Total average daily traffic84,083 Total average daily truck traffic
New bridges - historical statistics
1 1930-1939 6 1960-1969 20 1970-1979 3 1980-1989 1 1990-1999 2 2000-2009 6 2010-2019
See full National Bridge Inventory statistics for Girard, OH
FCC Registered Antenna Towers: 45 (
See the full list of FCC Registered Antenna Towers in Girard )
FCC Registered Broadcast Land Mobile Towers: 8 (
See the full list of FCC Registered Broadcast Land Mobile Towers in Girard, OH )
FCC Registered Microwave Towers: 4
CLE1512, 1690 Lincoln Avenue (Lat: 41.180056 Lon: -80.667833), Type: Tower, Structure height: 54.9 m, Call Sign: WQHH539, Licensee ID: L01728370, Assigned Frequencies: 11325.0 MHz, 11365.0 MHz, 11285.0 MHz, Grant Date: 07/30/2007, Expiration Date: 07/30/2017, Cancellation Date: 09/11/2013, Certifier: Joseph M Sandri Jr., Registrant: Fibertower Network Services, Corp., Debtor-In-Possession, 1875 Eye Street, Nw, 5th Floor, Room 505, Washington, DC 20006, Phone: (202) 223-1028, Email:
CLE1505, 1115 S. State St (Lat: 41.143194 Lon: -80.693500), Type: Tower, Structure height: 54.9 m, Call Sign: WQHH570, Licensee ID: L01728370, Assigned Frequencies: 10795.0 MHz, Grant Date: 07/30/2007, Expiration Date: 07/30/2017, Cancellation Date: 09/11/2013, Certifier: Joseph M Sandri Jr., Registrant: Fibertower Network Services, Corp., Debtor-In-Possession, 1875 Eye Street, Nw, 5th Floor, Room 505, Washington, DC 20006, Phone: (202) 223-1028, Email:
CLE1513, 1280-A Trumbull Avenue (Lat: 41.140306 Lon: -80.670639), Type: Tower, Structure height: 60.7 m, Call Sign: WQHH795, Licensee ID: L01728370, Assigned Frequencies: 10755.0 MHz, 10795.0 MHz, Grant Date: 07/31/2007, Expiration Date: 07/31/2017, Cancellation Date: 09/11/2013, Certifier: Joseph M Sandri Jr., Registrant: Fibertower Network Services, Corp., Debtor-In-Possession, 1875 Eye Street, Nw, 5th Floor, Room 505, Washington, DC 20006, Phone: (202) 223-1028, Email:
OH0031, 222 Harry Street (Lat: 41.163111 Lon: -80.708694), Type: Tower, Structure height: 42.7 m, Overall height: 47.2 m, Call Sign: WQMI216, Assigned Frequencies: 11215.0 MHz, 11645.0 MHz, 10915.0 MHz, 10955.0 MHz, Grant Date: 08/12/2010, Expiration Date: 08/12/2020, Cancellation Date: 02/16/2012, Certifier: Dan Mieszala, Registrant: Open Range Communications Inc., 6430 S. Fiddlers Green Circle, Suite 500, Greenwood Village, CO 80111, Phone: (303) 376-2112, Fax: (303) 376-2109, Email:
FCC Registered Paging Towers: 2
1699 Shannon Road (Lat: 41.184778 Lon: -80.691722), Type: Tower, Structure height: 91.1 m, Call Sign: KNKM927, Assigned Frequencies: 931.212 MHz, Grant Date: 05/11/1999, Expiration Date: 04/01/2009, Cancellation Date: 04/21/2004, Certifier: Paul H Kuzia, Registrant: Wilkinson Barker Knauer, LLP, 2300 N Street, N.W., 7th Floor, Washington, DC 20037, Phone: (202) 783-4141, Fax: (202) 783-5851, Email:
1699 Shannon Road (Lat: 41.184778 Lon: -80.691722), Call Sign: KNKO383, Assigned Frequencies: 931.887 MHz, Grant Date: 05/11/1999, Expiration Date: 04/01/2009, Cancellation Date: 01/13/2005, Certifier: Paul H Kuzia, Registrant: Venable, LLP, 575 7th Street, Nw, Washington, DC 20004, Phone: (202) 344-4000, Fax: (202) 344-8300, Email:
FCC Registered Amateur Radio Licenses: 89 (
See the full list of FCC Registered Amateur Radio Licenses in Girard )
FAA Registered Aircraft: 8 (
See the full list of FAA Registered Aircraft in Girard )
Home Mortgage Disclosure Act Aggregated Statistics For Year 2009(Based on 1 full and 3 partial tracts) A) FHA, FSA/RHS & VA B) Conventional C) Refinancings D) Home Improvement Loans E) Loans on Dwellings For 5+ Families F) Non-occupant Loans on G) Loans On Manufactured Number Average Value Number Average Value Number Average Value Number Average Value Number Average Value Number Average Value Number Average Value
LOANS ORIGINATED 12 $70,152 23 $58,565 64 $76,647 5 $24,434 0 $0 10 $47,090 0 $0 APPLICATIONS APPROVED, NOT ACCEPTED 2 $54,845 3 $107,607 8 $70,752 2 $49,025 0 $0 2 $19,815 0 $0 APPLICATIONS DENIED 3 $65,127 8 $56,846 53 $72,089 14 $17,299 0 $0 3 $45,710 1 $3,280 APPLICATIONS WITHDRAWN 1 $60,970 2 $28,220 18 $85,219 1 $9,840 1 $931,520 1 $6,560 0 $0 FILES CLOSED FOR INCOMPLETENESS 0 $0 0 $0 3 $91,933 1 $70,690 0 $0 0 $0 0 $0
Aggregated Statistics For Year 2008(Based on 1 full and 3 partial tracts) A) FHA, FSA/RHS & VA B) Conventional C) Refinancings D) Home Improvement Loans E) Loans on Dwellings For 5+ Families F) Non-occupant Loans on G) Loans On Manufactured Number Average Value Number Average Value Number Average Value Number Average Value Number Average Value Number Average Value Number Average Value
LOANS ORIGINATED 25 $79,590 20 $55,874 72 $67,216 18 $23,428 1 $308,320 7 $41,816 1 $2,990 APPLICATIONS APPROVED, NOT ACCEPTED 2 $56,110 3 $65,997 11 $66,327 4 $20,712 0 $0 1 $13,780 0 $0 APPLICATIONS DENIED 3 $44,143 3 $66,293 108 $72,518 29 $26,482 1 $34,110 8 $41,336 1 $2,990 APPLICATIONS WITHDRAWN 1 $230,260 2 $58,385 16 $92,531 2 $34,885 0 $0 1 $107,580 0 $0 FILES CLOSED FOR INCOMPLETENESS 0 $0 1 $66,910 4 $95,655 0 $0 0 $0 1 $48,540 0 $0
Aggregated Statistics For Year 2007(Based on 1 full and 3 partial tracts) A) FHA, FSA/RHS & VA B) Conventional C) Refinancings D) Home Improvement Loans E) Loans on Dwellings For 5+ Families F) Non-occupant Loans on Number Average Value Number Average Value Number Average Value Number Average Value Number Average Value Number Average Value
LOANS ORIGINATED 10 $66,233 57 $59,805 89 $60,228 31 $26,416 0 $0 20 $41,710 APPLICATIONS APPROVED, NOT ACCEPTED 0 $0 6 $40,668 18 $75,005 3 $26,487 0 $0 1 $52,480 APPLICATIONS DENIED 2 $59,650 20 $49,649 133 $77,547 32 $33,909 0 $0 7 $49,799 APPLICATIONS WITHDRAWN 0 $0 7 $53,727 49 $80,837 1 $53,140 1 $268,960 1 $62,980 FILES CLOSED FOR INCOMPLETENESS 0 $0 2 $32,350 11 $85,091 0 $0 0 $0 1 $97,200
Aggregated Statistics For Year 2006(Based on 1 full and 3 partial tracts) A) FHA, FSA/RHS & VA B) Conventional C) Refinancings D) Home Improvement Loans E) Loans on Dwellings For 5+ Families F) Non-occupant Loans on G) Loans On Manufactured Number Average Value Number Average Value Number Average Value Number Average Value Number Average Value Number Average Value Number Average Value
LOANS ORIGINATED 10 $63,291 91 $70,783 133 $66,701 30 $26,907 1 $108,900 26 $70,488 1 $2,990 APPLICATIONS APPROVED, NOT ACCEPTED 0 $0 12 $73,597 42 $72,138 6 $38,885 0 $0 5 $51,820 0 $0 APPLICATIONS DENIED 0 $0 35 $67,338 161 $83,839 37 $27,119 2 $206,340 8 $50,240 0 $0 APPLICATIONS WITHDRAWN 1 $76,100 10 $60,883 75 $77,937 12 $55,842 0 $0 6 $51,333 0 $0 FILES CLOSED FOR INCOMPLETENESS 0 $0 6 $59,207 27 $90,083 1 $33,580 0 $0 0 $0 0 $0
Aggregated Statistics For Year 2005(Based on 1 full and 3 partial tracts) A) FHA, FSA/RHS & VA B) Conventional C) Refinancings D) Home Improvement Loans E) Loans on Dwellings For 5+ Families F) Non-occupant Loans on G) Loans On Manufactured Number Average Value Number Average Value Number Average Value Number Average Value Number Average Value Number Average Value Number Average Value
LOANS ORIGINATED 10 $69,781 109 $61,120 167 $73,009 34 $29,806 1 $951,200 42 $54,737 1 $5,300 APPLICATIONS APPROVED, NOT ACCEPTED 0 $0 15 $63,670 45 $86,734 5 $7,952 0 $0 3 $66,563 0 $0 APPLICATIONS DENIED 1 $38,050 36 $61,464 167 $76,774 43 $34,144 0 $0 15 $73,429 4 $42,162 APPLICATIONS WITHDRAWN 3 $47,977 19 $65,620 81 $90,921 13 $118,205 0 $0 3 $107,753 1 $9,840 FILES CLOSED FOR INCOMPLETENESS 0 $0 1 $46,580 16 $112,532 2 $55,635 0 $0 1 $51,170 0 $0
Aggregated Statistics For Year 2004(Based on 1 full and 3 partial tracts) A) FHA, FSA/RHS & VA B) Conventional C) Refinancings D) Home Improvement Loans E) Loans on Dwellings For 5+ Families F) Non-occupant Loans on G) Loans On Manufactured Number Average Value Number Average Value Number Average Value Number Average Value Number Average Value Number Average Value Number Average Value
LOANS ORIGINATED 16 $70,998 109 $69,663 163 $72,355 19 $38,062 2 $463,890 41 $56,210 0 $0 APPLICATIONS APPROVED, NOT ACCEPTED 1 $82,660 21 $76,399 35 $81,398 10 $34,173 0 $0 1 $40,650 1 $19,020 APPLICATIONS DENIED 2 $70,690 21 $58,321 146 $76,191 35 $24,433 0 $0 8 $60,710 0 $0 APPLICATIONS WITHDRAWN 4 $67,772 18 $69,882 80 $76,091 9 $16,697 0 $0 5 $64,390 0 $0 FILES CLOSED FOR INCOMPLETENESS 0 $0 3 $109,157 31 $73,262 0 $0 0 $0 1 $41,980 0 $0
Aggregated Statistics For Year 2003(Based on 1 full and 3 partial tracts) A) FHA, FSA/RHS & VA B) Conventional C) Refinancings D) Home Improvement Loans E) Loans on Dwellings For 5+ Families F) Non-occupant Loans on Number Average Value Number Average Value Number Average Value Number Average Value Number Average Value Number Average Value
LOANS ORIGINATED 19 $74,539 87 $75,748 319 $73,358 18 $20,906 2 $150,870 42 $52,989 APPLICATIONS APPROVED, NOT ACCEPTED 0 $0 14 $62,901 69 $69,383 0 $0 0 $0 4 $57,628 APPLICATIONS DENIED 1 $78,060 16 $60,048 161 $70,082 25 $14,780 1 $997,120 13 $54,700 APPLICATIONS WITHDRAWN 1 $51,250 15 $79,353 75 $82,183 2 $25,720 0 $0 8 $66,291 FILES CLOSED FOR INCOMPLETENESS 1 $39,910 7 $47,757 8 $78,861 0 $0 1 $63,620 1 $16,400
Aggregated Statistics For Year 2002(Based on 1 full and 3 partial tracts) A) FHA, FSA/RHS & VA B) Conventional C) Refinancings D) Home Improvement Loans E) Loans on Dwellings For 5+ Families F) Non-occupant Loans on Number Average Value Number Average Value Number Average Value Number Average Value Number Average Value Number Average Value
LOANS ORIGINATED 22 $68,832 90 $75,737 249 $67,148 19 $16,240 1 $678,960 31 $50,998 APPLICATIONS APPROVED, NOT ACCEPTED 2 $44,400 9 $68,411 56 $56,204 4 $17,080 0 $0 4 $43,468 APPLICATIONS DENIED 3 $75,050 20 $45,931 158 $65,547 20 $13,507 0 $0 11 $47,314 APPLICATIONS WITHDRAWN 0 $0 11 $66,585 79 $71,824 4 $37,392 0 $0 2 $68,205 FILES CLOSED FOR INCOMPLETENESS 0 $0 3 $49,880 19 $77,824 0 $0 0 $0 1 $13,120
Aggregated Statistics For Year 2001(Based on 1 full and 3 partial tracts) A) FHA, FSA/RHS & VA B) Conventional C) Refinancings D) Home Improvement Loans E) Loans on Dwellings For 5+ Families F) Non-occupant Loans on Number Average Value Number Average Value Number Average Value Number Average Value Number Average Value Number Average Value
LOANS ORIGINATED 26 $64,688 76 $75,896 260 $62,745 30 $26,688 3 $121,150 29 $48,885 APPLICATIONS APPROVED, NOT ACCEPTED 2 $57,600 4 $106,380 62 $56,175 8 $20,358 0 $0 3 $27,737 APPLICATIONS DENIED 1 $51,170 17 $48,251 157 $61,780 26 $13,787 0 $0 7 $36,150 APPLICATIONS WITHDRAWN 1 $56,550 8 $71,472 67 $68,375 7 $22,073 0 $0 5 $68,786 FILES CLOSED FOR INCOMPLETENESS 0 $0 1 $37,390 16 $63,951 2 $11,545 0 $0 1 $59,200
Aggregated Statistics For Year 2000(Based on 1 full and 3 partial tracts) A) FHA, FSA/RHS & VA B) Conventional C) Refinancings D) Home Improvement Loans E) Loans on Dwellings For 5+ Families F) Non-occupant Loans on Number Average Value Number Average Value Number Average Value Number Average Value Number Average Value Number Average Value
LOANS ORIGINATED 25 $58,125 95 $71,884 121 $52,250 38 $13,509 1 $314,880 26 $49,480 APPLICATIONS APPROVED, NOT ACCEPTED 1 $85,280 7 $41,849 43 $52,574 8 $11,059 1 $59,860 5 $44,772 APPLICATIONS DENIED 2 $37,835 23 $43,732 104 $56,444 37 $15,913 0 $0 6 $55,112 APPLICATIONS WITHDRAWN 0 $0 7 $51,907 64 $51,553 8 $16,230 0 $0 4 $25,935 FILES CLOSED FOR INCOMPLETENESS 0 $0 1 $39,360 13 $56,475 0 $0 0 $0 0 $0
Aggregated Statistics For Year 1999(Based on 1 full and 3 partial tracts) A) FHA, FSA/RHS & VA B) Conventional C) Refinancings D) Home Improvement Loans F) Non-occupant Loans on Number Average Value Number Average Value Number Average Value Number Average Value Number Average Value
LOANS ORIGINATED 23 $61,027 89 $67,011 205 $52,337 41 $13,711 31 $47,074 APPLICATIONS APPROVED, NOT ACCEPTED 0 $0 9 $59,944 63 $51,480 14 $19,104 0 $0 APPLICATIONS DENIED 2 $80,835 24 $54,248 120 $53,486 28 $16,938 6 $38,460 APPLICATIONS WITHDRAWN 2 $43,895 7 $62,550 64 $50,464 8 $23,850 3 $43,980 FILES CLOSED FOR INCOMPLETENESS 1 $22,790 0 $0 34 $56,852 0 $0 2 $49,990
Detailed HMDA statistics for the following Tracts:
9321.00
, 9322.00 , 9323.00 , 9324.00
Private Mortgage Insurance Companies Aggregated Statistics For Year 2009(Based on 1 full and 2 partial tracts) A) Conventional B) Refinancings Number Average Value Number Average Value
LOANS ORIGINATED 2 $42,640 4 $84,100 APPLICATIONS APPROVED, NOT ACCEPTED 0 $0 3 $58,563 APPLICATIONS DENIED 0 $0 1 $53,900 APPLICATIONS WITHDRAWN 1 $43,300 0 $0 FILES CLOSED FOR INCOMPLETENESS 0 $0 0 $0
Aggregated Statistics For Year 2007(Based on 1 full and 3 partial tracts) A) Conventional B) Refinancings C) Non-occupant Loans on Number Average Value Number Average Value Number Average Value
LOANS ORIGINATED 25 $63,537 10 $89,442 5 $51,616 APPLICATIONS APPROVED, NOT ACCEPTED 2 $44,500 6 $103,900 0 $0 APPLICATIONS DENIED 0 $0 0 $0 0 $0 APPLICATIONS WITHDRAWN 1 $186,960 2 $61,570 0 $0 FILES CLOSED FOR INCOMPLETENESS 0 $0 0 $0 0 $0
Aggregated Statistics For Year 2006(Based on 1 full and 3 partial tracts) A) Conventional B) Refinancings C) Non-occupant Loans on Number Average Value Number Average Value Number Average Value
LOANS ORIGINATED 21 $72,010 11 $73,736 2 $45,960 APPLICATIONS APPROVED, NOT ACCEPTED 4 $89,082 7 $91,637 1 $17,060 APPLICATIONS DENIED 1 $72,460 1 $56,870 0 $0 APPLICATIONS WITHDRAWN 0 $0 1 $44,900 0 $0 FILES CLOSED FOR INCOMPLETENESS 0 $0 0 $0 0 $0
Aggregated Statistics For Year 2005(Based on 1 full and 3 partial tracts) A) Conventional B) Refinancings C) Non-occupant Loans on Number Average Value Number Average Value Number Average Value
LOANS ORIGINATED 28 $62,586 6 $125,247 9 $52,134 APPLICATIONS APPROVED, NOT ACCEPTED 2 $68,880 3 $60,450 1 $30,830 APPLICATIONS DENIED 2 $45,065 1 $55,870 0 $0 APPLICATIONS WITHDRAWN 1 $19,950 1 $56,550 1 $19,950 FILES CLOSED FOR INCOMPLETENESS 0 $0 0 $0 0 $0
Aggregated Statistics For Year 2004(Based on 1 full and 3 partial tracts) A) Conventional B) Refinancings C) Non-occupant Loans on Number Average Value Number Average Value Number Average Value
LOANS ORIGINATED 33 $61,126 11 $87,715 9 $44,330 APPLICATIONS APPROVED, NOT ACCEPTED 6 $125,522 6 $109,510 1 $41,330 APPLICATIONS DENIED 2 $107,605 0 $0 1 $44,610 APPLICATIONS WITHDRAWN 3 $83,223 1 $32,140 0 $0 FILES CLOSED FOR INCOMPLETENESS 0 $0 0 $0 0 $0
Aggregated Statistics For Year 2002(Based on 1 full and 3 partial tracts) A) Conventional B) Refinancings C) Non-occupant Loans on Number Average Value Number Average Value Number Average Value
LOANS ORIGINATED 25 $62,458 17 $98,220 3 $49,897 APPLICATIONS APPROVED, NOT ACCEPTED 7 $43,830 12 $71,363 1 $36,910 APPLICATIONS DENIED 1 $44,610 3 $55,667 2 $54,340 APPLICATIONS WITHDRAWN 3 $45,417 4 $72,100 1 $99,060 FILES CLOSED FOR INCOMPLETENESS 1 $73,340 1 $46,580 0 $0
Aggregated Statistics For Year 2001(Based on 1 full and 3 partial tracts) A) Conventional B) Refinancings C) Non-occupant Loans on Number Average Value Number Average Value Number Average Value
LOANS ORIGINATED 19 $70,022 11 $97,931 0 $0 APPLICATIONS APPROVED, NOT ACCEPTED 4 $62,932 8 $72,990 1 $39,360 APPLICATIONS DENIED 0 $0 3 $70,687 1 $62,740 APPLICATIONS WITHDRAWN 2 $64,430 1 $51,170 0 $0 FILES CLOSED FOR INCOMPLETENESS 1 $62,740 2 $95,175 1 $62,740
Aggregated Statistics For Year 2000(Based on 1 full and 3 partial tracts) A) Conventional B) Refinancings C) Non-occupant Loans on Number Average Value Number Average Value Number Average Value
LOANS ORIGINATED 30 $63,817 2 $121,175 2 $39,410 APPLICATIONS APPROVED, NOT ACCEPTED 2 $67,620 0 $0 0 $0 APPLICATIONS DENIED 1 $53,900 1 $53,880 0 $0 APPLICATIONS WITHDRAWN 0 $0 0 $0 0 $0 FILES CLOSED FOR INCOMPLETENESS 0 $0 0 $0 0 $0
Aggregated Statistics For Year 1999(Based on 1 full and 3 partial tracts) A) Conventional B) Refinancings C) Non-occupant Loans on Number Average Value Number Average Value Number Average Value
LOANS ORIGINATED 26 $64,088 11 $60,085 2 $39,495 APPLICATIONS APPROVED, NOT ACCEPTED 1 $41,550 2 $79,780 0 $0 APPLICATIONS DENIED 0 $0 1 $52,280 0 $0 APPLICATIONS WITHDRAWN 0 $0 0 $0 0 $0 FILES CLOSED FOR INCOMPLETENESS 0 $0 1 $65,440 0 $0
Detailed PMIC statistics for the following Tracts:
9321.00
, 9322.00 , 9323.00 , 9324.00 Fire-safe hotels and motels in Girard, Ohio:
Holiday Inn Metroplex, 1620 Motor Inn Dr, Girard, Ohio 44420 Phone: (330) 759-0606, Fax: (330) 759-1978
Travelodge, 1610 Motor Inn Dr, Girard, Ohio 44420 Phone: (330) 759-3000, Fax: (330) 759-3222
All 2 fire-safe hotels and motels in Girard, Ohio Girard compared to Ohio state average:
Median household income below state average. Median house value below state average. Unemployed percentage significantly below state average. Black race population percentage significantly below state average. Hispanic race population percentage below state average. Foreign-born population percentage significantly below state average. Length of stay since moving in significantly above state average.
Top Patent Applicants
William C. Ketterer (5)
Ronald N. Kessler (5)
Joseph M. Lepley (4)
Matthew Flannery (3)
Anthony Raschilla (3)
Jimmie L. Hunt (2)
David Thomas Lepley (2)
Joseph J. Mrva (2)
Tom Illencik (2)
Jason Garrett Lisko (2)
Total of 46 patent applications in 2008-2024.
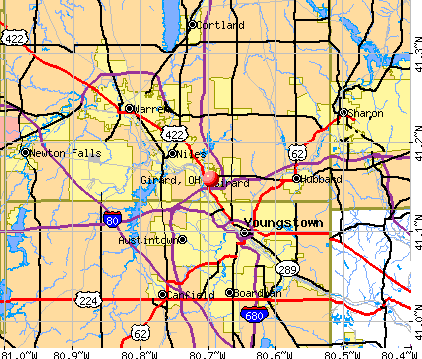


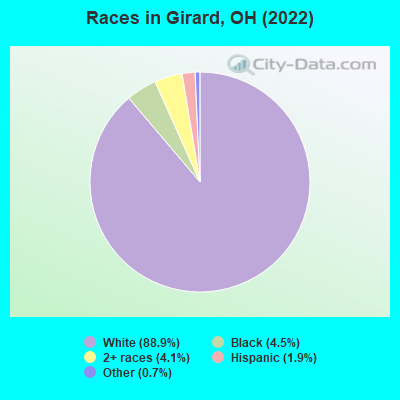
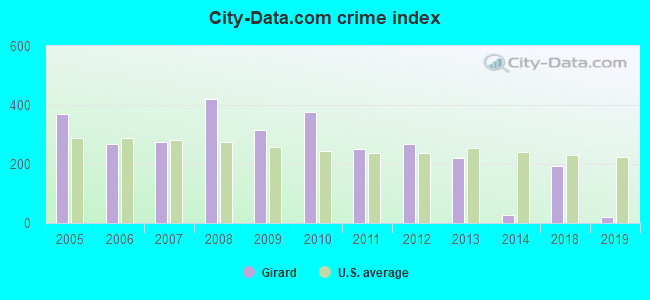
 Recent articles from our blog. Our writers, many of them Ph.D. graduates or candidates, create easy-to-read articles on a wide variety of topics.

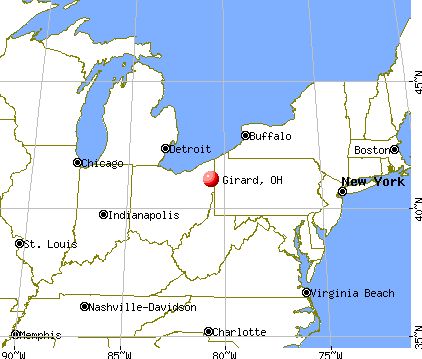
 (4.9 miles
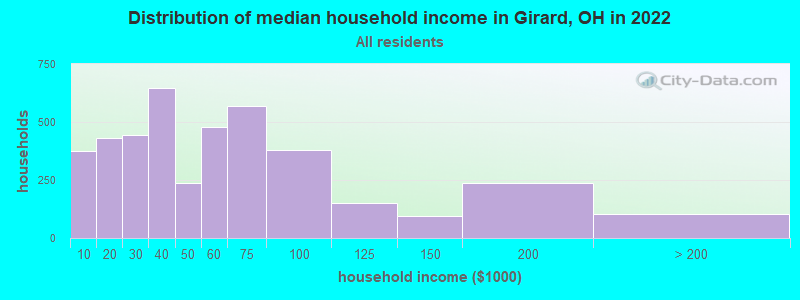
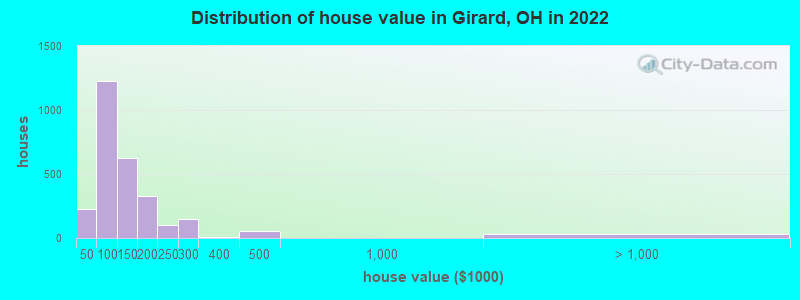
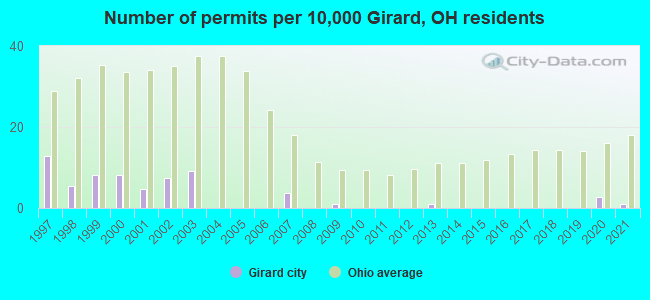
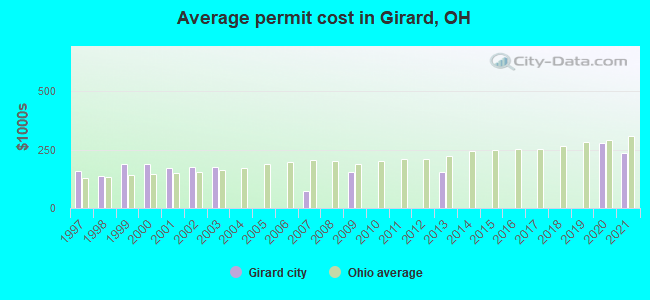
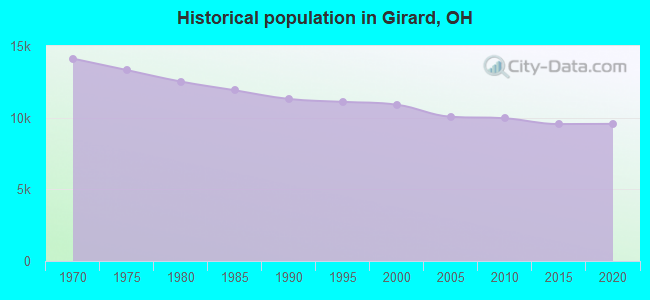
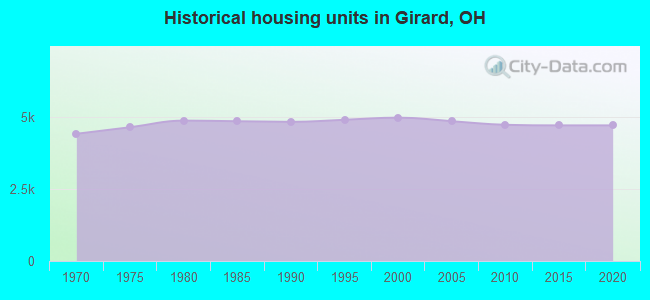
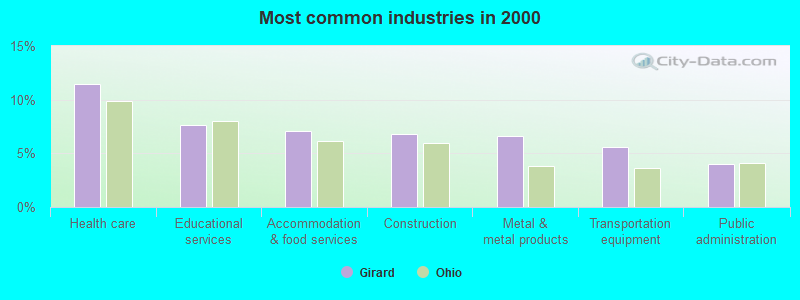
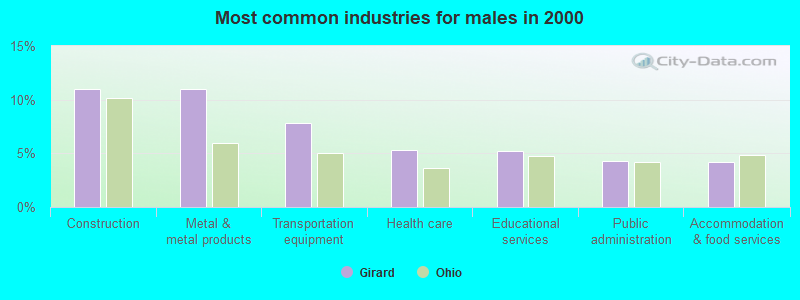
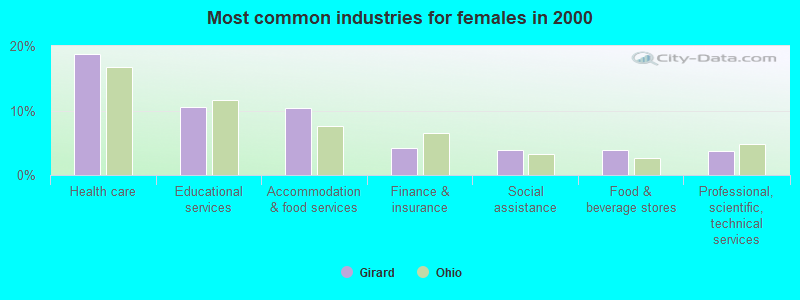
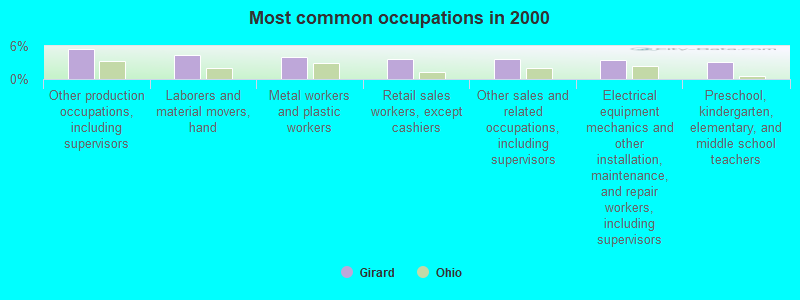
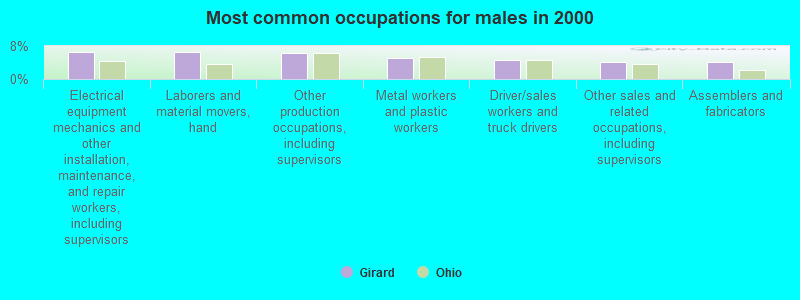
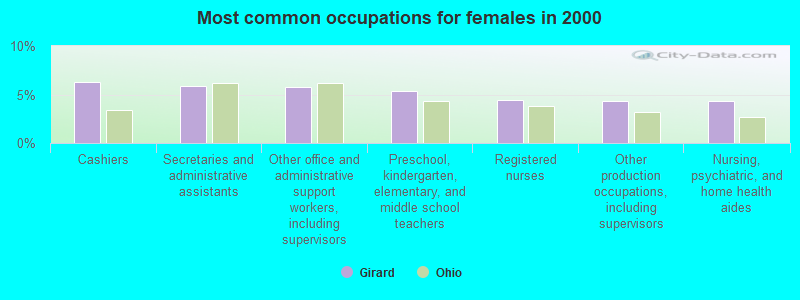


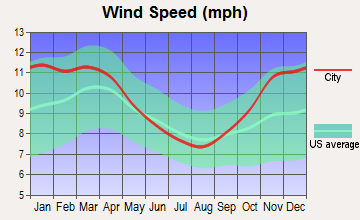


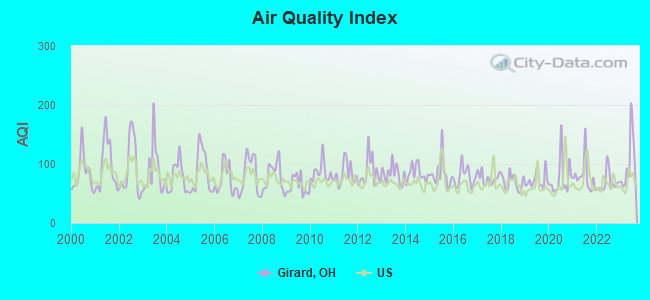
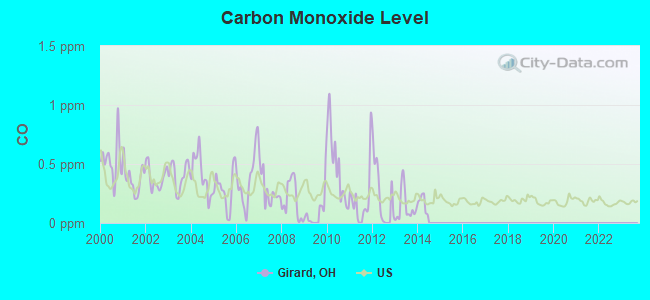
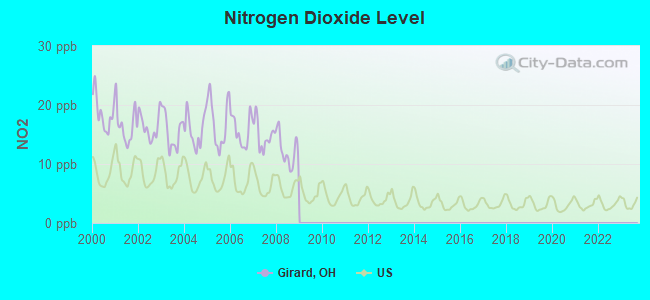
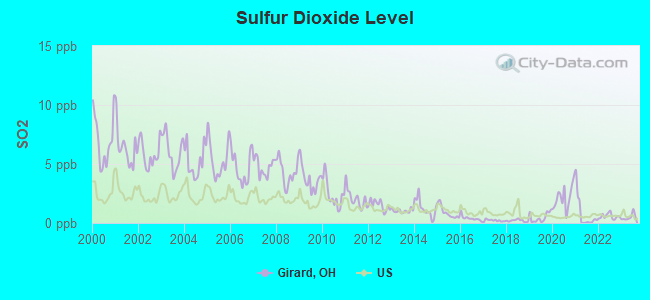
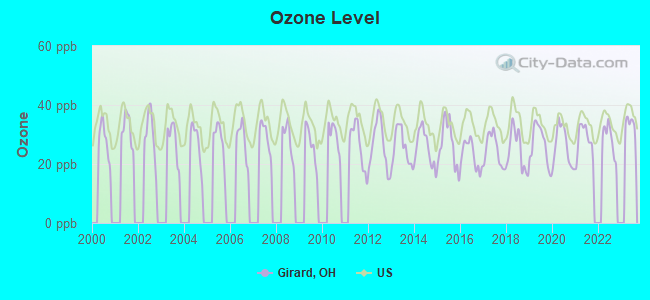
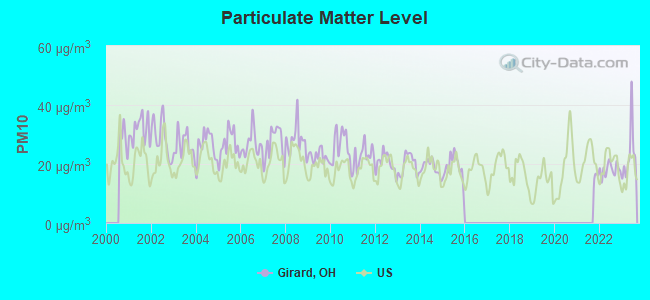
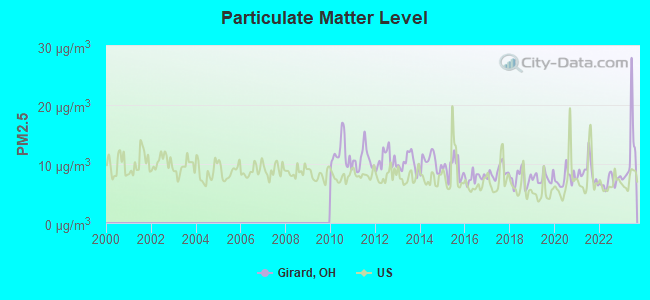

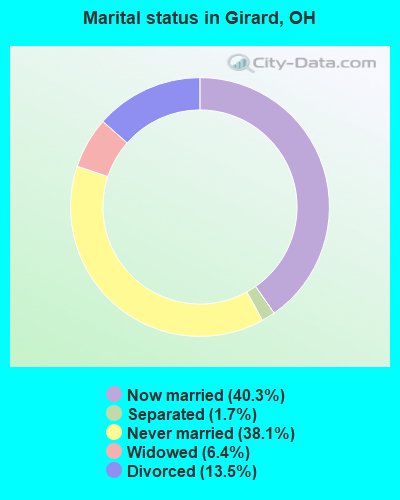
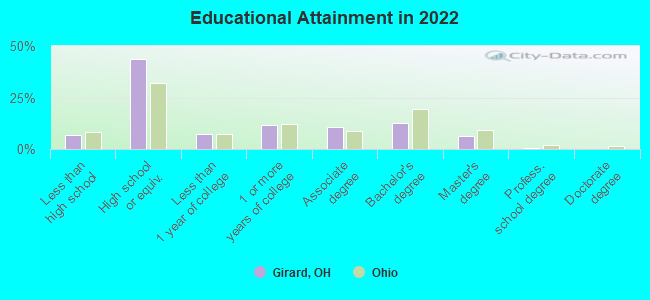
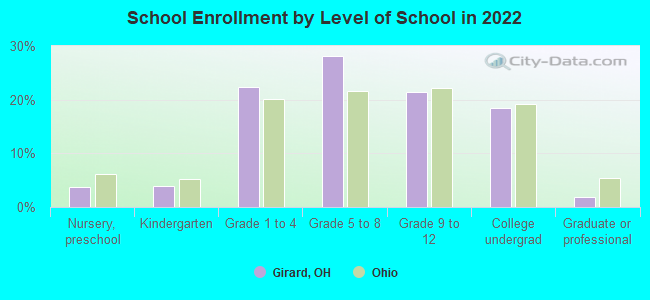
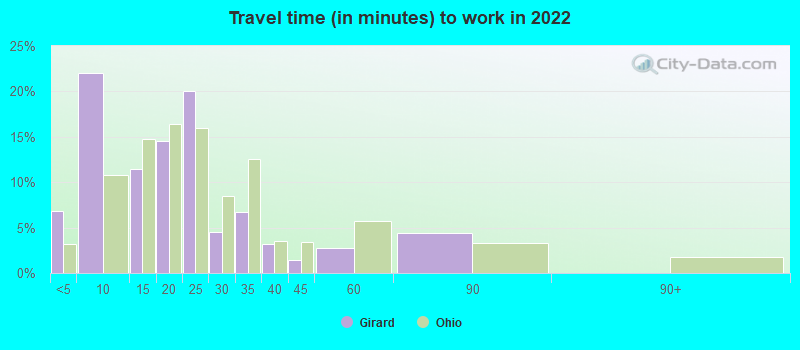
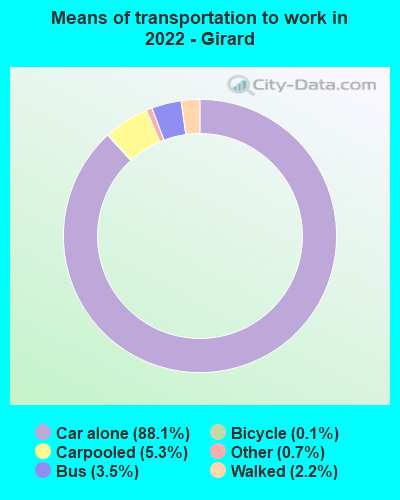
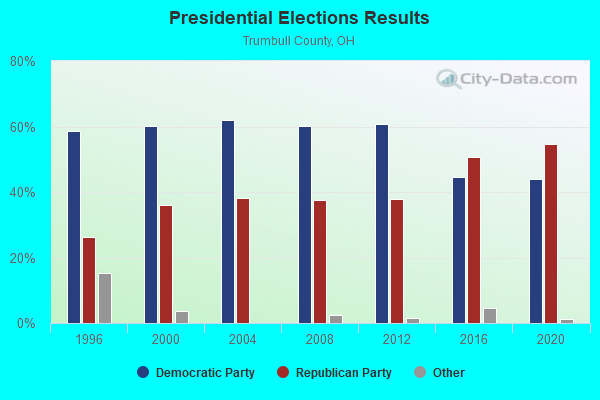
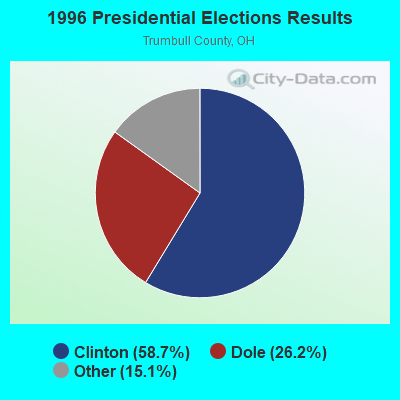
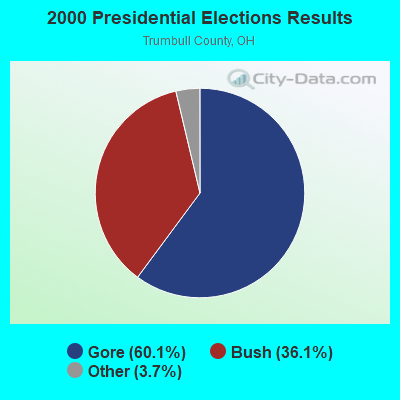
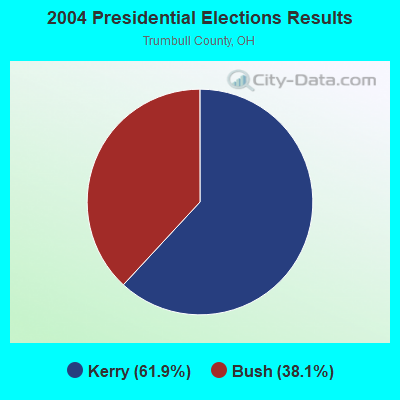
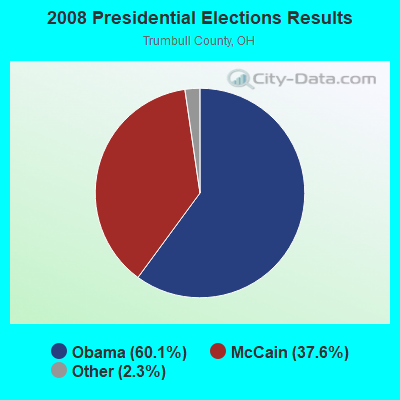
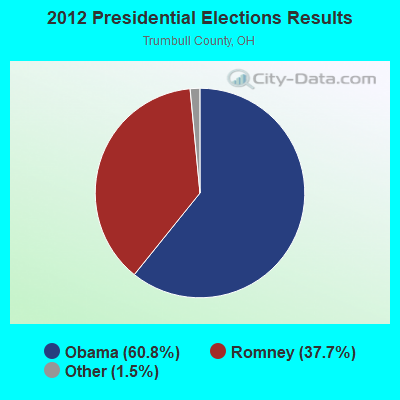
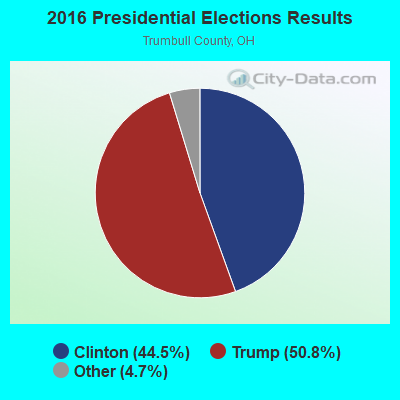
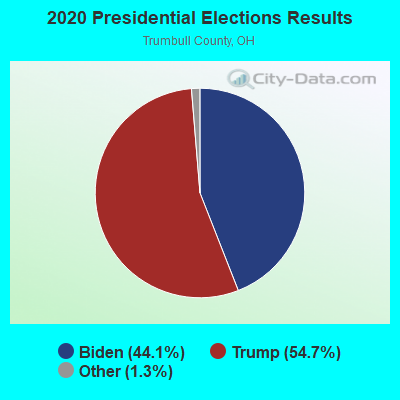
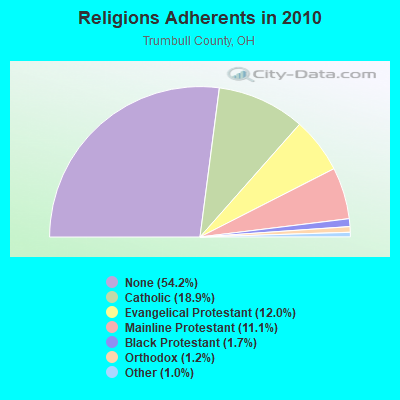
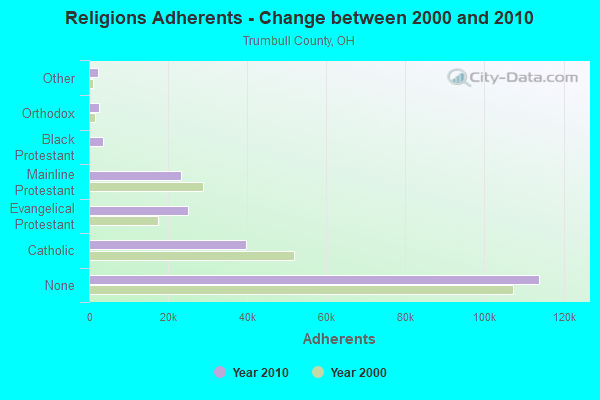
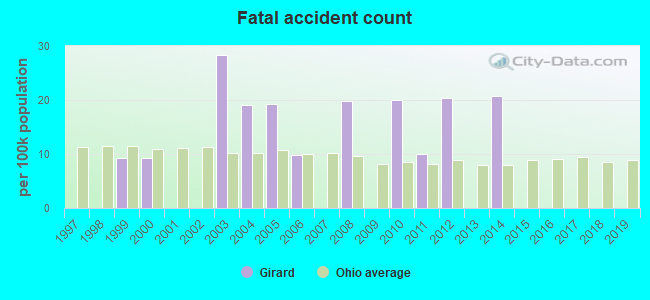
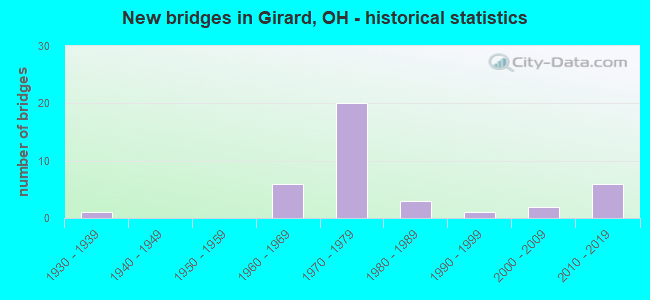
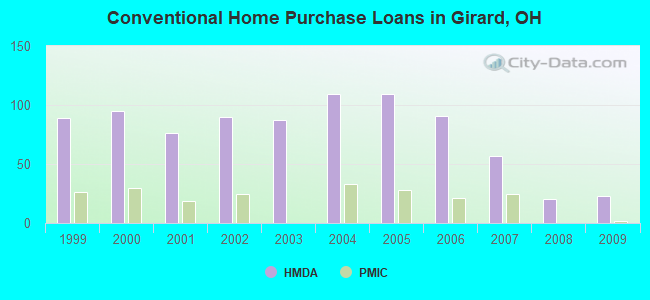
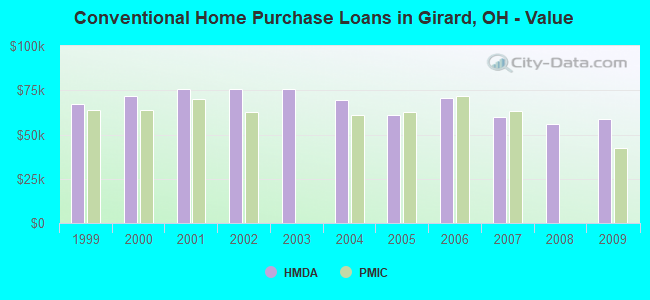
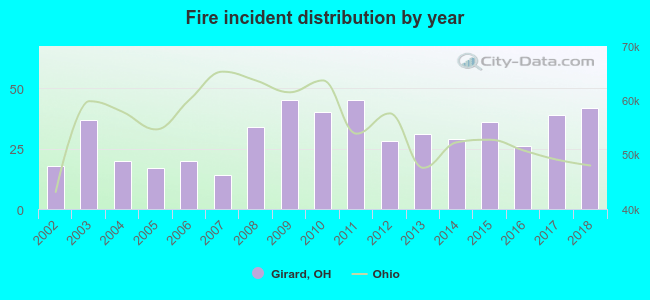 Based on the data from the years 2002 - 2018 the average number of fires per year is 31. The highest number of reported fires - 45 took place in 2009, and the least - 14 in 2007. The data has a rising trend.
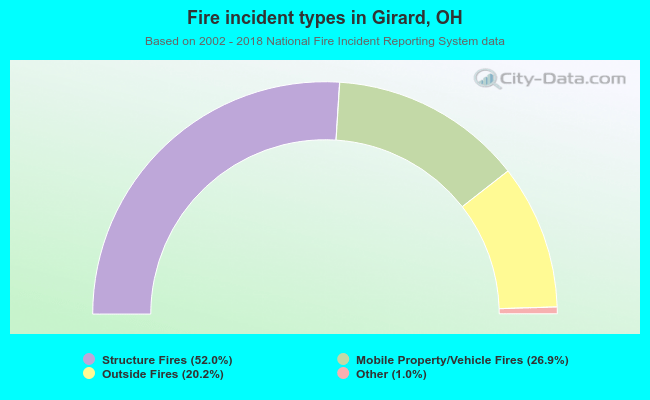 When looking into fire subcategories, the most incidents belonged to: Structure Fires (52.0%), and Mobile Property/Vehicle Fires (26.9%).