Estimated median house or condo value in 2022: $-720,726,635 (it was $96,200 in 2000)
Fort Dix:
$-720,726,635
NJ:
$428,900
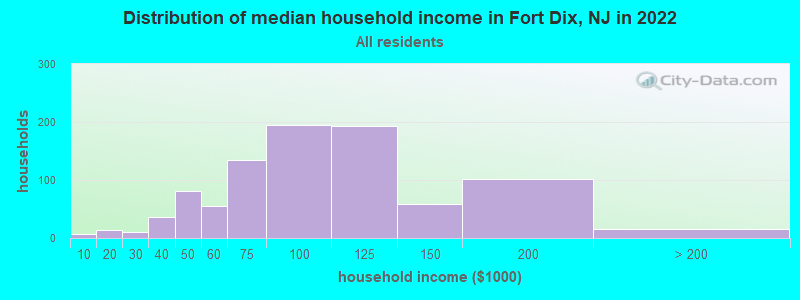
Mean prices in 2022:all housing units: $349,584; detached houses: $374,287; townhouses or other attached units: $267,082; in 2-unit structures: $173,034; in 3-to-4-unit structures: $422,231; in 5-or-more-unit structures: $166,955; mobile homes: $65,869
Median gross rent in 2022: $2,227.
March 2022 cost of living index in Fort Dix: -23091.0 (very low, U.S. average is 100)
Percentage of residents living in poverty in 2022: 5.3%
(3.4% for White Non-Hispanic residents, 14.1% for Black residents, 3.2% for Hispanic or Latino residents, 7.5% for two or more races residents)
According to our research of New Jersey and other state lists, there were 3 registered sex offenders living in Fort Dix, New Jersey as of June 05, 2024. The ratio of all residents to sex offenders in Fort Dix is 2,743 to 1. The ratio of registered sex offenders to all residents in this city is lower than the state average.
Recent articles from our blog. Our writers, many of them Ph.D. graduates or candidates, create easy-to-read articles on a wide variety of topics.
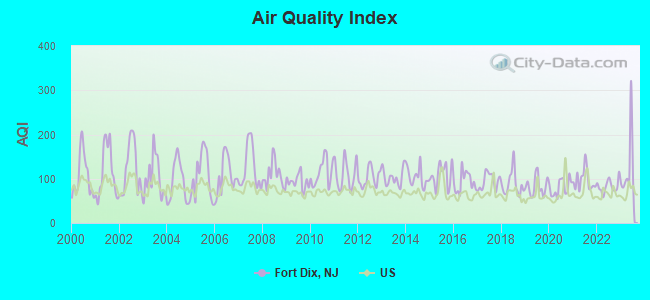
Air Quality Index (AQI) level in 2023 was 125. This is significantly worse than average.
City:
125
U.S.:
73
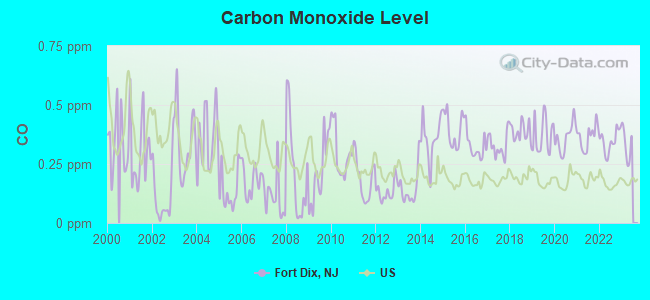
Carbon Monoxide (CO) [ppm] level in 2022 was 0.347. This is worse than average.Closest monitor was 9.4 miles away from the city center.
City:
0.347
U.S.:
0.251
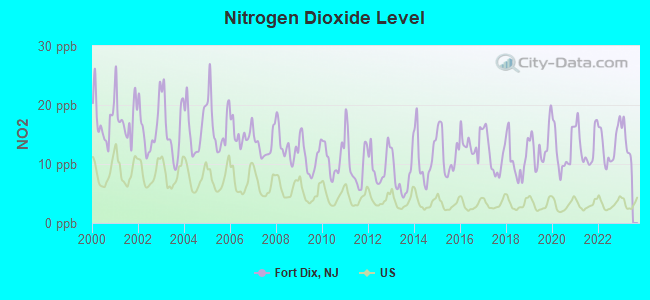
Nitrogen Dioxide (NO2) [ppb] level in 2022 was 13.2. This is significantly worse than average.Closest monitor was 3.3 miles away from the city center.
City:
13.2
U.S.:
5.1
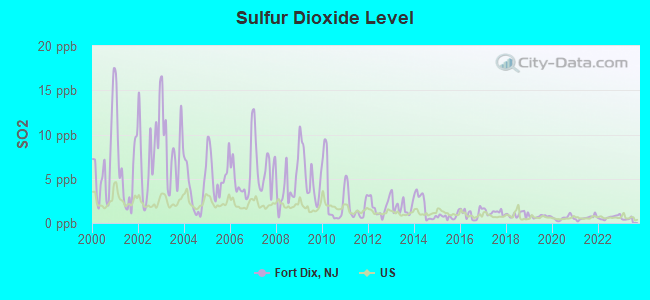
Sulfur Dioxide (SO2) [ppb] level in 2022 was 0.645. This is significantly better than average.Closest monitor was 3.3 miles away from the city center.
City:
0.645
U.S.:
1.515
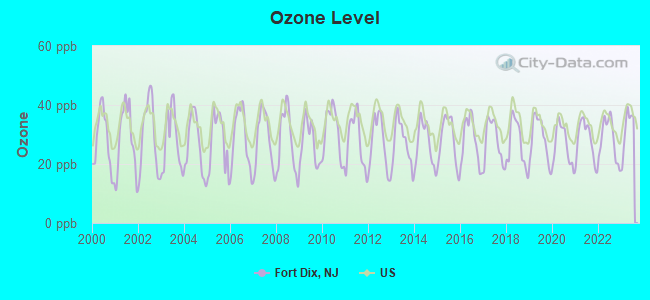
Ozone [ppb] level in 2023 was 31.9. This is about average.Closest monitor was 9.4 miles away from the city center.
City:
31.9
U.S.:
33.3
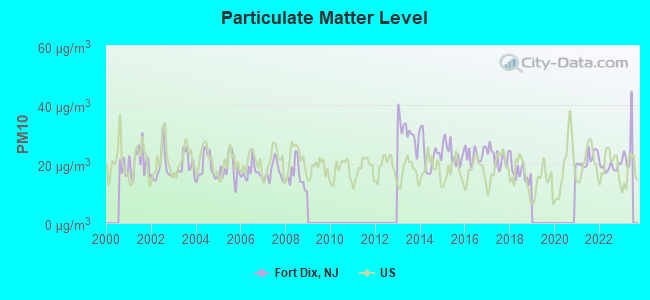
Particulate Matter (PM10) [µg/m3] level in 2022 was 18.9. This is about average.Closest monitor was 15.1 miles away from the city center.
City:
18.9
U.S.:
19.2
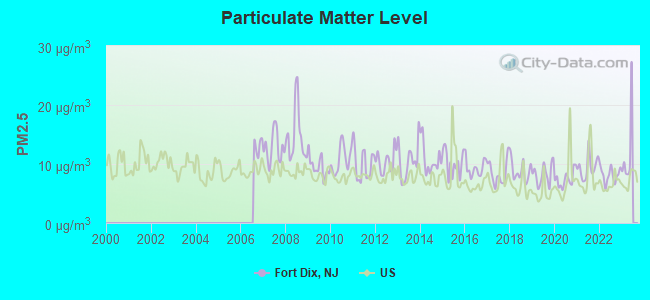
Particulate Matter (PM2.5) [µg/m3] level in 2022 was 8.17. This is about average.Closest monitor was 15.1 miles away from the city center.
City:
8.17
U.S.:
8.11
Tornado activity:
Fort Dix-area historical tornado activity is near New Jersey state average. It is 27% smaller than the overall U.S. average.
On 7/21/1983, a category F3 (max. wind speeds 158-206 mph) tornado 30.0 miles away from the Fort Dix place center causedbetween $500,000 and $5,000,000 in damages.
On 10/18/1990, a category F3 tornado 33.2 miles away from the place center injured 8 peopleand causedbetween $500,000 and $5,000,000 in damages.
Earthquake activity:
Fort Dix-area historical earthquake activity is significantly above New Jersey state average. It is 67% smaller than the overall U.S. average.
On 8/23/2011 at 17:51:04, a magnitude 5.8 (5.8 MW, Depth: 3.7 mi, Class: Moderate, Intensity: VI - VII) earthquake occurred 229.9 miles away from Fort Dix center On 1/16/1994 at 01:49:16, a magnitude 4.6 (4.6 MB, 4.6 LG, Depth: 3.1 mi, Class: Light, Intensity: IV - V) earthquake occurred 77.8 miles away from Fort Dix center On 10/7/1983 at 10:18:46, a magnitude 5.3 (5.1 MB, 5.3 LG, 5.1 ML) earthquake occurred 272.9 miles away from the city center On 1/16/1994 at 00:42:43, a magnitude 4.2 (4.2 MB, 4.0 LG, Depth: 3.1 mi) earthquake occurred 76.2 miles away from the city center On 11/30/2017 at 21:47:31, a magnitude 4.1 (4.1 MW, Depth: 6.1 mi) earthquake occurred 70.9 miles away from the city center On 4/20/2002 at 10:50:47, a magnitude 5.3 (5.3 ML, Depth: 3.0 mi) earthquake occurred 314.8 miles away from Fort Dix center Magnitude types: regional Lg-wave magnitude (LG), body-wave magnitude (MB), local magnitude (ML), moment magnitude (MW)
Natural disasters:
The number of natural disasters in Burlington County (27) is a lot greater than the US average (15). Major Disasters (Presidential) Declared: 16 Emergencies Declared: 9
Causes of natural disasters: Hurricanes: 6, Snowstorms: 6, Floods: 4, Storms: 4, Winter Storms: 4, Blizzards: 2, Heavy Rains: 2, Water Shortages: 2, Fire: 1, Tornado: 1, Tropical Storm: 1, Wind: 1, Other: 3 (Note: some incidents may be assigned to more than one category).
Hospitals and medical centers near Fort Dix:
DEBORAH HEART AND LUNG CENTER Acute Care Hospitals (about 4 miles away; BROWNS MILLS, NJ)
VIRTUA MEMORIAL HOSPITAL OF BURLINGTON COUNTY Acute Care Hospitals (about 10 miles away; MOUNT HOLLY, NJ)
VIRTUA HEALTH AND REHAB MT HOLLY (Nursing Home, about 10 miles away; LUMBERTON, NJ)
DVA LUMBERTON DIALYSIS CTR (Dialysis Facility, about 10 miles away; LUMBERTON, NJ)
UCPA OF QUEENS (Hospital, about 11 miles away; BELLEROSE, NY)
MASONIC HOME AND CHARITY FOUNDATION (Nursing Home, about 12 miles away; BURLINGTON, NJ)
MASONIC HOME OF NEW JERSEY (Nursing Home, about 12 miles away; BURLINGTON, NJ)
Amtrak station near Fort Dix:
16 miles: TRENTON (72 S. CLINTON AVE.) . Services: ticket office, fully wheelchair accessible, enclosed waiting area, public restrooms, public payphones, snack bar, ATM, paid short-term parking, paid long-term parking, car rental agency, taxi stand, public transit connection.
Colleges/universities with over 2000 students nearest to Fort Dix:
Burlington County College (about 4 miles; Pemberton, NJ; Full-time enrollment: 7,928)
Thomas Edison State College (about 17 miles; Trenton, NJ; FT enrollment: 4,972)
Mercer County Community College (about 17 miles; West Windsor, NJ; FT enrollment: 5,728)
The College of New Jersey (about 20 miles; Ewing, NJ; FT enrollment: 7,573)
Holy Family University (about 20 miles; Philadelphia, PA; FT enrollment: 2,305)
Rider University (about 20 miles; Lawrenceville, NJ; FT enrollment: 4,960)
Strayer University-Pennsylvania (about 20 miles; Trevose, PA; FT enrollment: 2,027)
Birthplace of: Franco Harris - Football player, Chad Lewis - 2005 NFL player (Philadelphia Eagles, born: Oct 5, 1971), Jay Berger - Tennis player, John W. Thompson - Chief executive, Priscilla Barnes - Actress, Ronald Noble - Lawyer, Bruce Hill (American football) - Football player, Kelvin Holly - Blues guitarist, LeRoy Irvin - Football player.
Burlington County has a predicted average indoor radon screening level between 2 and 4 pCi/L (pico curies per liter) - Moderate Potential
Drinking water stations with addresses in Fort Dix that have no violations reported:
ARMED FORCES RESERVE CENTER (Address: 5231 SOUTH SCOTT PLAZA , Serves VT, Population served: 105,Primary Water Source Type: Groundwater)
Average household size:
This place:
3.0 people
New Jersey:
2.7 people
Percentage of family households:
This place:
75.3%
Whole state:
69.3%
Percentage of households with unmarried partners:
This place:
1.9%
Whole state:
5.9%
Likely homosexual households (counted as self-reported same-sex unmarried-partner households)
Lesbian couples: 0.0% of all households
Gay men: 0.3% of all households
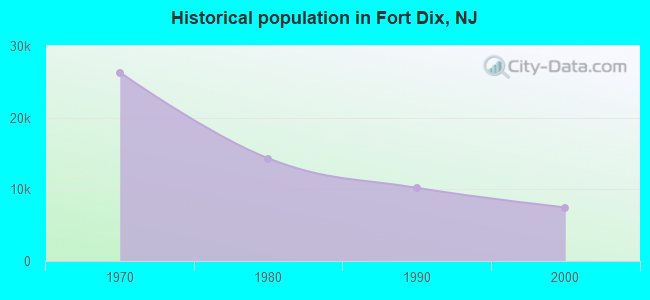
4,665 people in federal prisons in 2010
660 people in state prisons in 2010
People in group quarters in Fort Dix in 2000:
4,217 people in federal prisons and detention centers
619 people in state prisons
40 people in other noninstitutional group quarters
9 people in military barracks, etc.
Banks with branches in Fort Dix (2011 data):
Wells Fargo Bank, National Association: Fort Dix Branch at Doughboy & W 9th Street, branch established on 1949/05/16. Info updated 2011/04/05: Bank assets: $1,161,490.0 mil, Deposits: $905,653.0 mil, headquarters in Sioux Falls, SD, positive income, 6395 total offices, Holding Company: Wells Fargo & Company
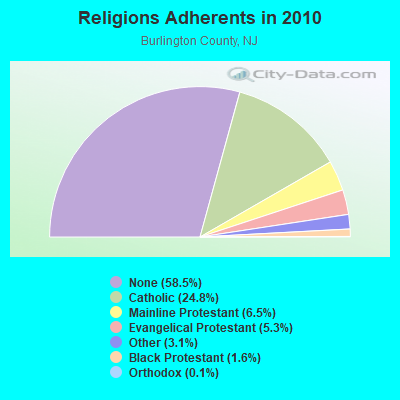
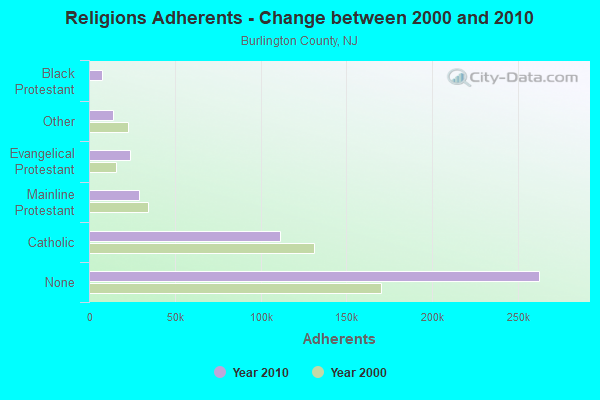
Religion statistics for Fort Dix, NJ (based on Burlington County data)
Religion
Adherents
Congregations
Catholic
111,334
22
Mainline Protestant
29,271
118
Evangelical Protestant
23,751
112
Other
13,995
32
Black Protestant
7,303
32
Orthodox
620
2
None
262,460
-
Source: Clifford Grammich, Kirk Hadaway, Richard Houseal, Dale E.Jones, Alexei Krindatch, Richie Stanley and Richard H.Taylor. 2012. 2010 U.S.Religion Census: Religious Congregations & Membership Study. Association of Statisticians of American Religious Bodies. Jones, Dale E., et al. 2002. Congregations and Membership in the United States 2000. Nashville, TN: Glenmary Research Center. Graphs represent county-level data
Call Sign: KF7RLJ, Licensee ID: L01659006, Grant Date: 07/07/2021, Expiration Date: 08/31/2031, Certifier: Austin C Sanders, Registrant: Austin C Sanders, 1268a Elm St, Fort Dix, NJ 08640
Call Sign: KE2CIS, Licensee ID: L02734109, Grant Date: 12/19/2023, Expiration Date: 12/19/2033, Certifier: Louis A Boudart, Registrant: Louis A Boudart, 1424 C Juniper St, Fort Dix, NJ 08640
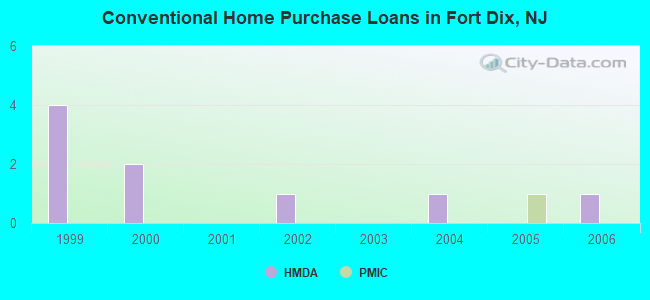
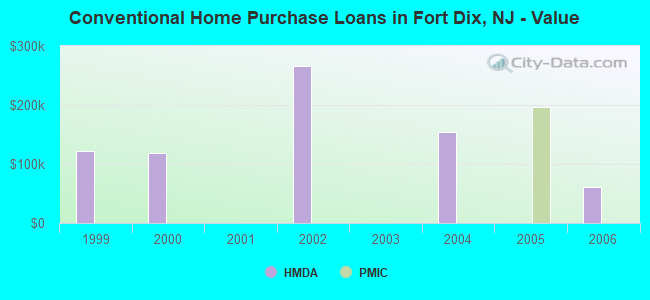
Home Mortgage Disclosure Act Aggregated Statistics For Year 2009 (Based on 2 partial tracts)
B) Conventional Home Purchase Loans
C) Refinancings
D) Home Improvement Loans
F) Non-occupant Loans on < 5 Family Dwellings (A B C & D)
Number
Average Value
Number
Average Value
Number
Average Value
Number
Average Value
LOANS ORIGINATED
0
$0
3
$145,697
0
$0
0
$0
APPLICATIONS APPROVED, NOT ACCEPTED
0
$0
0
$0
0
$0
0
$0
APPLICATIONS DENIED
1
$93,940
1
$149,440
1
$6,030
1
$68,510
APPLICATIONS WITHDRAWN
0
$0
1
$133,170
0
$0
0
$0
FILES CLOSED FOR INCOMPLETENESS
0
$0
1
$174,300
0
$0
0
$0
Aggregated Statistics For Year 2008 (Based on 2 partial tracts)
B) Conventional Home Purchase Loans
C) Refinancings
D) Home Improvement Loans
Number
Average Value
Number
Average Value
Number
Average Value
LOANS ORIGINATED
0
$0
0
$0
1
$34,410
APPLICATIONS APPROVED, NOT ACCEPTED
0
$0
0
$0
0
$0
APPLICATIONS DENIED
1
$44,940
1
$128,800
1
$1,100
APPLICATIONS WITHDRAWN
1
$201,060
0
$0
0
$0
FILES CLOSED FOR INCOMPLETENESS
0
$0
0
$0
0
$0
Aggregated Statistics For Year 2007 (Based on 2 partial tracts)
B) Conventional Home Purchase Loans
C) Refinancings
D) Home Improvement Loans
F) Non-occupant Loans on < 5 Family Dwellings (A B C & D)
Number
Average Value
Number
Average Value
Number
Average Value
Number
Average Value
LOANS ORIGINATED
0
$0
3
$120,097
0
$0
0
$0
APPLICATIONS APPROVED, NOT ACCEPTED
0
$0
0
$0
0
$0
0
$0
APPLICATIONS DENIED
1
$50,470
2
$108,900
1
$103,040
1
$5,480
APPLICATIONS WITHDRAWN
0
$0
2
$118,390
0
$0
0
$0
FILES CLOSED FOR INCOMPLETENESS
0
$0
0
$0
0
$0
0
$0
Aggregated Statistics For Year 2006 (Based on 2 partial tracts)
B) Conventional Home Purchase Loans
C) Refinancings
D) Home Improvement Loans
F) Non-occupant Loans on < 5 Family Dwellings (A B C & D)
G) Loans On Manufactured Home Dwelling (A B C & D)
Number
Average Value
Number
Average Value
Number
Average Value
Number
Average Value
Number
Average Value
LOANS ORIGINATED
1
$61,590
2
$50,245
1
$176,020
1
$59,190
1
$27,180
APPLICATIONS APPROVED, NOT ACCEPTED
1
$44,940
0
$0
1
$27,410
0
$0
1
$44,940
APPLICATIONS DENIED
1
$48,520
2
$146,345
2
$90,780
1
$59,190
1
$48,520
APPLICATIONS WITHDRAWN
3
$199,000
0
$0
0
$0
1
$165,870
0
$0
FILES CLOSED FOR INCOMPLETENESS
1
$208,080
1
$191,840
0
$0
0
$0
0
$0
Aggregated Statistics For Year 2005 (Based on 2 partial tracts)
B) Conventional Home Purchase Loans
C) Refinancings
D) Home Improvement Loans
F) Non-occupant Loans on < 5 Family Dwellings (A B C & D)
G) Loans On Manufactured Home Dwelling (A B C & D)
Number
Average Value
Number
Average Value
Number
Average Value
Number
Average Value
Number
Average Value
LOANS ORIGINATED
0
$0
1
$205,040
1
$16,390
0
$0
0
$0
APPLICATIONS APPROVED, NOT ACCEPTED
0
$0
1
$144,190
1
$28,590
0
$0
0
$0
APPLICATIONS DENIED
4
$86,575
3
$115,340
0
$0
0
$0
3
$60,520
APPLICATIONS WITHDRAWN
3
$117,280
3
$68,017
0
$0
1
$63,610
0
$0
FILES CLOSED FOR INCOMPLETENESS
0
$0
1
$228,560
0
$0
0
$0
0
$0
Aggregated Statistics For Year 2004 (Based on 1 full and 2 partial tracts)
A) FHA, FSA/RHS & VA Home Purchase Loans
B) Conventional Home Purchase Loans
C) Refinancings
D) Home Improvement Loans
F) Non-occupant Loans on < 5 Family Dwellings (A B C & D)
Number
Average Value
Number
Average Value
Number
Average Value
Number
Average Value
Number
Average Value
LOANS ORIGINATED
0
$0
1
$153,980
5
$71,830
1
$61,540
1
$42,200
APPLICATIONS APPROVED, NOT ACCEPTED
0
$0
0
$0
1
$172,050
0
$0
0
$0
APPLICATIONS DENIED
1
$170,860
1
$210,470
1
$137,570
3
$16,510
1
$65,770
APPLICATIONS WITHDRAWN
1
$81,670
0
$0
1
$279,640
1
$140,860
0
$0
FILES CLOSED FOR INCOMPLETENESS
0
$0
0
$0
0
$0
0
$0
0
$0
Aggregated Statistics For Year 2003 (Based on 1 full and 2 partial tracts)
B) Conventional Home Purchase Loans
C) Refinancings
D) Home Improvement Loans
E) Loans on Dwellings For 5+ Families
F) Non-occupant Loans on < 5 Family Dwellings (A B C & D)
Number
Average Value
Number
Average Value
Number
Average Value
Number
Average Value
Number
Average Value
LOANS ORIGINATED
0
$0
7
$129,216
0
$0
1
$63,580
0
$0
APPLICATIONS APPROVED, NOT ACCEPTED
0
$0
1
$62,970
0
$0
0
$0
0
$0
APPLICATIONS DENIED
0
$0
1
$8,390
1
$17,540
0
$0
1
$4,930
APPLICATIONS WITHDRAWN
1
$51,520
3
$113,180
0
$0
0
$0
0
$0
FILES CLOSED FOR INCOMPLETENESS
0
$0
1
$71,250
0
$0
0
$0
0
$0
Aggregated Statistics For Year 2002 (Based on 1 partial tract)
B) Conventional Home Purchase Loans
C) Refinancings
D) Home Improvement Loans
Number
Average Value
Number
Average Value
Number
Average Value
LOANS ORIGINATED
1
$266,920
2
$100,850
1
$8,220
APPLICATIONS APPROVED, NOT ACCEPTED
0
$0
0
$0
0
$0
APPLICATIONS DENIED
1
$10,960
1
$30,690
1
$8,220
APPLICATIONS WITHDRAWN
1
$13,150
0
$0
0
$0
FILES CLOSED FOR INCOMPLETENESS
0
$0
0
$0
0
$0
Aggregated Statistics For Year 2001 (Based on 1 partial tract)
B) Conventional Home Purchase Loans
C) Refinancings
D) Home Improvement Loans
Number
Average Value
Number
Average Value
Number
Average Value
LOANS ORIGINATED
0
$0
1
$92,630
1
$77,830
APPLICATIONS APPROVED, NOT ACCEPTED
0
$0
2
$57,550
0
$0
APPLICATIONS DENIED
1
$48,780
0
$0
0
$0
APPLICATIONS WITHDRAWN
0
$0
1
$32,890
0
$0
FILES CLOSED FOR INCOMPLETENESS
0
$0
0
$0
0
$0
Aggregated Statistics For Year 2000 (Based on 1 partial tract)
B) Conventional Home Purchase Loans
C) Refinancings
D) Home Improvement Loans
F) Non-occupant Loans on < 5 Family Dwellings (A B C & D)
Number
Average Value
Number
Average Value
Number
Average Value
Number
Average Value
LOANS ORIGINATED
2
$118,115
1
$45,490
1
$16,440
1
$45,490
APPLICATIONS APPROVED, NOT ACCEPTED
0
$0
0
$0
0
$0
0
$0
APPLICATIONS DENIED
2
$91,805
2
$83,585
1
$2,740
0
$0
APPLICATIONS WITHDRAWN
0
$0
1
$68,510
0
$0
0
$0
FILES CLOSED FOR INCOMPLETENESS
0
$0
0
$0
0
$0
0
$0
Aggregated Statistics For Year 1999 (Based on 1 full and 3 partial tracts)
#2 on the list of "Top 101 cities with the largest percentage of people in federal prisons and detention centers (population 1,000+)"
#2 on the list of "Top 101 cities with the smallest household incomes disparities (population 5,000+)"
#9 on the list of "Top 101 cities with largest percentage of males in occupations: installation, maintenance, and repair occupations (population 5,000+)"
#12 on the list of "Top 101 cities with the smallest house values disparities (population 5,000+)"
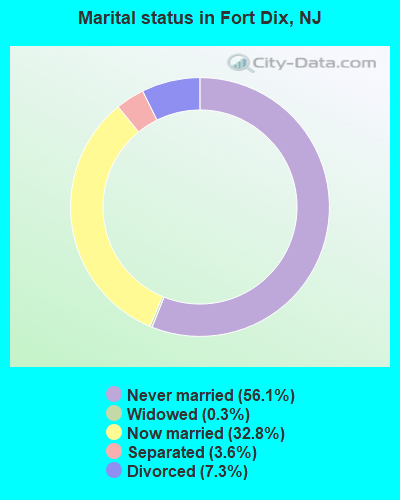
#12 on the list of "Top 101 cities with the largest positive percentage difference between never married males and females (15+ years) (with at least 1,000 males never married)"
#22 on the list of "Top 101 cities with largest percentage of females in occupations: installation, maintenance, and repair occupations (population 5,000+)"
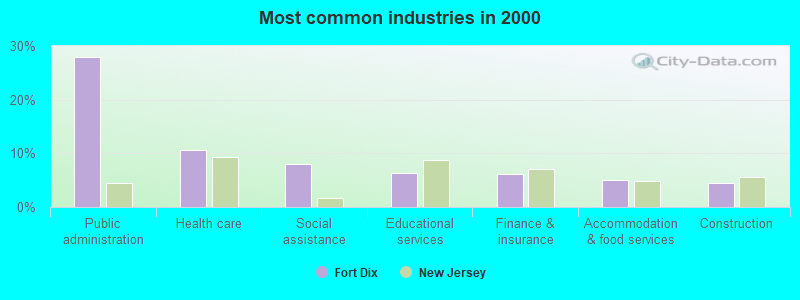
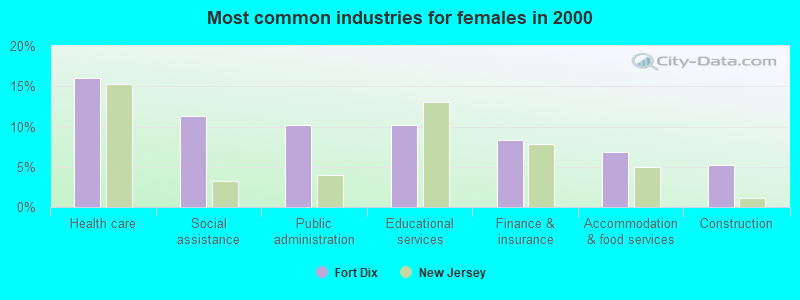
#22 on the list of "Top 101 cities with largest percentage of females in industries: public administration (population 5,000+)"
#22 on the list of "Top 100 cities with the largest percentage of males"
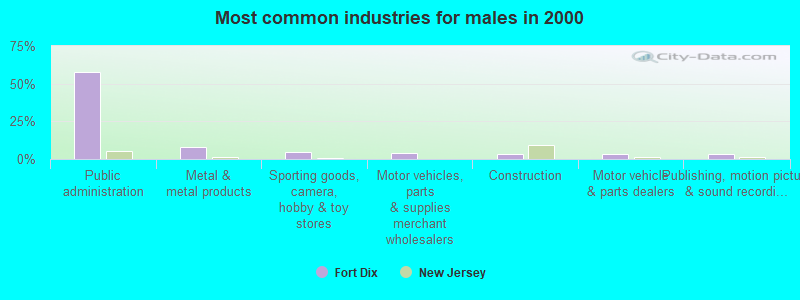
#29 on the list of "Top 101 cities with largest percentage of males in industries: public administration (population 5,000+)"
#53 on the list of "Top 101 cities with largest percentage of females in occupations: management occupations (population 5,000+)"
#58 on the list of "Top 100 cities with highest percentage of renters"
#2 (08641) on the list of "Top 101 zip codes with the largest percentage of returns reporting salary or wage in 2012 (pop 1,000+)"
#27 (08640) on the list of "Top 101 zip codes with the lowest 2012 average reported profit/loss from business (pop 5,000+)"
#34 (08640) on the list of "Top 101 zip codes with the smallest percentage of taxpayers reporting profit/loss from business in 2012 (pop 5,000+)"
#48 (08641) on the list of "Top 101 zip codes with the smallest percentage of taxpayers using paid preparers for 2012 taxes (pop 5,000+)"
#64 (08640) on the list of "Top 101 zip codes with the lowest 2012 average taxable interest for individuals (pop 5,000+)"
#77 (08641) on the list of "Top 101 zip codes with the smallest percentage of taxpayers using charity contributions deductions in 2012 (pop 5,000+)"
#92 (08641) on the list of "Top 101 zip codes with the lowest charity contributions deductions as a percentage of AGI in 2012 (pop 5,000+)"
#43 on the list of "Top 101 counties with the highest average weight of females"
#46 on the list of "Top 101 counties with the lowest percentage of residents that keep firearms around their homes"
#50 on the list of "Top 101 counties with the highest percentage of residents that visited a dentist within the past year"
#68 on the list of "Top 101 counties with the lowest number of infant deaths per 1000 residents 2007-2013 (pop. 50,000+)"
#77 on the list of "Top 101 counties with the highest ground withdrawal of fresh water for public supply (pop. 50,000+)"


 Recent articles from our blog. Our writers, many of them Ph.D. graduates or candidates, create easy-to-read articles on a wide variety of topics.

 (15.4 miles