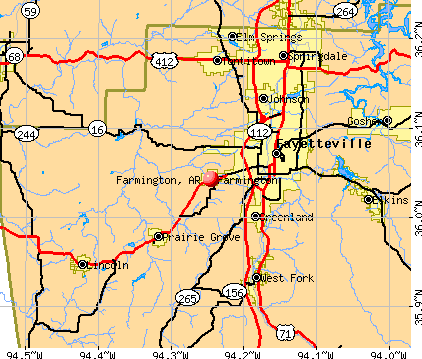
Farmington, Arkansas
Submit your own pictures of this city and show them to the world
- OSM Map
- General Map
- Google Map
- MSN Map
Population change since 2000: +159.0%
| Males: 4,475 | |
| Females: 4,861 |
| Median resident age: | 34.6 years |
| Arkansas median age: | 38.9 years |
Zip codes: 72704, 72730, 72753.
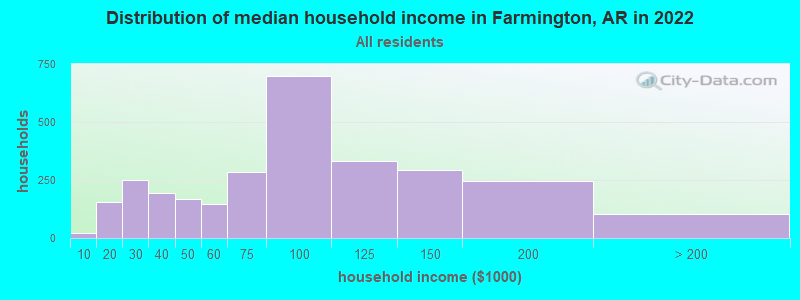
Farmington Zip Code Map| Farmington: | $82,714 |
| AR: | $55,432 |
Estimated per capita income in 2022: $30,839 (it was $15,387 in 2000)
Farmington city income, earnings, and wages data
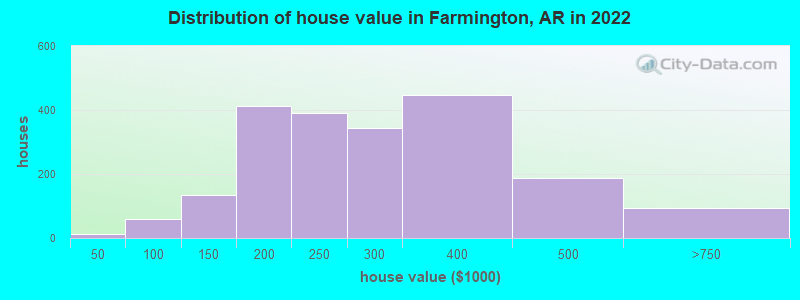
Estimated median house or condo value in 2022: $260,425 (it was $78,700 in 2000)
| Farmington: | $260,425 |
| AR: | $179,800 |
Mean prices in 2022: all housing units: $308,680; detached houses: $322,805; townhouses or other attached units: $275,976; in 2-unit structures: $230,059; in 3-to-4-unit structures: $264,045; in 5-or-more-unit structures: $191,912; mobile homes: $99,065; occupied boats, rvs, vans, etc.: $191,577
Median gross rent in 2022: $1,074.
(2.2% for White Non-Hispanic residents, 2.9% for Hispanic or Latino residents, 14.1% for American Indian residents, 4.7% for other race residents, 15.7% for two or more races residents)
Detailed information about poverty and poor residents in Farmington, AR

Compare current foreclosures near Farmington, AR:
| Photo | Address | Area | Beds / Baths | Price | Details |
|---|---|---|---|---|---|

|
#1
Pine Meadow Dr
Farmington, AR 72730
|
2,120 sq. feet
|
3 baths 4 beds |
show details | |

|
#2
Samuel Pl
Farmington, AR 72730
|
1,084 sq. feet
|
2 baths - beds |
show details | |

|
#3
N Double Springs Rd
Farmington, AR 72730
|
1,170 sq. feet
|
1 baths - beds |
show details | |

|
#4
Hawkins St
Farmington, AR 72730
|
1,661 sq. feet
|
2 baths - beds |
show details | |

|
#5
Payne Stewart Dr
Farmington, AR 72730
|
1,949 sq. feet
|
2 baths - beds |
show details | |

|
#6
S Appleby Rd
Farmington, AR 72730
|
1,832 sq. feet
|
2 baths - beds |
show details | |

|
#7
Wolfdale Rd
Farmington, AR 72730
|
1,878 sq. feet
|
2 baths - beds |
show details | |

|
#8
Cynthia Ave
Farmington, AR 72730
|
1,488 sq. feet
|
1 baths - beds |
show details | |

|
#9
Briarmeadow St
Farmington, AR 72730
|
1,416 sq. feet
|
2 baths - beds |
show details | |

|
#10
Samuel Pl
Farmington, AR 72730
|
1,050 sq. feet
|
2 baths - beds |
show details |
| Photo | Address | Area | Beds / Baths | Price | Details |
|---|---|---|---|---|---|

|
#11
Wedgeview Dr
Farmington, AR 72730
|
2,168 sq. feet
|
2 baths - beds |
show details | |

|
#12
Pennsylvania Ave
Farmington, AR 72730
|
- sq. feet
|
- baths - beds |
show details | |

|
#13
S Emerald Woods Run
Farmington, AR 72730
|
- sq. feet
|
- baths - beds |
show details | |

|
#14
Richardson Rd
Farmington, AR 72730
|
- sq. feet
|
- baths - beds |
show details | |

|
#15
Richardson Rd
Farmington, AR 72730
|
- sq. feet
|
- baths - beds |
show details | |

|
#16
E Creek Ln
Farmington, AR 72730
|
- sq. feet
|
- baths - beds |
show details | |

|
#17
N Greylag Way
Farmington, AR 72730
|
- sq. feet
|
- baths - beds |
show details | |

|
#18
Bethel Blacktop Rd
Farmington, AR 72730
|
- sq. feet
|
- baths - beds |
show details | |

|
#19
Briarhill Dr
Farmington, AR 72730
|
- sq. feet
|
- baths - beds |
show details | |

|
#20
Sweetwater Way
Farmington, AR 72730
|
- sq. feet
|
- baths - beds |
show details |
| Photo | Address | Area | Beds / Baths | Price | Details |
|---|---|---|---|---|---|

|
#21
La Riata St
Farmington, AR 72730
|
- sq. feet
|
- baths - beds |
show details | |

|
#22
S Highway 71
Winslow, AR 72959
|
2,213 sq. feet
|
2 baths 3 beds |
$394,900
|
show details |

|
#23
Eagle Ridge Dr
Farmington, AR 72730
|
- sq. feet
|
- baths - beds |
show details | |

|
#24
Bruce Rutherford Dr
Siloam Springs, AR 72761
|
2,098 sq. feet
|
2 baths 4 beds |
show details | |

|
#25
Topaz St
Lowell, AR 72745
|
1,474 sq. feet
|
2 baths 3 beds |
show details | |

|
#26
Shoffner Ln
Elkins, AR 72727
|
1,891 sq. feet
|
2 baths 4 beds |
show details | |

|
#27
S Old Cincinnati Rd
Lincoln, AR 72744
|
728 sq. feet
|
2 baths 3 beds |
show details | |

|
#28
Excalibur Dr
Springdale, AR 72762
|
3,659 sq. feet
|
3 baths 5 beds |
show details | |

|
#29
Bernice Ave
Springdale, AR 72762
|
1,944 sq. feet
|
2 baths 3 beds |
show details | |

|
#30
N Shetland Dr
Fayetteville, AR 72704
|
1,447 sq. feet
|
2 baths 3 beds |
show details |
| Photo | Address | Area | Beds / Baths | Price | Details |
|---|---|---|---|---|---|

|
#31
N Summit St
Prairie Grove, AR 72753
|
1,080 sq. feet
|
1 baths 3 beds |
show details | |

|
#32
Richland Creek Ave
Elkins, AR 72727
|
1,286 sq. feet
|
2 baths 3 beds |
show details | |

|
#33
Frisco Track Trce
Elkins, AR 72727
|
1,367 sq. feet
|
2 baths 3 beds |
show details | |

|
#34
Haywood Cv
Springdale, AR 72764
|
1,847 sq. feet
|
2 baths 3 beds |
show details | |

|
#35
W Wheeler Rd
Fayetteville, AR 72704
|
1,853 sq. feet
|
2 baths - beds |
show details | |

|
#36
S Ed Edwards Rd
Fayetteville, AR 72701
|
1,902 sq. feet
|
2 baths 3 beds |
show details | |

|
#37
Wildcat Creek Blvd
Springdale, AR 72762
|
2,195 sq. feet
|
2 baths - beds |
show details | |

|
#38
E Lawndale Dr
Fayetteville, AR 72701
|
1,306 sq. feet
|
2 baths 3 beds |
show details | |

|
#39
Remington St
Springdale, AR 72764
|
1,309 sq. feet
|
2 baths 3 beds |
show details | |

|
#40
N Boxley Ave
Fayetteville, AR 72704
|
1,370 sq. feet
|
2 baths 3 beds |
show details |
| Photo | Address | Area | Beds / Baths | Price | Details |
|---|---|---|---|---|---|

|
#41
Jims Pl
Springdale, AR 72762
|
1,806 sq. feet
|
2 baths - beds |
show details | |

|
#42
Oneal Ln
Elkins, AR 72727
|
1,170 sq. feet
|
2 baths - beds |
show details | |

|
#43
Tyler Pl
Springdale, AR 72764
|
2,235 sq. feet
|
2 baths - beds |
show details | |

|
#44
Jean St
Springdale, AR 72762
|
1,043 sq. feet
|
1 baths - beds |
show details | |

|
#45
Midway Ave
Springdale, AR 72764
|
648 sq. feet
|
1 baths - beds |
show details | |

|
#46
E Antlers Ct
Fayetteville, AR 72701
|
1,884 sq. feet
|
2 baths - beds |
show details | |

|
#47
Old Highway 68
Siloam Springs, AR 72761
|
988 sq. feet
|
2 baths - beds |
show details | |

|
#48
Hemlock Pl
Springdale, AR 72764
|
976 sq. feet
|
2 baths - beds |
show details | |

|
#49
S Tallgrass Dr
Fayetteville, AR 72701
|
2,003 sq. feet
|
2 baths - beds |
show details | |

|
Check over 1 million property listings on Foreclosure.com!
|
browse all offers | |||


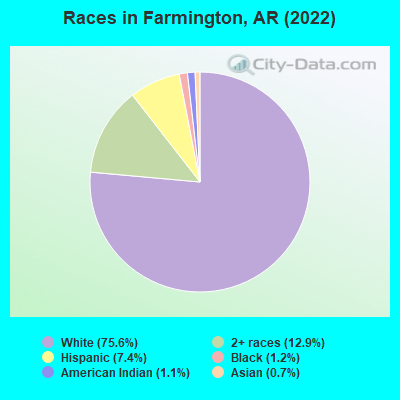
- 6,25775.6%White alone
- 1,06612.9%Two or more races
- 6087.4%Hispanic
- 991.2%Black alone
- 951.1%American Indian alone
- 620.7%Asian alone
According to our research of Arkansas and other state lists, there were 9 registered sex offenders living in Farmington, Arkansas as of June 05, 2024.
The ratio of all residents to sex offenders in Farmington is 745 to 1.
The ratio of registered sex offenders to all residents in this city is lower than the state average.
Type |
2009 |
2010 |
2011 |
2012 |
2013 |
2014 |
2015 |
2016 |
2017 |
2018 |
2019 |
2020 |
2021 |
2022 |
|---|---|---|---|---|---|---|---|---|---|---|---|---|---|---|
| Murders (per 100,000) | 0 (0.0) | 0 (0.0) | 0 (0.0) | 0 (0.0) | 1 (16.1) | 0 (0.0) | 0 (0.0) | 0 (0.0) | 3 (43.2) | 0 (0.0) | 0 (0.0) | 0 (0.0) | 0 (0.0) | 0 (0.0) |
| Rapes (per 100,000) | 2 (41.6) | 2 (33.5) | 6 (99.7) | 2 (32.6) | 7 (112.4) | 6 (94.0) | 2 (30.3) | 4 (58.4) | 8 (115.1) | 3 (42.7) | 14 (189.5) | 7 (92.4) | 8 (103.3) | 6 (67.7) |
| Robberies (per 100,000) | 1 (20.8) | 1 (16.7) | 2 (33.2) | 0 (0.0) | 1 (16.1) | 1 (15.7) | 1 (15.1) | 0 (0.0) | 2 (28.8) | 1 (14.2) | 3 (40.6) | 1 (13.2) | 1 (12.9) | 2 (22.6) |
| Assaults (per 100,000) | 5 (104.1) | 9 (150.7) | 13 (216.0) | 27 (440.2) | 13 (208.7) | 3 (47.0) | 6 (90.9) | 27 (394.0) | 11 (158.3) | 12 (170.6) | 16 (216.6) | 9 (118.8) | 11 (142.0) | 7 (79.0) |
| Burglaries (per 100,000) | 30 (624.7) | 35 (585.9) | 29 (481.8) | 29 (472.9) | 16 (256.8) | 305 (4,778) | 15 (227.2) | 23 (335.7) | 23 (331.0) | 19 (270.2) | 8 (108.3) | 18 (237.6) | 19 (245.2) | 14 (158.0) |
| Thefts (per 100,000) | 87 (1,812) | 89 (1,490) | 78 (1,296) | 78 (1,272) | 66 (1,059) | 57 (892.9) | 88 (1,333) | 82 (1,197) | 72 (1,036) | 62 (881.7) | 53 (717.5) | 43 (567.7) | 38 (490.4) | 41 (462.6) |
| Auto thefts (per 100,000) | 5 (104.1) | 2 (33.5) | 3 (49.8) | 1 (16.3) | 2 (32.1) | 4 (62.7) | 7 (106.0) | 7 (102.2) | 4 (57.6) | 5 (71.1) | 6 (81.2) | 14 (184.8) | 7 (90.3) | 7 (79.0) |
| Arson (per 100,000) | 0 (0.0) | 1 (16.7) | 0 (0.0) | 0 (0.0) | 1 (16.1) | 0 (0.0) | 2 (30.3) | 4 (58.4) | 0 (0.0) | 1 (14.2) | 3 (40.6) | 0 (0.0) | 1 (12.9) | 0 (0.0) |
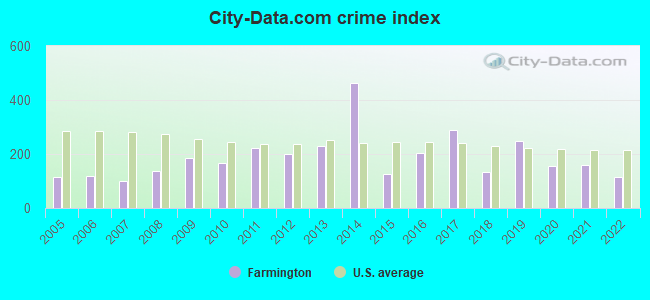
| City-Data.com crime index | 184.9 | 165.2 | 222.5 | 199.4 | 231.5 | 464.4 | 124.6 | 205.0 | 288.0 | 132.4 | 249.9 | 155.8 | 158.9 | 112.6 |
The City-Data.com crime index weighs serious crimes and violent crimes more heavily. Higher means more crime, U.S. average is 246.1. It adjusts for the number of visitors and daily workers commuting into cities.
Crime rate in Farmington detailed stats: murders, rapes, robberies, assaults, burglaries, thefts, arson
Full-time law enforcement employees in 2021, including police officers: 19 (18 officers - 18 male; 0 female).
| Officers per 1,000 residents here: | 2.32 |
| Arkansas average: | 2.25 |
 Recent articles from our blog. Our writers, many of them Ph.D. graduates or candidates, create easy-to-read articles on a wide variety of topics.

 | Would Merging The Four NWA Cities Stop The Fighting?? (37 replies) |
| Fayetteville new law (73 replies) |
| Move to NWA or North Central Arkansas (22 replies) |
| Moving to Northwest Arkansas - Few Questions (32 replies) |
| Quick Trip in March need advice (13 replies) |
| Looking for input on possible move to NWA (5 replies) |
Latest news from Farmington, AR collected exclusively by city-data.com from local newspapers, TV, and radio stations
Ancestries: English (23.8%), German (12.0%), Irish (9.0%), American (6.8%), Italian (5.0%), Northern European (3.5%).
Current Local Time: CST time zone
Incorporated on 10/15/1946
Elevation: 1190 feet
Land area: 4.80 square miles.
Population density: 1,944 people per square mile (low).
222 residents are foreign born (1.6% Latin America, 0.9% North America).
| This city: | 2.7% |
| Arkansas: | 5.0% |
Median real estate property taxes paid for housing units with mortgages in 2022: $1,415 (0.5%)
Median real estate property taxes paid for housing units with no mortgage in 2022: $1,229 (0.5%)
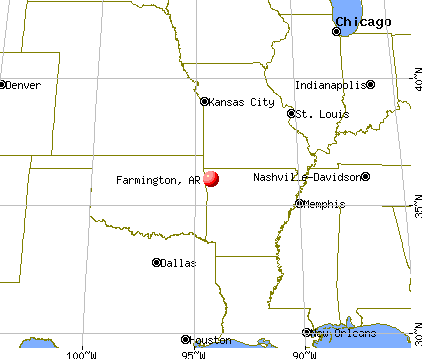
Nearest city with pop. 50,000+: Fayetteville, AR  (5.3 miles , pop. 58,047).
Nearest city with pop. 200,000+: Tulsa, OK (94.8 miles , pop. 393,049).
Nearest city with pop. 1,000,000+: Dallas, TX (267.1 miles , pop. 1,188,580).
Nearest cities:
), ), )Latitude: 36.04 N, Longitude: 94.25 W
Area code: 479
Farmington, Arkansas accommodation & food services, waste management - Economy and Business Data
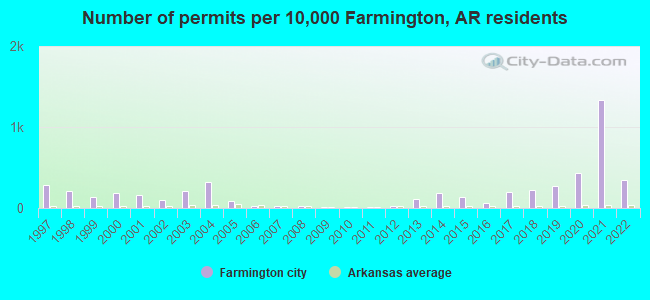
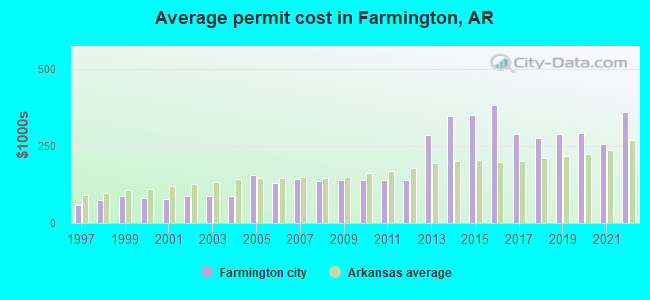
Single-family new house construction building permits:
- 2022: 126 buildings, average cost: $359,600
- 2021: 481 buildings, average cost: $256,100
- 2020: 156 buildings, average cost: $292,900
- 2019: 98 buildings, average cost: $291,300
- 2018: 79 buildings, average cost: $275,000
- 2017: 71 buildings, average cost: $289,300
- 2016: 23 buildings, average cost: $384,500
- 2015: 48 buildings, average cost: $349,700
- 2014: 65 buildings, average cost: $347,800
- 2013: 38 buildings, average cost: $284,900
- 2012: 7 buildings, average cost: $138,500
- 2011: 3 buildings, average cost: $138,500
- 2010: 3 buildings, average cost: $138,500
- 2009: 6 buildings, average cost: $138,500
- 2008: 7 buildings, average cost: $137,600
- 2007: 8 buildings, average cost: $143,100
- 2006: 8 buildings, average cost: $130,300
- 2005: 30 buildings, average cost: $155,900
- 2004: 115 buildings, average cost: $87,400
- 2003: 74 buildings, average cost: $87,800
- 2002: 37 buildings, average cost: $87,800
- 2001: 60 buildings, average cost: $77,800
- 2000: 65 buildings, average cost: $79,600
- 1999: 50 buildings, average cost: $88,900
- 1998: 74 buildings, average cost: $74,400
- 1997: 103 buildings, average cost: $58,200
| Here: | 2.2% |
| Arkansas: | 3.4% |
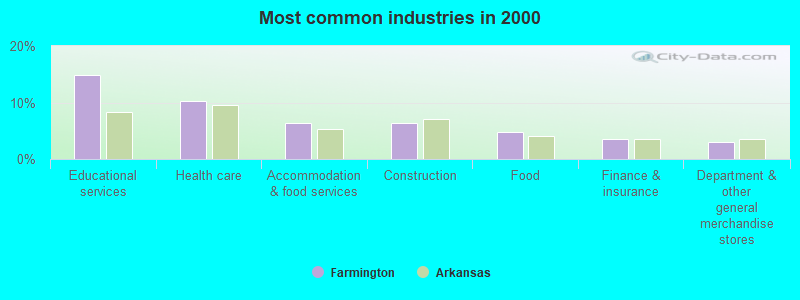
- Educational services (14.9%)
- Health care (10.2%)
- Accommodation & food services (6.4%)
- Construction (6.4%)
- Food (4.8%)
- Finance & insurance (3.5%)
- Department & other general merchandise stores (3.1%)
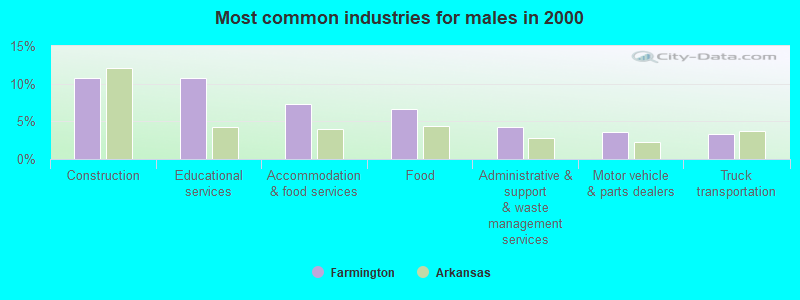
- Construction (10.8%)
- Educational services (10.8%)
- Accommodation & food services (7.3%)
- Food (6.6%)
- Administrative & support & waste management services (4.2%)
- Motor vehicle & parts dealers (3.6%)
- Truck transportation (3.3%)
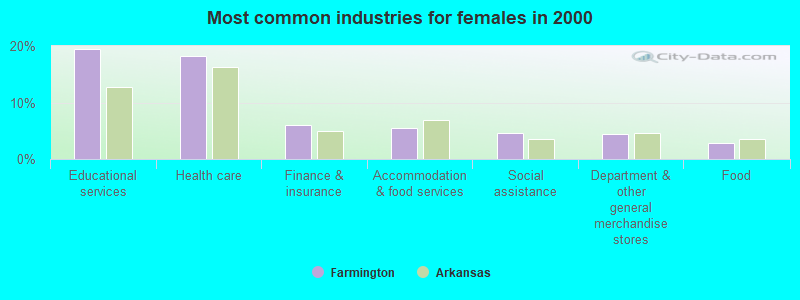
- Educational services (19.5%)
- Health care (18.2%)
- Finance & insurance (6.1%)
- Accommodation & food services (5.5%)
- Social assistance (4.5%)
- Department & other general merchandise stores (4.4%)
- Food (2.9%)
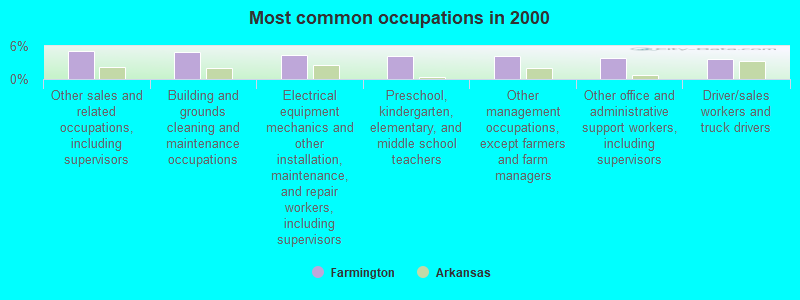
- Other sales and related occupations, including supervisors (5.1%)
- Building and grounds cleaning and maintenance occupations (4.8%)
- Electrical equipment mechanics and other installation, maintenance, and repair workers, including supervisors (4.3%)
- Preschool, kindergarten, elementary, and middle school teachers (4.2%)
- Other management occupations, except farmers and farm managers (4.1%)
- Other office and administrative support workers, including supervisors (3.8%)
- Driver/sales workers and truck drivers (3.6%)
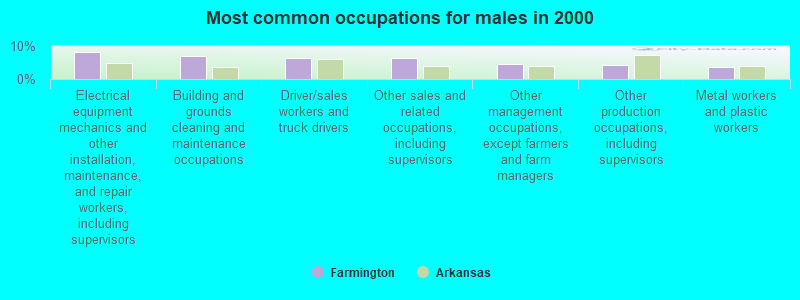
- Electrical equipment mechanics and other installation, maintenance, and repair workers, including supervisors (8.2%)
- Building and grounds cleaning and maintenance occupations (6.9%)
- Driver/sales workers and truck drivers (6.5%)
- Other sales and related occupations, including supervisors (6.3%)
- Other management occupations, except farmers and farm managers (4.5%)
- Other production occupations, including supervisors (4.2%)
- Metal workers and plastic workers (3.6%)
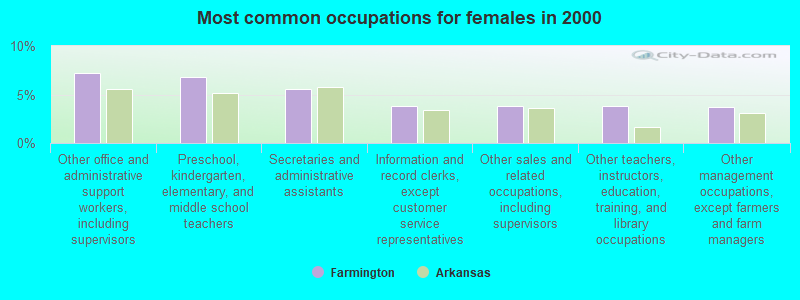
- Other office and administrative support workers, including supervisors (7.2%)
- Preschool, kindergarten, elementary, and middle school teachers (6.8%)
- Secretaries and administrative assistants (5.5%)
- Information and record clerks, except customer service representatives (3.9%)
- Other sales and related occupations, including supervisors (3.9%)
- Other teachers, instructors, education, training, and library occupations (3.9%)
- Other management occupations, except farmers and farm managers (3.8%)
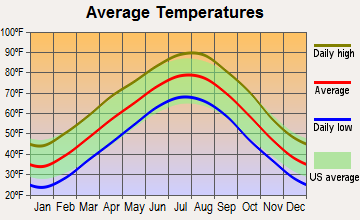
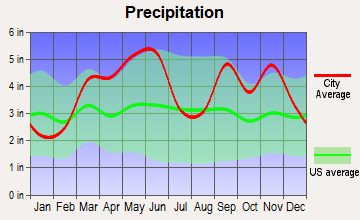
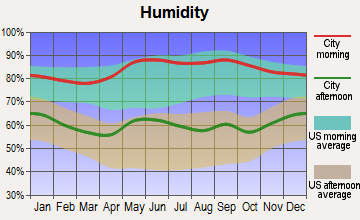
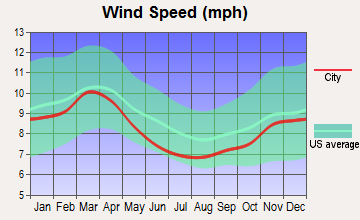
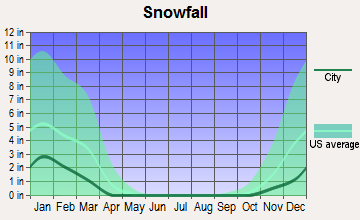
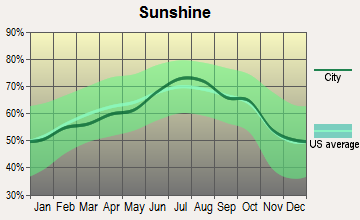
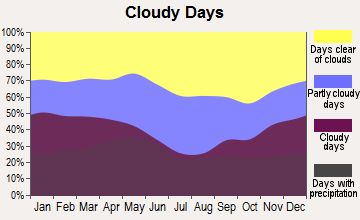
Average climate in Farmington, Arkansas
Based on data reported by over 4,000 weather stations
|
|

(lower is better)
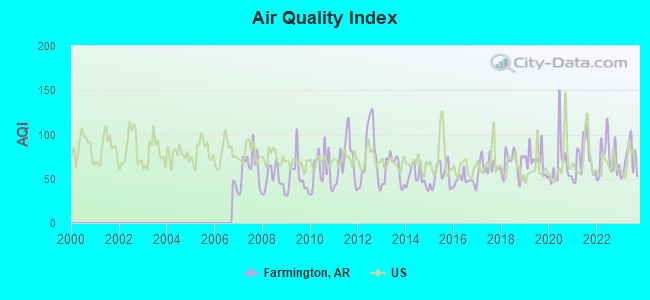
Air Quality Index (AQI) level in 2023 was 71.4. This is about average.
| City: | 71.4 |
| U.S.: | 72.6 |
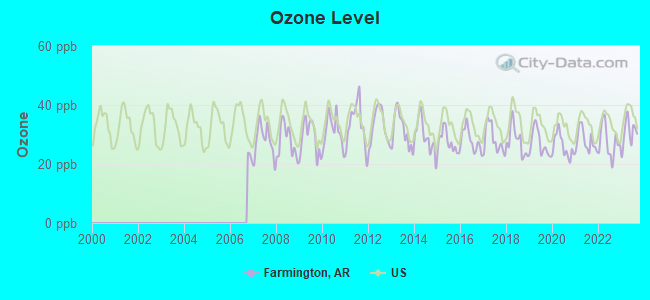
Ozone [ppb] level in 2023 was 30.6. This is about average. Closest monitor was 4.8 miles away from the city center.
| City: | 30.6 |
| U.S.: | 33.3 |
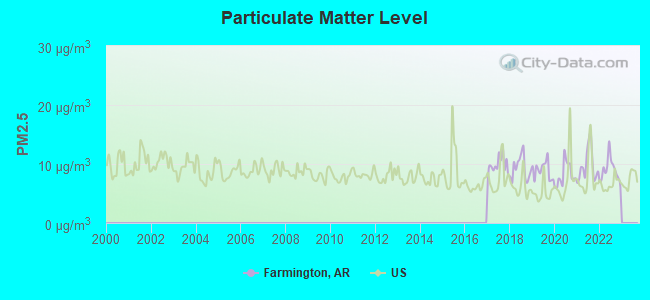
Particulate Matter (PM2.5) [µg/m3] level in 2022 was 8.95. This is about average. Closest monitor was 4.3 miles away from the city center.
| City: | 8.95 |
| U.S.: | 8.11 |
Tornado activity:
Farmington-area historical tornado activity is near Arkansas state average. It is 91% greater than the overall U.S. average.
On 5/4/1999, a category F3 (max. wind speeds 158-206 mph) tornado 2.9 miles away from the Farmington city center caused $100,000 in damages.
On 4/30/1954, a category F3 tornado 14.3 miles away from the city center injured one person and caused between $50,000 and $500,000 in damages.
Earthquake activity:
Farmington-area historical earthquake activity is significantly above Arkansas state average. It is 645% greater than the overall U.S. average.On 9/3/2016 at 12:02:44, a magnitude 5.8 (5.8 MW, Depth: 3.5 mi, Class: Moderate, Intensity: VI - VII) earthquake occurred 152.1 miles away from Farmington center
On 11/6/2011 at 03:53:10, a magnitude 5.7 (5.7 MW, Depth: 3.2 mi) earthquake occurred 145.7 miles away from Farmington center
On 11/7/2016 at 01:44:24, a magnitude 5.0 (5.0 MW, Depth: 2.8 mi) earthquake occurred 143.1 miles away from the city center
On 2/28/2011 at 05:00:50, a magnitude 4.7 (4.7 MW, Depth: 2.0 mi, Class: Light, Intensity: IV - V) earthquake occurred 119.0 miles away from the city center
On 11/5/2011 at 07:12:45, a magnitude 4.8 (4.8 MW, Depth: 1.9 mi) earthquake occurred 145.3 miles away from the city center
On 11/8/2011 at 02:46:57, a magnitude 4.8 (4.8 MW, Depth: 3.1 mi) earthquake occurred 147.0 miles away from the city center
Magnitude types: moment magnitude (MW)
Natural disasters:
The number of natural disasters in Washington County (16) is near the US average (15).Major Disasters (Presidential) Declared: 10
Emergencies Declared: 3
Causes of natural disasters: Storms: 10, Floods: 9, Tornadoes: 6, Winter Storms: 4, Winds: 3, Hurricane: 1, Landslide: 1, Other: 1 (Note: some incidents may be assigned to more than one category).
Hospitals and medical centers near Farmington:
- KATHERINE'S PLACE AT WEDINGTON (Nursing Home, about 3 miles away; FAYETTEVILLE, AR)
- ROCHIER HEIGHTS NURSING CENTER (Nursing Home, about 5 miles away; FAYETTEVILLE, AR)
- FAYETTEVILLE CITY HOSPITAL AND GERIATRIC CENTER (Nursing Home, about 5 miles away; FAYETTEVILLE, AR)
- FAYETTEVILLE AR VA MEDICAL CENTER (Hospital, Acute Care - Veterans Administration, about 6 miles away; FAYETTEVILLE, AR)
- FAYETTEVILLE VETERANS HOME (Nursing Home, about 6 miles away; FAYETTEVILLE, AR)
- WASHINGTON REG MED CTR HH (Home Health Center, about 7 miles away; FAYETTEVILLE, AR)
- PRAIRIE GROVE HEALTH AND REHABILITATION, LLC (Nursing Home, about 7 miles away; PRAIRIE GROVE, AR)
Colleges/universities with over 2000 students nearest to Farmington:
- University of Arkansas (about 4 miles; Fayetteville, AR; Full-time enrollment: 22,163)
- John Brown University (about 21 miles; Siloam Springs, AR; FT enrollment: 2,097)
- NorthWest Arkansas Community College (about 23 miles; Bentonville, AR; FT enrollment: 5,634)
- Northeastern State University (about 42 miles; Tahlequah, OK; FT enrollment: 6,895)
- University of Arkansas-Fort Smith (about 47 miles; Fort Smith, AR; FT enrollment: 6,103)
- Crowder College (about 54 miles; Neosho, MO; FT enrollment: 3,675)
- Northeastern Oklahoma A&M College (about 68 miles; Miami, OK; FT enrollment: 2,075)
Public high school in Farmington:
- FARMINGTON HIGH SCHOOL (Location: 278 W MAIN ST, Grades: 9-12)
Public elementary/middle schools in Farmington:
- GEORGE R LEDBETTER INTERMEDIATE (Location: 14 N DOUBLE SPRINGS RD, Grades: 4-5)
- RANDALL G. LYNCH MIDDLE SCHOOL (Location: 359 W RHEAS MILL RD, Grades: 6-8)
- JERRY POP WILLIAMS ELEM SCH (Location: 322 N BROYLES ST, Grades: KG-3)
- BOB FOLSOM ELEMENTARY SCHOOL (Location: 230 S GRACE LN, Grades: KG-3)
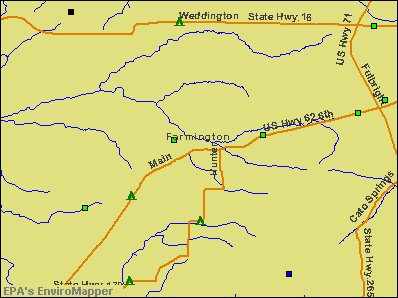
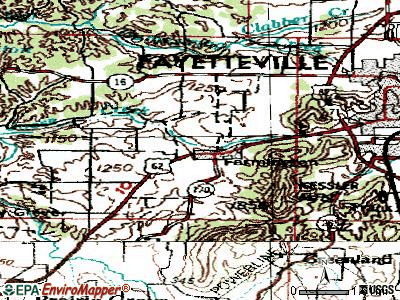
Points of interest:
Notable locations in Farmington: Farmington Police Department (A), Farmington Fire Department (B). Display/hide their locations on the map
Streams, rivers, and creeks: Owl Creek (A), Farmington Branch (B). Display/hide their locations on the map
| This city: | 2.7 people |
| Arkansas: | 2.5 people |
| This city: | 71.6% |
| Whole state: | 67.6% |
| This city: | 6.4% |
| Whole state: | 5.7% |
Likely homosexual households (counted as self-reported same-sex unmarried-partner households)
- Lesbian couples: 0.6% of all households
- Gay men: 0.3% of all households
Banks with branches in Farmington (2011 data):
- Arvest Bank: Farmington Branch at 110 East Main Street, branch established on 1977/12/19. Info updated 2010/11/29: Bank assets: $12,520.8 mil, Deposits: $10,446.2 mil, headquarters in Fayetteville, AR, positive income, Commercial Lending Specialization, 241 total offices, Holding Company: Arvest Bank Group, Inc.
- The Bank of Fayetteville: Farmington Branch at 257 West Main, branch established on 2008/08/04. Info updated 2006/11/03: Bank assets: $399.1 mil, Deposits: $334.4 mil, headquarters in Fayetteville, AR, positive income, Commercial Lending Specialization, 8 total offices, Holding Company: Bankshares Of Fayetteville, Inc
- First Federal Bank: West Main Street Branch at 191 West Main Street, branch established on 1997/10/22. Info updated 2011/07/21: Bank assets: $590.1 mil, Deposits: $502.2 mil, headquarters in Harrison, AR, negative income in the last year, Commercial Lending Specialization, 18 total offices
For population 15 years and over in Farmington:
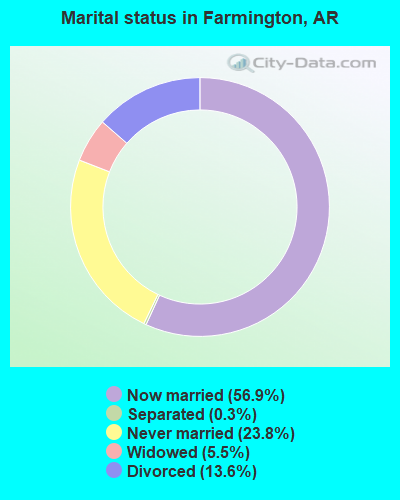
- Never married: 23.8%
- Now married: 56.9%
- Separated: 0.3%
- Widowed: 5.5%
- Divorced: 13.6%
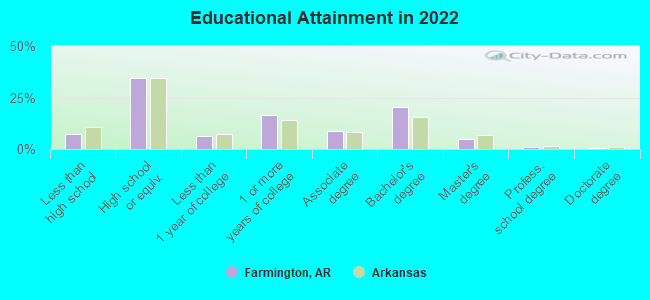
For population 25 years and over in Farmington:
- High school or higher: 92.3%
- Bachelor's degree or higher: 25.7%
- Graduate or professional degree: 6.2%
- Unemployed: 3.0%
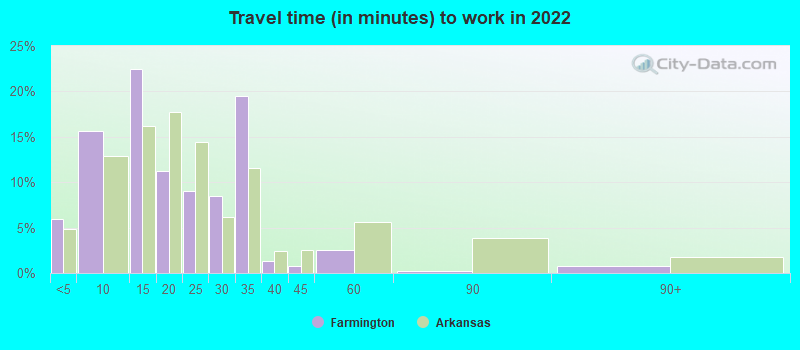
- Mean travel time to work (commute): 22.0 minutes
| Here: | 9.4 |
| Arkansas average: | 11.4 |
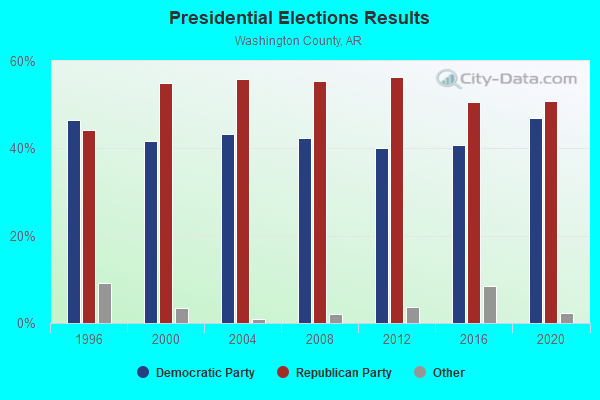
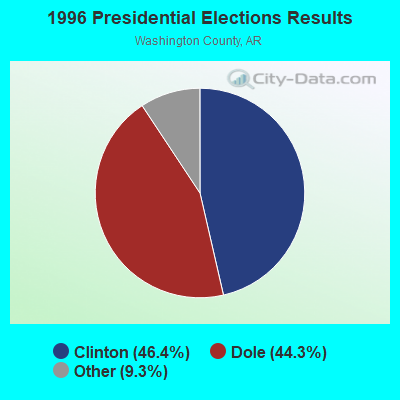
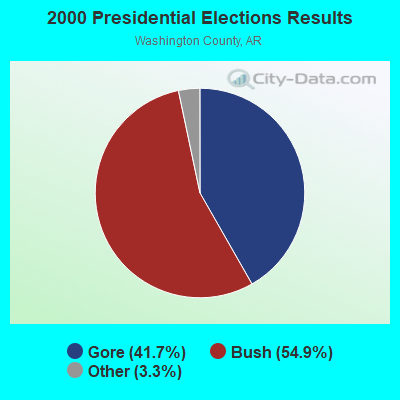
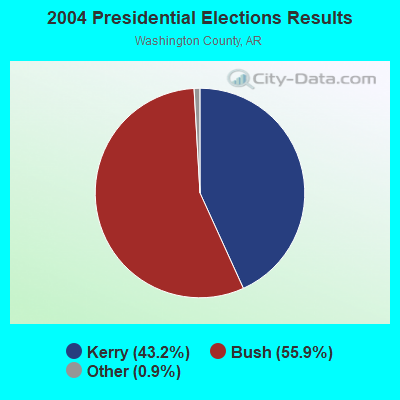
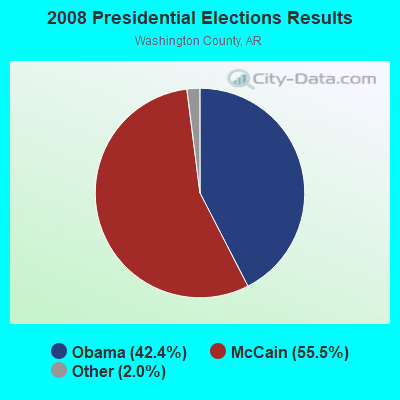
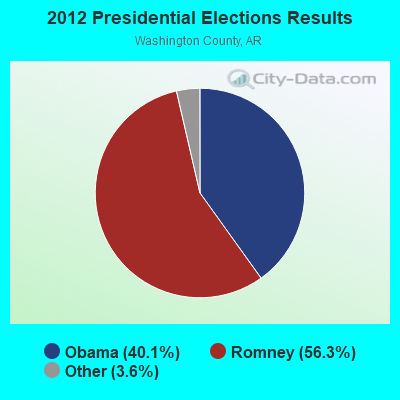
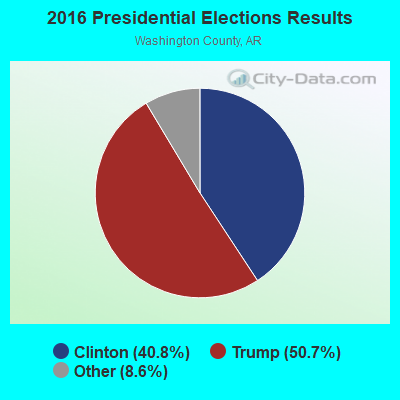
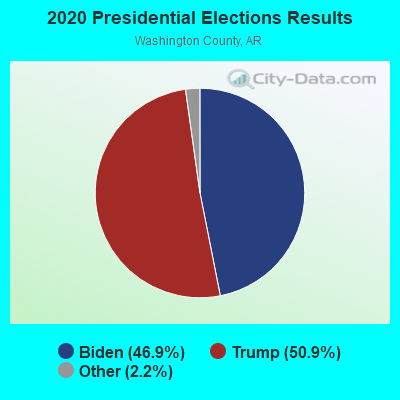
Graphs represent county-level data. Detailed 2008 Election Results
Neighborhoods in Farmington:
(Farmington, Arkansas Neighborhood Map)- Bellwood neighborhood
- Bermuda Estates neighborhood
- Bethel Oaks neighborhood
- Brookside neighborhood
- East Creek Place neighborhood
- Farmington Commercial Center neighborhood
- Farmington Estates neighborhood
- Golden Acres neighborhood
- Grand Oaks neighborhood
- Grasslands neighborhood
- Highlands Square North neighborhood
- Kendal Valley neighborhood
- Magnolia Ridge neighborhood
- Meadowlark neighborhood
- Mountain View Estates neighborhood
- North Club House Estates neighborhood
- North Ridge neighborhood
- Oakridge neighborhood
- Orchard Estates neighborhood
- Owl Creek neighborhood
- Pleasant Hill neighborhood
- Red Bird Estates neighborhood
- Richland Estates neighborhood
- Riviera Estates neighborhood
- Rosecourt-Valley View neighborhood
- Rusty Meadows neighborhood
- Shannondoah Valley neighborhood
- Silverthorne neighborhood
- South Bank neighborhood
- South Club House Estates neighborhood
- South Field neighborhood
- South Fork Estates neighborhood
- South Haven neighborhood
- Southwinds neighborhood
- Steven Heights neighborhood
- The Meadow neighborhood
- Twin Falls neighborhood
- Willow West neighborhood
Religion statistics for Farmington, AR (based on Washington County data)
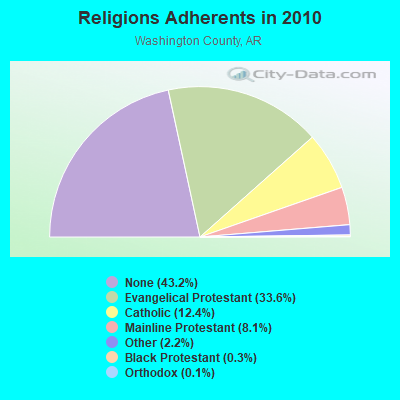
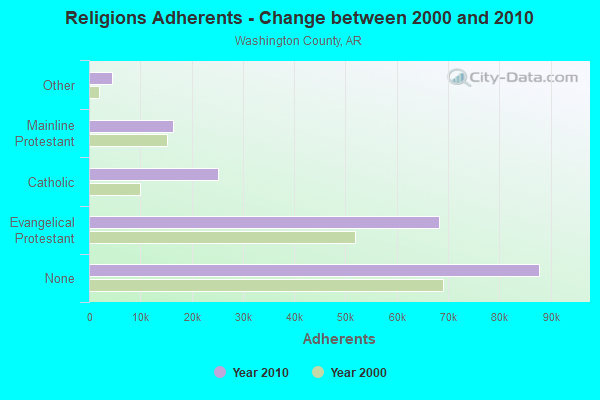
| Religion | Adherents | Congregations |
|---|---|---|
| Evangelical Protestant | 68,218 | 208 |
| Catholic | 25,134 | 4 |
| Mainline Protestant | 16,428 | 37 |
| Other | 4,543 | 24 |
| Black Protestant | 626 | 1 |
| Orthodox | 300 | 1 |
| None | 87,816 | - |
Food Environment Statistics:
| Here: | 1.29 / 10,000 pop. |
| Arkansas: | 2.02 / 10,000 pop. |
| Washington County: | 0.21 / 10,000 pop. |
| Arkansas: | 0.25 / 10,000 pop. |
| Washington County: | 0.21 / 10,000 pop. |
| Arkansas: | 0.59 / 10,000 pop. |
| This county: | 3.41 / 10,000 pop. |
| State: | 4.94 / 10,000 pop. |
| Here: | 9.80 / 10,000 pop. |
| State: | 6.66 / 10,000 pop. |
| Washington County: | 6.9% |
| Arkansas: | 9.8% |
| This county: | 25.2% |
| State: | 29.1% |
| Washington County: | 17.5% |
| Arkansas: | 13.6% |
Health and Nutrition:
| Farmington: | 43.8% |
| Arkansas: | 48.2% |
| Farmington: | 37.2% |
| Arkansas: | 44.2% |
| This city: | 28.8 |
| Arkansas: | 28.9 |
| Here: | 22.9% |
| State: | 21.6% |
| Farmington: | 12.2% |
| State: | 11.3% |
| This city: | 6.7 |
| Arkansas: | 6.8 |
| Here: | 31.0% |
| Arkansas: | 34.0% |
| Farmington: | 52.0% |
| State: | 54.4% |
| Farmington: | 77.9% |
| Arkansas: | 78.0% |
More about Health and Nutrition of Farmington, AR Residents
| Local government employment and payroll (March 2022) | |||||
| Function | Full-time employees | Monthly full-time payroll | Average yearly full-time wage | Part-time employees | Monthly part-time payroll |
|---|---|---|---|---|---|
| Police Protection - Officers | 19 | $64,540 | $40,762 | 0 | $0 |
| Firefighters | 9 | $31,725 | $42,300 | 0 | $0 |
| Streets and Highways | 6 | $17,875 | $35,750 | 0 | $0 |
| Local Libraries | 3 | $8,714 | $34,856 | 0 | $0 |
| Other Government Administration | 2 | $7,134 | $42,804 | 0 | $0 |
| Judicial and Legal | 2 | $17,924 | $107,544 | 1 | $1,019 |
| Parks and Recreation | 1 | $3,477 | $41,724 | 2 | $1,019 |
| Totals for Government | 42 | $151,390 | $43,254 | 3 | $2,038 |
Farmington government finances - Expenditure in 2017 (per resident):
- Construction - Regular Highways: $436,000 ($46.70)
Police Protection: $33,000 ($3.53)
- Current Operations - Financial Administration: $938,000 ($100.47)
Police Protection: $831,000 ($89.01)
Regular Highways: $585,000 ($62.66)
Local Fire Protection: $352,000 ($37.70)
General - Other: $217,000 ($23.24)
Parks and Recreation: $203,000 ($21.74)
Libraries: $141,000 ($15.10)
Judicial and Legal Services: $103,000 ($11.03)
Health - Other: $64,000 ($6.86)
Sewerage: $13,000 ($1.39)
- General - Interest on Debt: $152,000 ($16.28)
Farmington government finances - Revenue in 2017 (per resident):
- Charges - Sewerage: $241,000 ($25.81)
Other: $151,000 ($16.17)
Parks and Recreation: $54,000 ($5.78)
- Local Intergovernmental - General Local Government Support: $1,112,000 ($119.11)
Other: $145,000 ($15.53)
Highways: $48,000 ($5.14)
- Miscellaneous - General Revenue - Other: $75,000 ($8.03)
Fines and Forfeits: $41,000 ($4.39)
Interest Earnings: $3,000 ($0.32)
Donations From Private Sources: $1,000 ($0.11)
- State Intergovernmental - Highways: $603,000 ($64.59)
General Local Government Support: $158,000 ($16.92)
Other: $59,000 ($6.32)
- Tax - General Sales and Gross Receipts: $1,396,000 ($149.53)
Property: $498,000 ($53.34)
Public Utilities Sales: $349,000 ($37.38)
Occupation and Business License - Other: $6,000 ($0.64)
Other License: $3,000 ($0.32)
Farmington government finances - Debt in 2017 (per resident):
- Long Term Debt - Beginning Outstanding - Unspecified Public Purpose: $4,819,000 ($516.17)
Outstanding Unspecified Public Purpose: $3,947,000 ($422.77)
Retired Unspecified Public Purpose: $872,000 ($93.40)
Farmington government finances - Cash and Securities in 2017 (per resident):
- Other Funds - Cash and Securities: $4,012,000 ($429.73)
- Sinking Funds - Cash and Securities: $663,000 ($71.02)
8.35% of this county's 2020 resident taxpayers moved to other counties in 2021 ($54,769 average adjusted gross income)
| Here: | 8.35% |
| Arkansas average: | 7.23% |
0.03% of residents moved to foreign countries ($130 average AGI)
Washington County: 0.03% Arkansas average: 0.01%
Top counties to which taxpayers relocated from this county between 2020 and 2021:
| to Benton County, AR | |
| to Madison County, AR | |
| to Pulaski County, AR |
| Businesses in Farmington, AR | ||||
| Name | Count | Name | Count | |
|---|---|---|---|---|
| AT&T | 1 | SONIC Drive-In | 1 | |
| Jones New York | 1 | Subway | 1 | |
| McDonald's | 1 | U-Haul | 2 | |
Strongest AM radio stations in Farmington:
- KFAY (1030 AM; 10 kW; FARMINGTON, AR; Owner: CUMULUS LICENSING CORP)
- KOFC (1250 AM; 1 kW; FAYETTEVILLE, AR; Owner: WILLIAM B. DISNEY & MARTHA J. DISNEY)
- KURM (790 AM; 5 kW; ROGERS, AR; Owner: KERM, INC)
- KUOA (1290 AM; 5 kW; SILOAM SPRINGS, AR; Owner: KUOA, INC.)
- KZRA (1590 AM; 2 kW; SPRINGDALE, AR; Owner: CUMULUS LICENSING CORP.)
- KFAQ (1170 AM; 50 kW; TULSA, OK; Owner: JOURNAL BROADCAST CORPORATION)
- KRMG (740 AM; 50 kW; TULSA, OK; Owner: CXR HOLDINGS, INC.)
- KYHN (1320 AM; 10 kW; FORT SMITH, AR; Owner: CAPSTAR TX LIMITED PARTNERSHIP)
- KREB (1190 AM; daytime; 2 kW; BENTONVILLE/BELLA VI, AR; Owner: BUTLER BROADCASTING COMPANY, LLC)
- KWHN (1650 AM; 10 kW; FT. SMITH, AR; Owner: CAPSTAR TX LIMITED PARTNERSHIP)
- KGHT (880 AM; 50 kW; SHERIDAN, AR; Owner: METROPOLITAN RADIO GROUP, INC.)
- KBTN (1420 AM; 10 kW; NEOSHO, MO; Owner: PETRACOM OF JOPLIN, L.L.C.)
- KAAY (1090 AM; 50 kW; LITTLE ROCK, AR; Owner: CITADEL BROADCASTING COMPANY)
Strongest FM radio stations in Farmington:
- KAYH (89.3 FM; FAYETTEVILLE, AR; Owner: FAMILY VISION MINISTRIES, INC.)
- KKIX (103.9 FM; FAYETTEVILLE, AR; Owner: CAPSTAR TX LIMITED PARTNERSHIP)
- K244DS (96.7 FM; FAYETTEVILLE, AR; Owner: BUTLER BROADCASTING COMPANY, LLC)
- KXUA (88.3 FM; FAYETTEVILLE, AR; Owner: BRD. OF TRUST. OF UNIV. OF ARKANSAS)
- KEZA (107.9 FM; FAYETTEVILLE, AR; Owner: CAPSTAR TX LIMITED PARTNERSHIP)
- KUAF (91.3 FM; FAYETTEVILLE, AR; Owner: BOARD OF TRUSTEES OF THE UNIVERSITY OF ARKANSAS)
- KMCK-FM (105.7 FM; SILOAM SPRINGS, AR; Owner: CUMULUS LICENSING CORP.)
- K272DQ (102.3 FM; FAYETTEVILLE, AR; Owner: CAPSTAR TX LIMITED PARTNERSHIP)
- KDAB (94.9 FM; PRAIRIE GROVE, AR; Owner: CUMULUS LICENSING CORP.)
- KFAY-FM (98.3 FM; BENTONVILLE, AR; Owner: CUMULUS LICENSING CORP)
- KXNA (104.9 FM; SPRINGDALE, AR; Owner: BUTLER BROADCASTING COMPANY, LLC)
- K203CE (88.5 FM; SPRINGDALE, AR; Owner: BIBLE BROADCASTING NETWORK, INC.)
- KKEG (92.1 FM; FAYETTEVILLE, AR; Owner: CUMULUS LICENSING CORP)
- KBNV (90.1 FM; FAYETTEVILLE, AR; Owner: AMERICAN FAMILY ASSOCIATION)
- K202BN (88.3 FM; FAYETTEVILLE, AR; Owner: CREATIVE EDUCATIONAL MEDIA CORP, INC)
- K215EE (90.9 FM; FAYETTEVILLE, AR; Owner: CALVARY CHAPEL OF TWIN FALLS, INC.)
- K224AW (92.7 FM; SPRINGDALE, ETC., AR; Owner: J AND J BROADCASTING)
- K240AS (95.9 FM; FAYETTEVILLE, AR; Owner: FRED H BAKER D/B/A MEGAMEDIA)
- K261AX (100.1 FM; FAYETTEVILLE, AR; Owner: J AND J BROADCASTING)
- K269BE (101.7 FM; ROGERS, AR; Owner: J AND J BROADCASTING)
TV broadcast stations around Farmington:
- KHOG-TV (Channel 29; FAYETTEVILLE, AR; Owner: KHBS HEARST-ARGYLE TELEVISION, INC.)
- K62DQ (Channel 62; FAYETTEVILLE, ETC., AR; Owner: NEW YORK TIMES MANAGEMENT SERVICES)
- K64FO (Channel 64; FAYETTEVILLE, AR; Owner: FORT SMITH 46, INC.)
- KAFT (Channel 13; FAYETTEVILLE, AR; Owner: ARKANSAS EDUCATIONAL TELEVISION COMMISSION)
- K15DR (Channel 15; SPRINGDALE, AR; Owner: FORT SMITH 46, INC.)
- K59ES (Channel 59; HINDSVILLE, AR; Owner: FORT SMITH 46, INC.)
- K42BS (Channel 42; FAYETTEVILLE, AR; Owner: TRINITY BROADCASTING NETWORK)
- KFAA (Channel 51; ROGERS, AR; Owner: J.D.G. TELEVISION, INC.)
- KSBN-TV (Channel 57; SPRINGDALE, AR; Owner: TOTAL LIFE COMMUNITY EDUCATIONAL FOUNDATION)
- KFSM-TV (Channel 5; FORT SMITH, AR; Owner: NEW YORK TIMES MANAGEMENT SERVICES)
- KFFS-CA (Channel 36; FAYETTEVILLE, AR; Owner: FORT SMITH 46, INC.)
- K68ET (Channel 68; FORT SMITH, AR; Owner: FORT SMITH 46, INC.)
- KPOM-TV (Channel 24; FORT SMITH, AR; Owner: J.D.G. TELEVISION, INC.)
- K33FG (Channel 33; SILOAM SPRINGS, AR; Owner: FORT SMITH 46, INC.)
- K67EO (Channel 67; BENTONVILLE, AR; Owner: NEW YORK TIMES MANAGEMENT SERVICES)
- KVAQ-LP (Channel 20; SPRINGDALE, AR; Owner: CHRISTIANS INCORPORATED FOR CHRIST)
- K14IT (Channel 14; BENTONVILLE, AR; Owner: FORT SMITH 46, INC.)
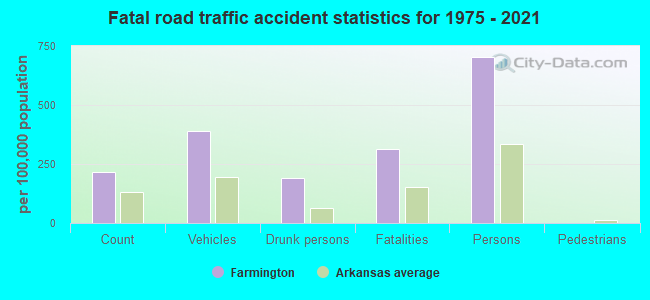
Farmington fatal accident list:
Dec 16, 2016 03:58 PM, Us-62-01, Lat: 36.038908, Lon: -94.254542, Vehicles: 1, Persons: 1, Fatalities: 1
Apr 3, 2013 07:00 AM, Us-62-01, Tyler Rd., Lat: 36.033831, Lon: -94.262775, Vehicles: 2, Persons: 2, Fatalities: 1
Feb 2, 2003 00:52 AM, Us-62-01, Vehicles: 1, Persons: 2, Fatalities: 1
Mar 14, 1992 00:04 AM, 62, Vehicles: 2, Persons: 2, Fatalities: 1, Drunk persons involved: 2
May 18, 1990 12:44 AM, 62s1, Vehicles: 3, Persons: 8, Fatalities: 3, Drunk persons involved: 2
Aug 7, 1980 11:40 AM, Vehicles: 1, Persons: 1, Fatalities: 1
- National Bridge Inventory (NBI) Statistics
- 10Number of bridges
- 36ft / 10.5mTotal length
- $137,000Total costs
- 54,436Total average daily traffic
- 543Total average daily truck traffic
- 38,840Total future (year 2007) average daily traffic
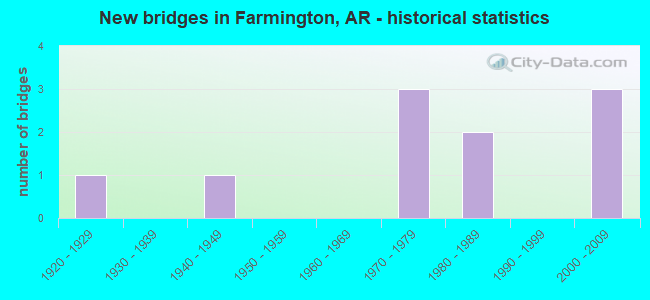
- New bridges - historical statistics
- 11920-1929
- 11940-1949
- 31970-1979
- 21980-1989
- 32000-2009
FCC Registered Antenna Towers:
31 (See the full list of FCC Registered Antenna Towers in Farmington)FCC Registered Commercial Land Mobile Towers:
2- Lat: 36.109528 Lon: -94.183250, Call Sign: KB55394,
Assigned Frequencies: 450.450 MHz, 450.850 MHz, 455.450 MHz, Grant Date: 05/07/1985, Expiration Date: 06/01/2028, Registrant: Ktv Media, LLC, P. O. Box 23808, Little Rock, AR 72221
- 12759 Rheas Mill Rd (Lat: 36.040639 Lon: -94.275778), Type: Tower, Structure height: 60.7 m, Call Sign: KPH536,
Assigned Frequencies: 455.990 MHz, Grant Date: 08/04/1999, Expiration Date: 06/01/2028, Certifier: William B Disney, Registrant: Kofc Christian Radio, Fayetteville, AR 72702-0550, Phone: (479) 750-7707, Fax: (479) 750-7767, Email:
FCC Registered Broadcast Land Mobile Towers:
1- Lat: 36.042028 Lon: -94.247139, Call Sign: WPSH958,
Assigned Frequencies: 33.4000 MHz, 154.540 MHz, 33.1600 MHz, 154.515 MHz, 30.8400 MHz, 35.0200 MHz, 31.2400 MHz, 151.835 MHz, Grant Date: 05/03/2001, Expiration Date: 05/03/2011, Cancellation Date: 07/09/2011, Certifier: Signature On File, Registrant: H M Electronics Inc, 6675 Mesa Ridge Road, San Diego, CA 92121, Phone: (858) 535-6166, Fax: (858) 552-0139
FCC Registered Microwave Towers:
3- KESSLER MOUNTAIN, Kessler Mountain (Lat: 36.018333 Lon: -94.219917), Type: Tower, Structure height: 48.7 m, Overall height: 49.3 m, Call Sign: WQCG358,
Assigned Frequencies: 7012.50 MHz, Grant Date: 02/24/2005, Expiration Date: 06/01/2021, Certifier: David Needham, Registrant: Nexstar Broadcasting, Inc., 545 E. John Carpenter Frwy, Suite 700, Irving, TX 75062, Phone: (972) 373-8800, Fax: (972) 373-8888, Email:
- Kessler Mtn, Kessler Mtn (Lat: 36.018417 Lon: -94.219917), Type: Nntann, Structure height: 48.7 m, Overall height: 49.3 m, Call Sign: WQFP323,
Assigned Frequencies: 13062.5 MHz, Grant Date: 08/30/2006, Expiration Date: 06/01/2021, Certifier: Perry Sook, Registrant: Nexstar Broadcasting, Inc., 545 E. John Carpenter Frwy, Suite 700, Irving, TX 75062, Phone: (972) 373-8800, Fax: (972) 373-8888, Email:
- KESSLER MTN, Kessler Mtn (Lat: 36.018389 Lon: -94.219917), Type: Tower, Structure height: 48.7 m, Overall height: 49.3 m, Call Sign: WDT850,
Assigned Frequencies: 7062.50 MHz, Grant Date: 06/10/1982, Expiration Date: 06/01/2021, Registrant: Nexstar Broadcasting, Inc., 545 E. John Carpenter Frwy, Suite 700, Irving, TX 75062, Phone: (972) 373-8800, Fax: (972) 373-8888, Email:
FCC Registered Amateur Radio Licenses:
64 (See the full list of FCC Registered Amateur Radio Licenses in Farmington)FAA Registered Aircraft Manufacturers and Dealers:
2- STEARMAN FARMS INC, 12382 W Highway 62, Farmington, AR 72730
Certificate: 05-0598 (Corporation), Certificate Issue Date: 04/22/2005, Expiration Date: 04/21/2006 - PREFERRED AVIATION LLC, Po Box 1496, Farmington, AR 72730
Certificate: D007132 (LLC), Certificate Issue Date: 11/07/2020, Expiration Date: 11/06/2021
FAA Registered Aircraft:
5- Aircraft: PIPER PA-28-140 (Category: Land, Seats: 4, Weight: Up to 12,499 Pounds, Speed: 107 mph), Engine: LYCOMING 0-320 SERIES (180 HP) (Reciprocating)
N-Number: 6161V, N6161V, N-6161V, Serial Number: 28-20161, Year manufactured: 1964, Airworthiness Date: 06/23/1964, Certificate Issue Date: 02/14/2000
Registrant (Co-Owned): Lonnie Workman, 3031 Hook Ln, Farmington, AR 72730, Other Owners: Jan Workman - Aircraft: CIRRUS DESIGN CORP SR22 (Category: Land, Seats: 4, Weight: Up to 12,499 Pounds), Engine: CONT MOTOR IO-550-N (310 HP) (Reciprocating)
N-Number: 728BJ, N728BJ, N-728BJ, Serial Number: 4320, Year manufactured: 2016, Airworthiness Date: 03/23/2016, Certificate Issue Date: 12/14/2020
Registrant (LLC): Plane View LLC, Po Box 1335, Farmington, AR 72730 - Aircraft: LEARJET INC 45 (Category: Land, Engines: 2, Seats: 12, Weight: 20,000+ Pounds), Engine: HONEYWELL TFE731-20BR (3650 Pounds of Thrust) (Turbo-fan)
N-Number: 769TM, N769TM, N-769TM, Serial Number: 176, Year manufactured: 2001, Airworthiness Date: 02/07/2018, Certificate Issue Date: 03/05/2018
Registrant (LLC): Preferred Aviation LLC, Po Box 1496, Farmington, AR 72730 - Aircraft: CESSNA 172L (Category: Land, Seats: 4, Weight: Up to 12,499 Pounds, Speed: 105 mph), Engine: LYCOMING 0-320 SERIES (180 HP) (Reciprocating)
N-Number: 7967G, N7967G, N-7967G, Serial Number: 17259667, Year manufactured: 1971, Airworthiness Date: 01/26/1971, Certificate Issue Date: 12/26/2017
Registrant (Individual): Robert E Chavis, 11200 Spring Mountain Dr, Farmington, AR 72730 - Aircraft: PIPER PA-28-180 (Category: Land, Seats: 4, Weight: Up to 12,499 Pounds, Speed: 107 mph), Engine: LYCOMING O&VO-360 SER (180 HP) (Reciprocating)
N-Number: 8481W, N8481W, N-8481W, Serial Number: 28-2725, Year manufactured: 1965, Airworthiness Date: 08/31/1965, Certificate Issue Date: 10/19/1976
Registrant (Co-Owned): John R Hamilton, 386 Driftwood Dr, Farmington, AR 72730, Other Owners: Maxine L Hamilton
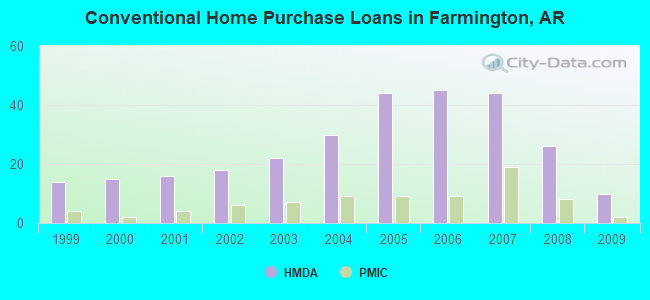
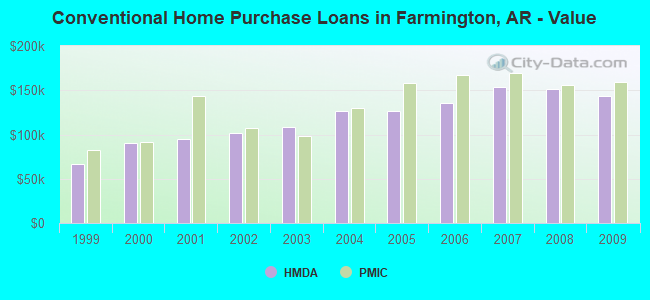
| Home Mortgage Disclosure Act Aggregated Statistics For Year 2009 (Based on 1 partial tract) | ||||||||||||
| A) FHA, FSA/RHS & VA Home Purchase Loans | B) Conventional Home Purchase Loans | C) Refinancings | D) Home Improvement Loans | F) Non-occupant Loans on < 5 Family Dwellings (A B C & D) | G) Loans On Manufactured Home Dwelling (A B C & D) | |||||||
|---|---|---|---|---|---|---|---|---|---|---|---|---|
| Number | Average Value | Number | Average Value | Number | Average Value | Number | Average Value | Number | Average Value | Number | Average Value | |
| LOANS ORIGINATED | 14 | $148,475 | 10 | $142,950 | 39 | $144,931 | 2 | $32,360 | 7 | $151,721 | 0 | $0 |
| APPLICATIONS APPROVED, NOT ACCEPTED | 0 | $0 | 0 | $0 | 2 | $142,210 | 0 | $0 | 0 | $0 | 0 | $0 |
| APPLICATIONS DENIED | 2 | $170,635 | 2 | $131,370 | 11 | $168,746 | 1 | $19,430 | 1 | $179,710 | 1 | $41,920 |
| APPLICATIONS WITHDRAWN | 1 | $142,450 | 0 | $0 | 6 | $152,383 | 0 | $0 | 1 | $88,970 | 0 | $0 |
| FILES CLOSED FOR INCOMPLETENESS | 0 | $0 | 0 | $0 | 1 | $211,510 | 0 | $0 | 0 | $0 | 0 | $0 |
Detailed HMDA statistics for the following Tracts: 0105.06
| Private Mortgage Insurance Companies Aggregated Statistics For Year 2009 (Based on 1 partial tract) | ||||
| A) Conventional Home Purchase Loans | B) Refinancings | |||
|---|---|---|---|---|
| Number | Average Value | Number | Average Value | |
| LOANS ORIGINATED | 2 | $159,315 | 1 | $235,600 |
| APPLICATIONS APPROVED, NOT ACCEPTED | 0 | $0 | 0 | $0 |
| APPLICATIONS DENIED | 0 | $0 | 0 | $0 |
| APPLICATIONS WITHDRAWN | 0 | $0 | 0 | $0 |
| FILES CLOSED FOR INCOMPLETENESS | 0 | $0 | 0 | $0 |
Detailed PMIC statistics for the following Tracts: 0105.06
2002 - 2018 National Fire Incident Reporting System (NFIRS) incidents
- Fire incident types reported to NFIRS in Farmington, AR
- 43749.2%Outside Fires
- 38743.6%Structure Fires
- 515.7%Mobile Property/Vehicle Fires
- 131.5%Other
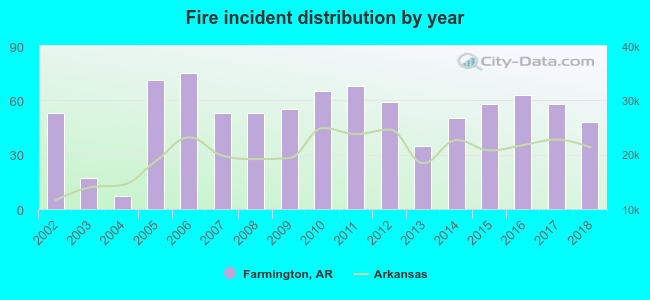 Based on the data from the years 2002 - 2018 the average number of fire incidents per year is 52. The highest number of fire incidents - 75 took place in 2006, and the least - 7 in 2004. The data has a decreasing trend.
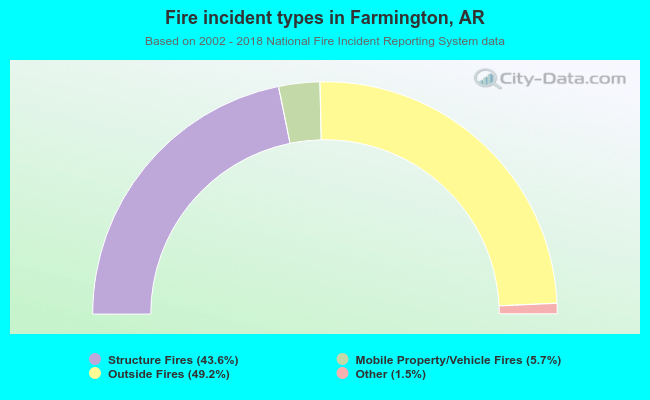 When looking into fire subcategories, the most incidents belonged to: Outside Fires (49.2%), and Structure Fires (43.6%).
| Most common first names in Farmington, AR among deceased individuals | ||
| Name | Count | Lived (average) |
|---|---|---|
| James | 38 | 72.1 years |
| Mary | 23 | 75.4 years |
| John | 18 | 78.4 years |
| William | 16 | 75.9 years |
| George | 14 | 74.5 years |
| Charles | 14 | 71.0 years |
| Robert | 14 | 67.1 years |
| Richard | 10 | 67.0 years |
| Harold | 9 | 71.7 years |
| Paul | 9 | 62.8 years |
| Most common last names in Farmington, AR among deceased individuals | ||
| Last name | Count | Lived (average) |
|---|---|---|
| Smith | 13 | 71.3 years |
| Davis | 13 | 77.2 years |
| Lewis | 9 | 64.6 years |
| Jones | 9 | 73.5 years |
| Moore | 8 | 83.4 years |
| Johnson | 8 | 85.4 years |
| Williams | 8 | 75.6 years |
| Murray | 7 | 71.6 years |
| Phillips | 7 | 74.8 years |
| Giles | 6 | 80.2 years |
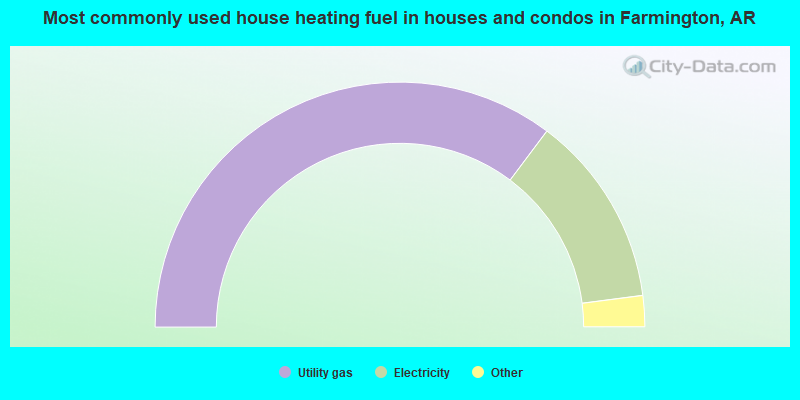
- 70.5%Utility gas
- 25.4%Electricity
- 2.5%Bottled, tank, or LP gas
- 1.6%Wood
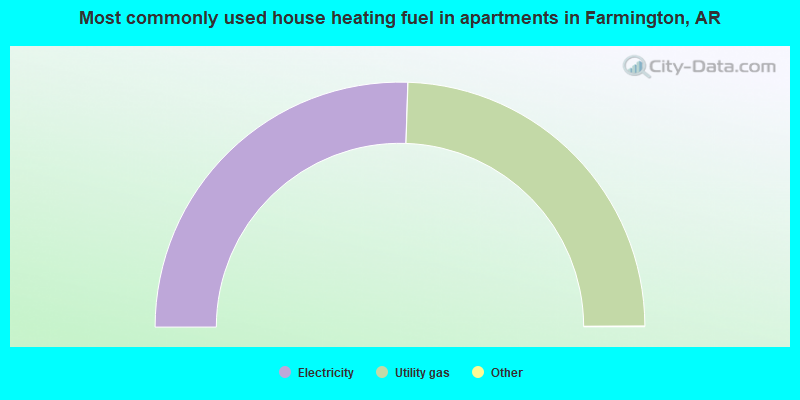
- 51.1%Electricity
- 48.9%Utility gas
Farmington compared to Arkansas state average:
- Unemployed percentage significantly below state average.
- Black race population percentage significantly below state average.
- Hispanic race population percentage above state average.
- Median age below state average.
- Length of stay since moving in significantly above state average.
- House age below state average.
Farmington on our top lists:
- #31 on the list of "Top 101 cities with the largest city-data.com crime index increase from 2002 to 2012 (population 5,000+)"
- #13 on the list of "Top 101 counties with highest percentage of residents voting for 3rd party candidates in the 2012 Presidential Election (pop. 50,000+)"
- #39 on the list of "Top 101 counties with the lowest percentage of residents that visited a dentist within the past year"
- #49 on the list of "Top 101 counties with the highest number of births per 1000 residents 2007-2013"
- #53 on the list of "Top 101 counties with the largest decrease in the number of deaths per 1000 residents 2000-2006 to 2007-2013 (pop. 50,000+)"
- #63 on the list of "Top 101 counties with the lowest average weight of females"

|
|
Total of 32 patent applications in 2008-2024.