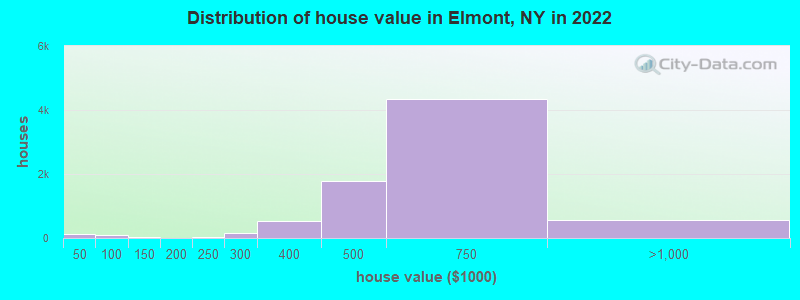
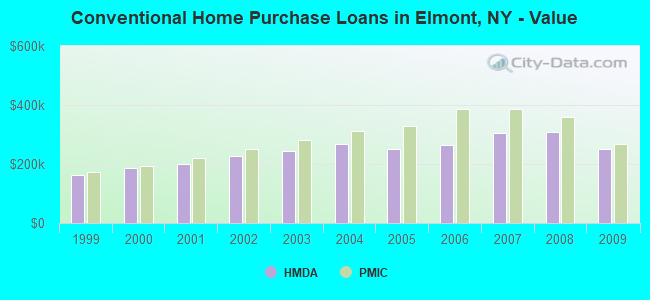
Estimated median house or condo value in 2022: $553,177 (it was $191,800 in 2000)
Elmont:
$553,177
NY:
$400,400
Mean prices in 2022:all housing units: $779,837; detached houses: $818,157; townhouses or other attached units: $921,906; in 2-unit structures: $649,689; in 3-to-4-unit structures: $388,210; in 5-or-more-unit structures: $438,581; mobile homes: over $1,000,000
Median gross rent in 2022: $2,123.
March 2022 cost of living index in Elmont: 151.8 (very high, U.S. average is 100)
Percentage of residents living in poverty in 2022: 4.4%
(6.2% for White Non-Hispanic residents, 1.7% for Black residents, 5.3% for Hispanic or Latino residents, 8.6% for other race residents, 10.0% for two or more races residents)
According to our research of New York and other state lists, there were 7 registered sex offenders living in Elmont, New York as of June 05, 2024. The ratio of all residents to sex offenders in Elmont is 5,312 to 1. The ratio of registered sex offenders to all residents in this city is much lower than the state average.
Recent articles from our blog. Our writers, many of them Ph.D. graduates or candidates, create easy-to-read articles on a wide variety of topics.
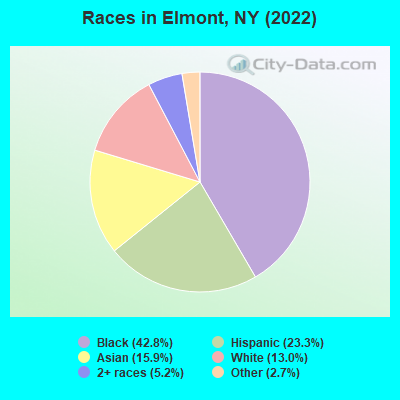
Ancestries: Haitian (17.1%), Jamaican (7.0%), Guyanese (6.8%), Italian (5.2%), British West Indian (1.9%), Trinidadian and Tobagonian (1.5%).
Current Local Time: EST time zone
Elevation: 43 feet
Land area: 3.41 square miles.
Population density: 9,749 people per square mile (high).
16,550 residents are foreign born (32.0% Latin America, 8.4% Asia).
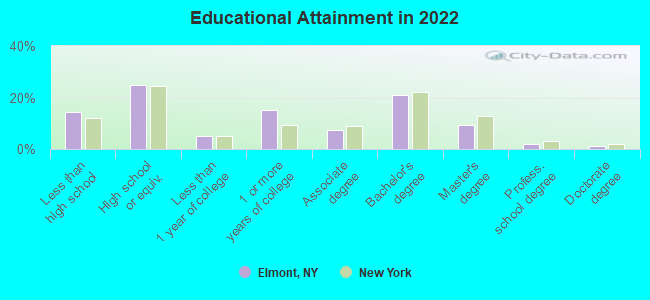
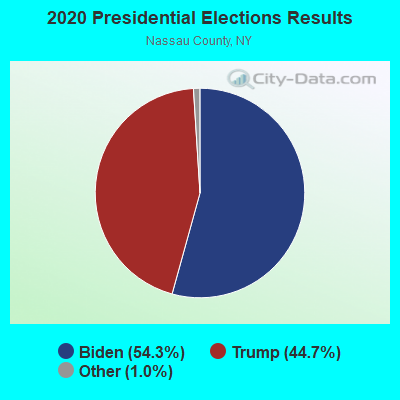
This place:
43.9%
New York:
22.6%
Median real estate property taxes paid for housing units with mortgages in 2022: $10,001 (1.7%) Median real estate property taxes paid for housing units with no mortgage in 2022: $10,001 (2.0%)
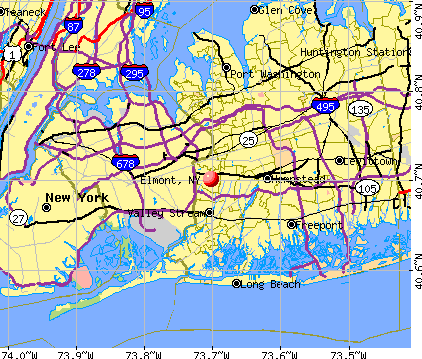
Nearest city with pop. 50,000+: Hempstead, NY (4.5 miles , pop. 56,554).
Nearest city with pop. 200,000+: North Hempstead, NY (5.6 miles , pop. 222,611).
Nearest city with pop. 1,000,000+: Queens, NY (6.2 miles , pop. 2,229,379).
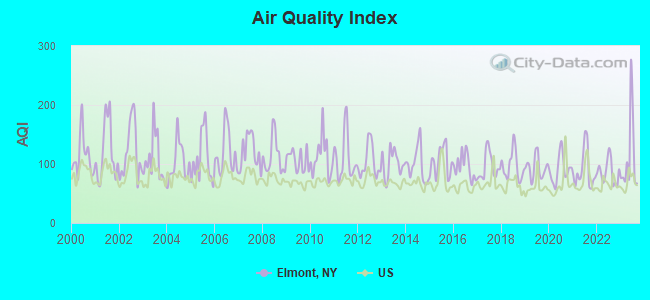
Air Quality Index (AQI) level in 2023 was 110. This is significantly worse than average.
City:
110
U.S.:
73
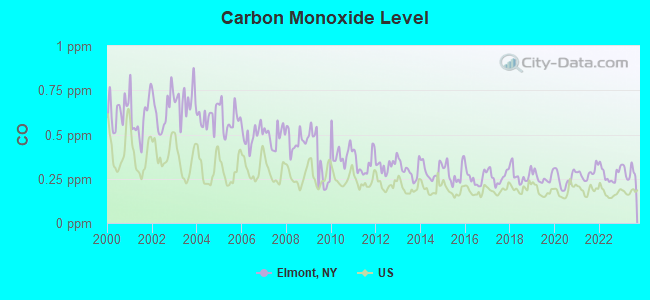
Carbon Monoxide (CO) [ppm] level in 2023 was 0.289. This is about average.Closest monitor was 3.8 miles away from the city center.
City:
0.289
U.S.:
0.251
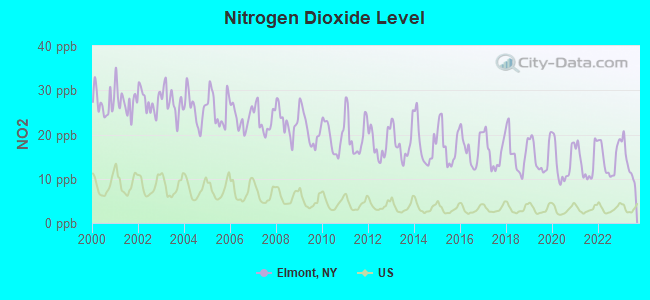
Nitrogen Dioxide (NO2) [ppb] level in 2023 was 13.6. This is significantly worse than average.Closest monitor was 4.7 miles away from the city center.
City:
13.6
U.S.:
5.1
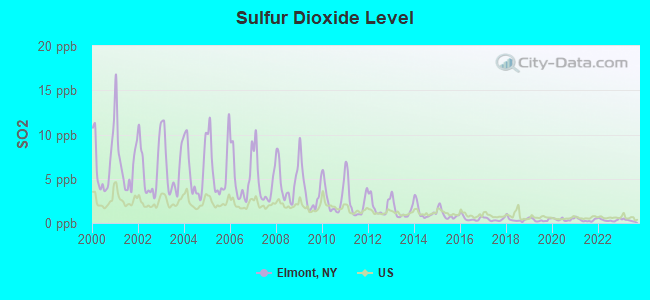
Sulfur Dioxide (SO2) [ppb] level in 2023 was 0.304. This is significantly better than average.Closest monitor was 0.8 miles away from the city center.
City:
0.304
U.S.:
1.515
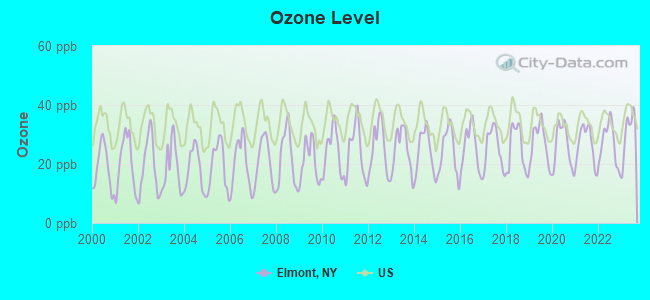
Ozone [ppb] level in 2023 was 30.5. This is about average.Closest monitor was 3.4 miles away from the city center.
City:
30.5
U.S.:
33.3
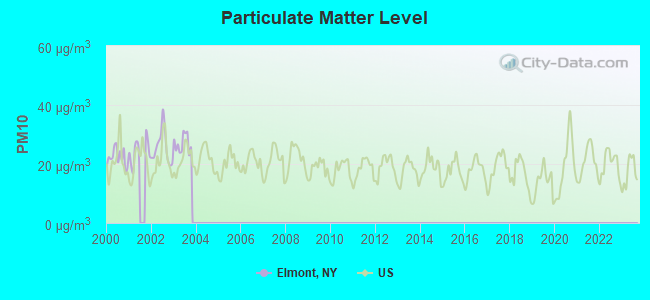
Particulate Matter (PM10) [µg/m3] level in 2003 was 26.9. This is worse than average.Closest monitor was 6.5 miles away from the city center.
City:
26.9
U.S.:
19.2
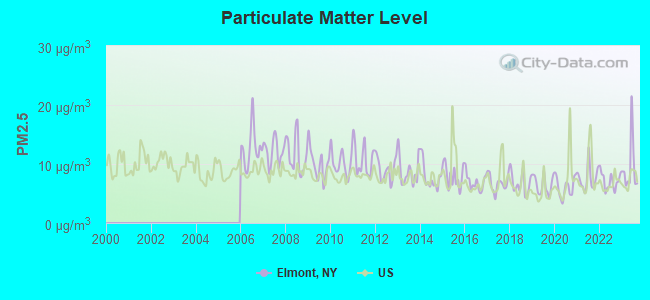
Particulate Matter (PM2.5) [µg/m3] level in 2023 was 9.37. This is about average.Closest monitor was 4.7 miles away from the city center.
City:
9.37
U.S.:
8.11
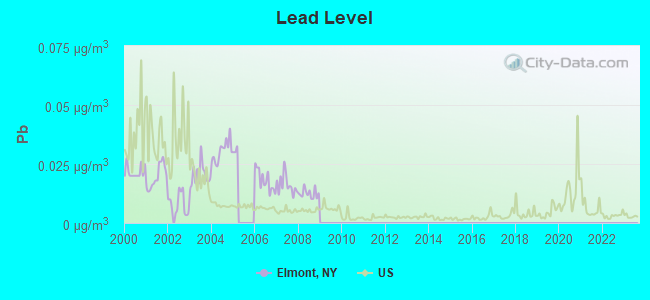
Lead (Pb) [µg/m3] level in 2008 was 0.0125. This is worse than average.Closest monitor was 6.8 miles away from the city center.
City:
0.0125
U.S.:
0.0093
Tornado activity:
Elmont-area historical tornado activity is slightly above New York state average. It is 49% smaller than the overall U.S. average.
On 9/7/1998, a category F2 (max. wind speeds 113-157 mph) tornado 3.8 miles away from the Elmont place center injured 6 peopleand caused $1 million in damages.
On 9/27/1970, a category F2 tornado 10.6 miles away from the place center causedbetween $50,000 and $500,000 in damages.
Earthquake activity:
Elmont-area historical earthquake activity is significantly above New York state average. It is 70% smaller than the overall U.S. average.
On 8/23/2011 at 17:51:04, a magnitude 5.8 (5.8 MW, Depth: 3.7 mi, Class: Moderate, Intensity: VI - VII) earthquake occurred 297.7 miles away from the city center On 10/7/1983 at 10:18:46, a magnitude 5.3 (5.1 MB, 5.3 LG, 5.1 ML) earthquake occurred 227.3 miles away from Elmont center On 1/16/1994 at 01:49:16, a magnitude 4.6 (4.6 MB, 4.6 LG, Depth: 3.1 mi, Class: Light, Intensity: IV - V) earthquake occurred 125.4 miles away from the city center On 4/20/2002 at 10:50:47, a magnitude 5.3 (5.3 ML, Depth: 3.0 mi) earthquake occurred 263.6 miles away from Elmont center On 4/20/2002 at 10:50:47, a magnitude 5.2 (5.2 MB, 4.2 MS, 5.2 MW, 5.0 MW) earthquake occurred 261.8 miles away from the city center On 8/22/1992 at 12:20:32, a magnitude 4.8 (4.8 MB, 3.8 MS, 4.7 LG, Depth: 6.2 mi) earthquake occurred 210.7 miles away from Elmont center Magnitude types: regional Lg-wave magnitude (LG), body-wave magnitude (MB), local magnitude (ML), surface-wave magnitude (MS), moment magnitude (MW)
Natural disasters:
The number of natural disasters in Nassau County (25) is a lot greater than the US average (15). Major Disasters (Presidential) Declared: 17 Emergencies Declared: 7
Causes of natural disasters: Hurricanes: 8, Storms: 7, Floods: 6, Blizzards: 2, Snowstorms: 2, Heavy Rain: 1, Power Outage: 1, Tropical Depression: 1, Tropical Storm: 1, Water Shortage: 1, Winter Storm: 1, Other: 3 (Note: some incidents may be assigned to more than one category).
Hospitals and medical centers near Elmont:
FRANKLIN PARK NH (Nursing Home, about 2 miles away; FRANKLIN SQUARE, NY)
GARDEN CARE CENTER (Nursing Home, about 2 miles away; FRANKLIN SQUARE, NY)
FRANKLIN HOSPITAL Acute Care Hospitals (about 3 miles away; VALLEY STREAM, NY)
ORZAC CENTER FOR EXTENDED CARE AND REHABILITATION (Nursing Home, about 3 miles away; VALLEY STREAM, NY)
NEW HYDE PARK DIALYSIS CENTER (Dialysis Facility, about 3 miles away; NEW HYDE PARK, NY)
WEST NASSAU DIALYSIS CTR, INC (Dialysis Facility, about 3 miles away; VALLEY STREAM, NY)
FRANKLIN HOSPITAL MEDICAL CENTER CHHA (Home Health Center, about 4 miles away; LYNBROOK, NY)
6 miles: KENNEDY AIRPORT NEW YORK (QUEENS, ) - Bus Station . Services: enclosed waiting area, public restrooms, public payphones, snack bar and vending machines, ATM, paid short-term parking, paid long-term parking, car rental agency, taxi stand.
11 miles: LA GUARDIA AIRPORT (QUEENS, ) - Bus Station . Services: enclosed waiting area, public restrooms, public payphones, snack bar and vending machines, ATM, paid short-term parking, paid long-term parking, car rental agency, taxi stand.
16 miles: NEW ROCHELLE (DEPOT PLAZA NORTH) . Services: enclosed waiting area, public restrooms, public payphones, paid short-term parking, paid long-term parking, call for car rental service, taxi stand, public transit connection.
Colleges/universities with over 2000 students nearest to Elmont:
Adelphi University (about 3 miles; Garden City, NY; Full-time enrollment: 7,312)
Molloy College (about 5 miles; Rockville Centre, NY; FT enrollment: 3,962)
CUNY Queensborough Community College (about 5 miles; Bayside, NY; FT enrollment: 11,931)
CUNY York College (about 5 miles; Jamaica, NY; FT enrollment: 6,312)
St John's University-New York (about 6 miles; Queens, NY; FT enrollment: 15,175)
Hofstra University (about 6 miles; Hempstead, NY; FT enrollment: 9,429)
Nassau Community College (about 7 miles; Garden City, NY; FT enrollment: 18,552)
Churches in Elmont include: Church of Saint Matthew (A), India Gospel Assembly Church (B), Korean Church of Greater New York (C), Saint Basil Orthodox Church (D), Gospel Faith Mission International (E), Trinity Baptist Church French Ministry (F), Salem Assembly of God (G), Saint Boniface Roman Catholic Church (H), Saint Gregorios Orthodox Church (I). Display/hide their locations on the map
Birthplace of: Zara Northover - Athletics competitor, Dwayne Byfield - College basketball player (Monmouth (N.J.) Hawks), Jim Ferry (basketball) - Basketball player-coach.
Nassau County has a predicted average indoor radon screening level less than 2 pCi/L (pico curies per liter) - Low Potential
Average household size:
This place:
3.4 people
New York:
2.6 people
Percentage of family households:
This place:
77.7%
Whole state:
63.5%
Percentage of households with unmarried partners:
This place:
4.6%
Whole state:
6.8%
Likely homosexual households (counted as self-reported same-sex unmarried-partner households)
Lesbian couples: 0.4% of all households
Gay men: 0.2% of all households
23 people in residential treatment centers for adults in 2010
7 people in other noninstitutional facilities in 2010
People in group quarters in Elmont in 2000:
30 people in other noninstitutional group quarters
20 people in religious group quarters
19 people in homes for the mentally ill
15 people in homes for the mentally retarded
Banks with branches in Elmont (2011 data):
JPMorgan Chase Bank, National Association: Broadway Branch at 1644 Dutch Broadway, branch established on 1957/10/19; Alden Manor Branch at 239 Linden Boulevard, branch established on 1960/02/27. Info updated 2011/11/10: Bank assets: $1,811,678.0 mil, Deposits: $1,190,738.0 mil, headquarters in Columbus, OH, positive income, International Specialization, 5577 total offices, Holding Company: Jpmorgan Chase & Co.
Emigrant Savings Bank - Long Island: Elmont Branch at 1693 Hempstead Turnpike, branch established on 1961/12/08. Info updated 2006/11/03: Bank assets: $549.9 mil, Deposits: $490.3 mil, headquarters in Westbury, NY, positive income, Mortgage Lending Specialization, 7 total offices, Holding Company: New York Private Bank & Trust Corporation
Bank of America, National Association: Elmont Branch at 1431 Hempstead Turnpike, branch established on 1960/07/25. Info updated 2009/11/18: Bank assets: $1,451,969.3 mil, Deposits: $1,077,176.8 mil, headquarters in Charlotte, NC, positive income, 5782 total offices, Holding Company: Bank Of America Corporation
Capital One, National Association: Elmont Branch at 620 Hempstead Turnpike, branch established on 1980/02/11. Info updated 2011/07/01: Bank assets: $133,477.8 mil, Deposits: $97,063.7 mil, headquarters in Mclean, VA, positive income, 984 total offices, Holding Company: Capital One Financial Corporation
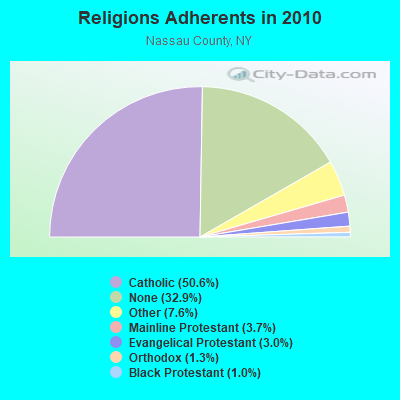
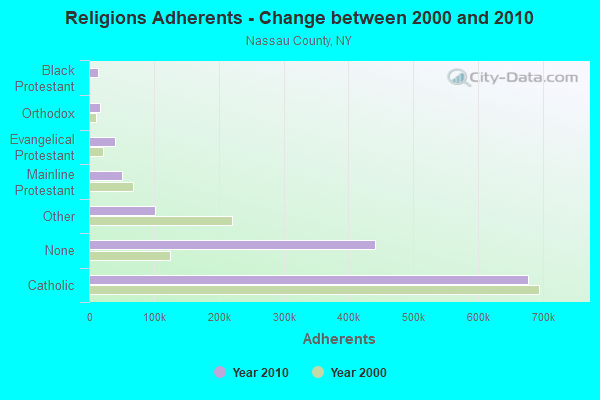
Religion statistics for Elmont, NY (based on Nassau County data)
Religion
Adherents
Congregations
Catholic
677,149
73
Other
102,012
168
Mainline Protestant
50,181
184
Evangelical Protestant
39,923
251
Orthodox
16,758
22
Black Protestant
13,189
45
None
440,320
-
Source: Clifford Grammich, Kirk Hadaway, Richard Houseal, Dale E.Jones, Alexei Krindatch, Richie Stanley and Richard H.Taylor. 2012. 2010 U.S.Religion Census: Religious Congregations & Membership Study. Association of Statisticians of American Religious Bodies. Jones, Dale E., et al. 2002. Congregations and Membership in the United States 2000. Nashville, TN: Glenmary Research Center. Graphs represent county-level data
Aircraft: PIPER PA-28-161 (Category: Land, Seats: 4, Weight: Up to 12,499 Pounds, Speed: 108 mph), Engine: LYCOMING 0-320 SERIES (180 HP) (Reciprocating) N-Number: 81972, N81972, N-81972, Serial Number: 28-8016318, Year manufactured: 1980, Airworthiness Date: 03/31/1980, Certificate Issue Date: 12/02/2015 Registrant (Individual): Roy H Reile, 271 Oakley Ave, Elmont, NY 11003
Aircraft: BENSEN HYDROCOPTER C-B8-MJWP (Category: Amphibian, Weight: Up to 12,499 Pounds, Speed: 45 mph), Engine: MCCULLOCH 4318A&E/0-100 (72 HP) (Reciprocating) N-Number: 1591, N1591, N-1591, Serial Number: 21211196, Year manufactured: 1967 Registrant (Individual): Paola Vito W De, 1591 Dutch Broadway, Elmont, NY 11580
Aircraft: PIPER PA-28-140 (Category: Land, Seats: 4, Weight: Up to 12,499 Pounds, Speed: 107 mph), Engine: LYCOMING 0-320 SERIES (180 HP) (Reciprocating) N-Number: 7192R, N7192R, N-7192R, Serial Number: 28-21905, Year manufactured: 1966, Certificate Issue Date: 05/27/1971 Registrant (Partnership): George P Caponetti, 805 Home St, Elmont, NY 11003, Other Owners: Nickolas Spada Deregistered:Cancel Date: 02/04/2017
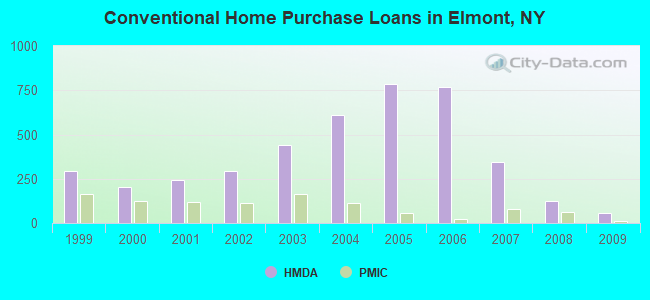
Home Mortgage Disclosure Act Aggregated Statistics For Year 2009 (Based on 5 full and 1 partial tracts)
A) FHA, FSA/RHS & VA Home Purchase Loans
B) Conventional Home Purchase Loans
C) Refinancings
D) Home Improvement Loans
F) Non-occupant Loans on < 5 Family Dwellings (A B C & D)
G) Loans On Manufactured Home Dwelling (A B C & D)
Number
Average Value
Number
Average Value
Number
Average Value
Number
Average Value
Number
Average Value
Number
Average Value
LOANS ORIGINATED
105
$310,763
56
$251,349
192
$263,585
23
$102,180
8
$248,918
1
$322,090
APPLICATIONS APPROVED, NOT ACCEPTED
11
$305,364
5
$159,592
47
$272,471
10
$44,160
2
$257,950
0
$0
APPLICATIONS DENIED
37
$317,782
44
$259,611
253
$294,841
37
$82,554
12
$212,500
2
$246,000
APPLICATIONS WITHDRAWN
22
$282,258
16
$248,316
112
$299,766
3
$201,000
6
$223,500
0
$0
FILES CLOSED FOR INCOMPLETENESS
6
$330,902
7
$208,159
42
$283,019
4
$57,500
1
$220,000
0
$0
Aggregated Statistics For Year 2008 (Based on 5 full and 1 partial tracts)
A) FHA, FSA/RHS & VA Home Purchase Loans
B) Conventional Home Purchase Loans
C) Refinancings
D) Home Improvement Loans
F) Non-occupant Loans on < 5 Family Dwellings (A B C & D)
Number
Average Value
Number
Average Value
Number
Average Value
Number
Average Value
Number
Average Value
LOANS ORIGINATED
46
$355,119
126
$308,407
208
$286,865
62
$96,643
22
$253,594
APPLICATIONS APPROVED, NOT ACCEPTED
5
$331,192
33
$324,457
73
$290,875
28
$48,877
7
$299,714
APPLICATIONS DENIED
20
$338,780
114
$330,844
425
$326,959
124
$60,000
38
$313,121
APPLICATIONS WITHDRAWN
17
$361,765
27
$347,846
120
$327,427
10
$186,380
6
$308,137
FILES CLOSED FOR INCOMPLETENESS
1
$324,000
19
$338,735
46
$337,624
8
$251,295
4
$311,225
Aggregated Statistics For Year 2007 (Based on 5 full and 1 partial tracts)
A) FHA, FSA/RHS & VA Home Purchase Loans
B) Conventional Home Purchase Loans
C) Refinancings
D) Home Improvement Loans
E) Loans on Dwellings For 5+ Families
F) Non-occupant Loans on < 5 Family Dwellings (A B C & D)
Number
Average Value
Number
Average Value
Number
Average Value
Number
Average Value
Number
Average Value
Number
Average Value
LOANS ORIGINATED
4
$343,250
347
$304,240
588
$301,357
118
$111,836
3
$340,667
37
$279,489
APPLICATIONS APPROVED, NOT ACCEPTED
0
$0
123
$321,172
213
$323,725
50
$99,976
0
$0
16
$290,871
APPLICATIONS DENIED
2
$322,000
383
$329,938
730
$331,549
158
$88,329
0
$0
51
$318,437
APPLICATIONS WITHDRAWN
0
$0
94
$308,807
267
$317,880
19
$166,579
0
$0
15
$248,462
FILES CLOSED FOR INCOMPLETENESS
0
$0
41
$346,892
94
$356,099
10
$148,513
0
$0
2
$240,500
Aggregated Statistics For Year 2006 (Based on 5 full and 1 partial tracts)
A) FHA, FSA/RHS & VA Home Purchase Loans
B) Conventional Home Purchase Loans
C) Refinancings
D) Home Improvement Loans
E) Loans on Dwellings For 5+ Families
F) Non-occupant Loans on < 5 Family Dwellings (A B C & D)
Number
Average Value
Number
Average Value
Number
Average Value
Number
Average Value
Number
Average Value
Number
Average Value
LOANS ORIGINATED
6
$331,490
766
$263,700
897
$288,620
129
$121,283
0
$0
55
$307,861
APPLICATIONS APPROVED, NOT ACCEPTED
0
$0
172
$251,157
220
$284,862
35
$105,056
0
$0
15
$279,435
APPLICATIONS DENIED
0
$0
539
$273,958
746
$293,931
150
$132,008
2
$604,000
47
$272,167
APPLICATIONS WITHDRAWN
1
$302,420
162
$293,171
446
$307,872
28
$197,208
0
$0
21
$263,666
FILES CLOSED FOR INCOMPLETENESS
0
$0
56
$278,294
134
$316,800
10
$161,239
0
$0
5
$258,120
Aggregated Statistics For Year 2005 (Based on 5 full and 1 partial tracts)
A) FHA, FSA/RHS & VA Home Purchase Loans
B) Conventional Home Purchase Loans
C) Refinancings
D) Home Improvement Loans
E) Loans on Dwellings For 5+ Families
F) Non-occupant Loans on < 5 Family Dwellings (A B C & D)
G) Loans On Manufactured Home Dwelling (A B C & D)
Number
Average Value
Number
Average Value
Number
Average Value
Number
Average Value
Number
Average Value
Number
Average Value
Number
Average Value
LOANS ORIGINATED
0
$0
786
$251,337
990
$273,845
116
$134,756
2
$432,025
45
$263,738
0
$0
APPLICATIONS APPROVED, NOT ACCEPTED
0
$0
129
$269,568
199
$266,691
27
$113,197
0
$0
12
$253,607
0
$0
APPLICATIONS DENIED
2
$311,500
312
$253,095
655
$278,697
166
$114,569
0
$0
34
$291,550
1
$440,060
APPLICATIONS WITHDRAWN
1
$228,000
238
$259,886
510
$256,742
62
$211,081
0
$0
35
$271,274
0
$0
FILES CLOSED FOR INCOMPLETENESS
0
$0
66
$241,868
257
$299,609
10
$196,705
0
$0
4
$235,610
0
$0
Aggregated Statistics For Year 2004 (Based on 5 full and 1 partial tracts)
A) FHA, FSA/RHS & VA Home Purchase Loans
B) Conventional Home Purchase Loans
C) Refinancings
D) Home Improvement Loans
E) Loans on Dwellings For 5+ Families
F) Non-occupant Loans on < 5 Family Dwellings (A B C & D)
G) Loans On Manufactured Home Dwelling (A B C & D)
Number
Average Value
Number
Average Value
Number
Average Value
Number
Average Value
Number
Average Value
Number
Average Value
Number
Average Value
LOANS ORIGINATED
12
$275,255
610
$267,753
1,032
$234,851
120
$153,553
1
$2,808,900
84
$247,206
2
$53,000
APPLICATIONS APPROVED, NOT ACCEPTED
0
$0
114
$273,416
262
$238,553
33
$91,637
0
$0
9
$289,778
1
$100,000
APPLICATIONS DENIED
2
$287,000
182
$254,079
624
$250,173
165
$80,044
1
$315,000
27
$240,242
3
$93,667
APPLICATIONS WITHDRAWN
2
$233,000
138
$265,858
537
$231,748
67
$96,163
0
$0
23
$206,420
3
$205,333
FILES CLOSED FOR INCOMPLETENESS
0
$0
48
$254,858
159
$258,229
6
$155,898
0
$0
1
$195,000
0
$0
Aggregated Statistics For Year 2003 (Based on 5 full and 1 partial tracts)
A) FHA, FSA/RHS & VA Home Purchase Loans
B) Conventional Home Purchase Loans
C) Refinancings
D) Home Improvement Loans
E) Loans on Dwellings For 5+ Families
F) Non-occupant Loans on < 5 Family Dwellings (A B C & D)
Number
Average Value
Number
Average Value
Number
Average Value
Number
Average Value
Number
Average Value
Number
Average Value
LOANS ORIGINATED
48
$244,505
443
$243,344
1,498
$201,109
72
$42,634
2
$395,500
52
$191,022
APPLICATIONS APPROVED, NOT ACCEPTED
2
$230,510
67
$247,270
349
$196,441
27
$50,341
0
$0
17
$174,575
APPLICATIONS DENIED
2
$287,500
115
$269,770
709
$209,396
111
$43,140
0
$0
25
$223,963
APPLICATIONS WITHDRAWN
9
$268,678
57
$253,064
541
$201,711
31
$65,952
0
$0
17
$173,833
FILES CLOSED FOR INCOMPLETENESS
0
$0
15
$251,266
89
$200,683
5
$36,000
0
$0
2
$251,865
Aggregated Statistics For Year 2002 (Based on 3 full and 1 partial tracts)
A) FHA, FSA/RHS & VA Home Purchase Loans
B) Conventional Home Purchase Loans
C) Refinancings
D) Home Improvement Loans
E) Loans on Dwellings For 5+ Families
F) Non-occupant Loans on < 5 Family Dwellings (A B C & D)
Number
Average Value
Number
Average Value
Number
Average Value
Number
Average Value
Number
Average Value
Number
Average Value
LOANS ORIGINATED
34
$229,359
291
$225,997
729
$178,605
53
$46,075
1
$123,000
36
$194,449
APPLICATIONS APPROVED, NOT ACCEPTED
3
$205,333
31
$214,905
177
$180,537
22
$46,685
0
$0
5
$200,450
APPLICATIONS DENIED
5
$207,278
86
$230,939
401
$159,964
83
$38,453
0
$0
11
$158,041
APPLICATIONS WITHDRAWN
4
$250,500
46
$197,438
255
$162,654
38
$46,860
0
$0
7
$128,504
FILES CLOSED FOR INCOMPLETENESS
2
$261,500
10
$205,100
93
$160,308
2
$48,725
0
$0
6
$148,167
Aggregated Statistics For Year 2001 (Based on 3 full and 1 partial tracts)
A) FHA, FSA/RHS & VA Home Purchase Loans
B) Conventional Home Purchase Loans
C) Refinancings
D) Home Improvement Loans
F) Non-occupant Loans on < 5 Family Dwellings (A B C & D)
Number
Average Value
Number
Average Value
Number
Average Value
Number
Average Value
Number
Average Value
LOANS ORIGINATED
78
$205,010
243
$199,248
497
$160,246
47
$35,491
33
$152,725
APPLICATIONS APPROVED, NOT ACCEPTED
4
$180,802
32
$185,286
136
$140,680
22
$52,028
2
$134,475
APPLICATIONS DENIED
21
$200,897
68
$201,149
349
$127,830
92
$32,486
17
$126,227
APPLICATIONS WITHDRAWN
17
$204,542
45
$204,065
248
$142,766
44
$28,970
4
$148,068
FILES CLOSED FOR INCOMPLETENESS
0
$0
8
$188,474
77
$146,583
3
$105,000
2
$119,700
Aggregated Statistics For Year 2000 (Based on 3 full and 1 partial tracts)
A) FHA, FSA/RHS & VA Home Purchase Loans
B) Conventional Home Purchase Loans
C) Refinancings
D) Home Improvement Loans
F) Non-occupant Loans on < 5 Family Dwellings (A B C & D)
Number
Average Value
Number
Average Value
Number
Average Value
Number
Average Value
Number
Average Value
LOANS ORIGINATED
90
$189,399
206
$186,187
171
$112,348
69
$24,910
16
$132,030
APPLICATIONS APPROVED, NOT ACCEPTED
13
$175,948
30
$182,391
51
$114,974
48
$33,765
3
$128,000
APPLICATIONS DENIED
11
$196,228
101
$188,657
245
$104,848
109
$39,171
11
$80,818
APPLICATIONS WITHDRAWN
16
$182,071
36
$200,092
223
$93,434
19
$33,478
7
$84,427
FILES CLOSED FOR INCOMPLETENESS
7
$158,974
8
$174,281
64
$143,111
2
$8,000
2
$170,675
Aggregated Statistics For Year 1999 (Based on 3 full and 2 partial tracts)
A) FHA, FSA/RHS & VA Home Purchase Loans
B) Conventional Home Purchase Loans
C) Refinancings
D) Home Improvement Loans
E) Loans on Dwellings For 5+ Families
F) Non-occupant Loans on < 5 Family Dwellings (A B C & D)
2003 - 2018 National Fire Incident Reporting System (NFIRS) incidents
Based on the data from the years 2003 - 2018 the average number of fire incidents per year is 57. The highest number of reported fire incidents - 553 took place in 2006, and the least - 2 in 2005. The data has a dropping trend.
When looking into fire subcategories, the most incidents belonged to: Other (63.1%), and Structure Fires (32.8%).
Fire incident types reported to NFIRS in Elmont, NY


 Recent articles from our blog. Our writers, many of them Ph.D. graduates or candidates, create easy-to-read articles on a wide variety of topics.

 (4.5 miles


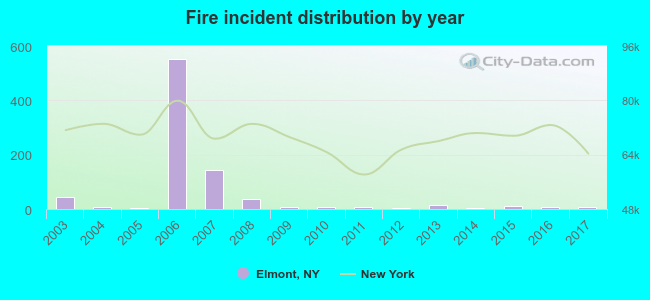 Based on the data from the years 2003 - 2018 the average number of fire incidents per year is 57. The highest number of reported fire incidents - 553 took place in 2006, and the least - 2 in 2005. The data has a dropping trend.
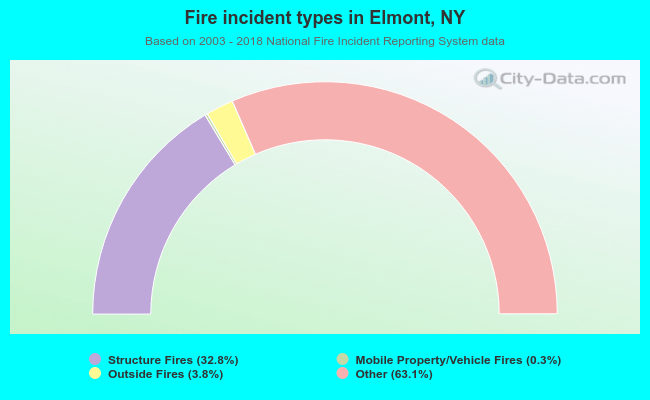 When looking into fire subcategories, the most incidents belonged to: Other (63.1%), and Structure Fires (32.8%).