Dunellen, New Jersey Submit your own pictures of this borough and show them to the world
OSM Map
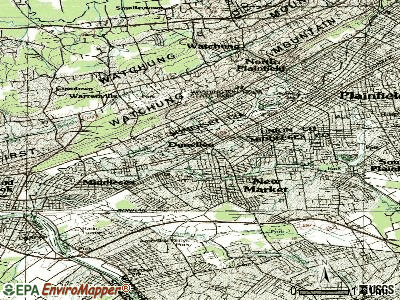
General Map
Google Map
MSN Map
OSM Map
General Map
Google Map
MSN Map
OSM Map
General Map
Google Map
MSN Map
OSM Map
General Map
Google Map
MSN Map
Please wait while loading the map...
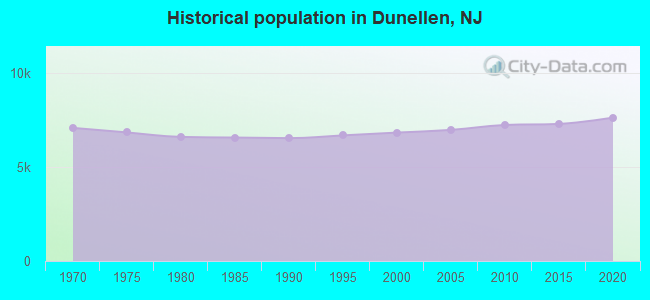
Population in 2022: 7,575 (100% urban, 0% rural). Population change since 2000: +11.0%Males: 4,065 Females: 3,510
March 2022 cost of living index in Dunellen: 120.5 (high, U.S. average is 100) Percentage of residents living in poverty in 2022: 20.0%for White Non-Hispanic residents , 28.6% for Black residents , 31.6% for Hispanic or Latino residents , 24.6% for other race residents , 35.9% for two or more races residents )
Profiles of local businesses
Business Search - 14 Million verified businesses
Data:
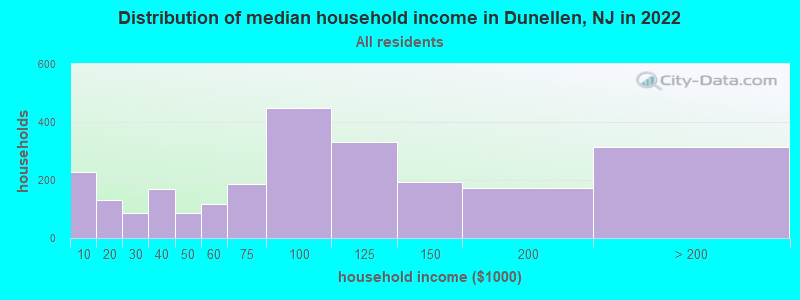
Median household income ($)
Median household income (% change since 2000)
Household income diversity
Ratio of average income to average house value (%)
Ratio of average income to average rent
Median household income ($) - White
Median household income ($) - Black or African American
Median household income ($) - Asian
Median household income ($) - Hispanic or Latino
Median household income ($) - American Indian and Alaska Native
Median household income ($) - Multirace
Median household income ($) - Other Race
Median household income for houses/condos with a mortgage ($)
Median household income for apartments without a mortgage ($)
Races - White alone (%)
Races - White alone (% change since 2000)
Races - Black alone (%)
Races - Black alone (% change since 2000)
Races - American Indian alone (%)
Races - American Indian alone (% change since 2000)
Races - Asian alone (%)
Races - Asian alone (% change since 2000)
Races - Hispanic (%)
Races - Hispanic (% change since 2000)
Races - Native Hawaiian and Other Pacific Islander alone (%)
Races - Native Hawaiian and Other Pacific Islander alone (% change since 2000)
Races - Two or more races (%)
Races - Two or more races (% change since 2000)
Races - Other race alone (%)
Races - Other race alone (% change since 2000)
Racial diversity
Unemployment (%)
Unemployment (% change since 2000)
Unemployment (%) - White
Unemployment (%) - Black or African American
Unemployment (%) - Asian
Unemployment (%) - Hispanic or Latino
Unemployment (%) - American Indian and Alaska Native
Unemployment (%) - Multirace
Unemployment (%) - Other Race
Population density (people per square mile)
Population - Males (%)
Population - Females (%)
Population - Males (%) - White
Population - Males (%) - Black or African American
Population - Males (%) - Asian
Population - Males (%) - Hispanic or Latino
Population - Males (%) - American Indian and Alaska Native
Population - Males (%) - Multirace
Population - Males (%) - Other Race
Population - Females (%) - White
Population - Females (%) - Black or African American
Population - Females (%) - Asian
Population - Females (%) - Hispanic or Latino
Population - Females (%) - American Indian and Alaska Native
Population - Females (%) - Multirace
Population - Females (%) - Other Race
Coronavirus confirmed cases (Jun 05, 2024)
Deaths caused by coronavirus (Jun 05, 2024)
Coronavirus confirmed cases (per 100k population) (Jun 05, 2024)
Deaths caused by coronavirus (per 100k population) (Jun 05, 2024)
Daily increase in number of cases (Jun 05, 2024)
Weekly increase in number of cases (Jun 05, 2024)
Cases doubled (in days) (Jun 05, 2024)
Hospitalized patients (Apr 18, 2022)
Negative test results (Apr 18, 2022)
Total test results (Apr 18, 2022)
COVID Vaccine doses distributed (per 100k population) (Sep 19, 2023)
COVID Vaccine doses administered (per 100k population) (Sep 19, 2023)
COVID Vaccine doses distributed (Sep 19, 2023)
COVID Vaccine doses administered (Sep 19, 2023)
Likely homosexual households (%)
Likely homosexual households (% change since 2000)
Likely homosexual households - Lesbian couples (%)
Likely homosexual households - Lesbian couples (% change since 2000)
Likely homosexual households - Gay men (%)
Likely homosexual households - Gay men (% change since 2000)
Cost of living index
Median gross rent ($)
Median contract rent ($)
Median monthly housing costs ($)
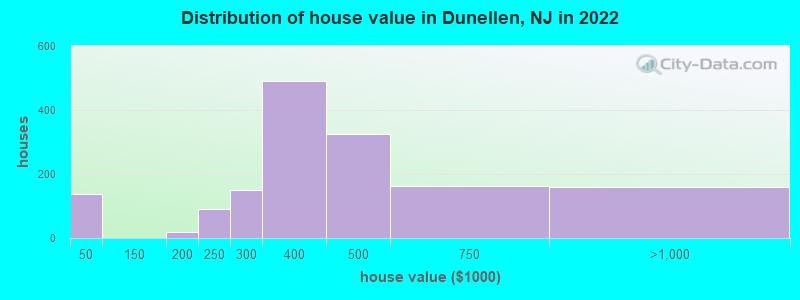
Median house or condo value ($)
Median house or condo value ($ change since 2000)
Mean house or condo value by units in structure - 1, detached ($)
Mean house or condo value by units in structure - 1, attached ($)
Mean house or condo value by units in structure - 2 ($)
Mean house or condo value by units in structure by units in structure - 3 or 4 ($)
Mean house or condo value by units in structure - 5 or more ($)
Mean house or condo value by units in structure - Boat, RV, van, etc. ($)
Mean house or condo value by units in structure - Mobile home ($)
Median house or condo value ($) - White
Median house or condo value ($) - Black or African American
Median house or condo value ($) - Asian
Median house or condo value ($) - Hispanic or Latino
Median house or condo value ($) - American Indian and Alaska Native
Median house or condo value ($) - Multirace
Median house or condo value ($) - Other Race
Median resident age
Resident age diversity
Median resident age - Males
Median resident age - Females
Median resident age - White
Median resident age - Black or African American
Median resident age - Asian
Median resident age - Hispanic or Latino
Median resident age - American Indian and Alaska Native
Median resident age - Multirace
Median resident age - Other Race
Median resident age - Males - White
Median resident age - Males - Black or African American
Median resident age - Males - Asian
Median resident age - Males - Hispanic or Latino
Median resident age - Males - American Indian and Alaska Native
Median resident age - Males - Multirace
Median resident age - Males - Other Race
Median resident age - Females - White
Median resident age - Females - Black or African American
Median resident age - Females - Asian
Median resident age - Females - Hispanic or Latino
Median resident age - Females - American Indian and Alaska Native
Median resident age - Females - Multirace
Median resident age - Females - Other Race
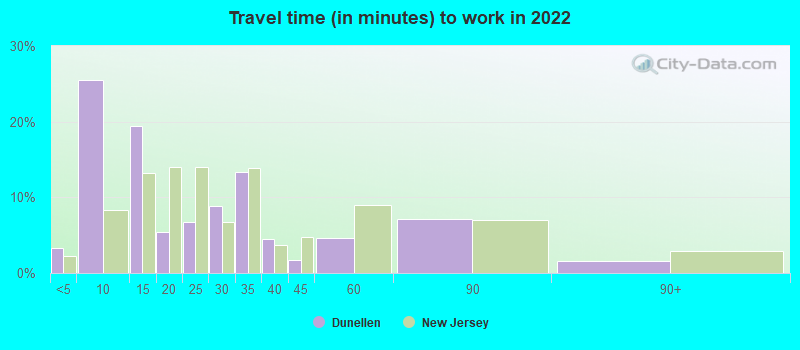
Commute - mean travel time to work (minutes)
Travel time to work - Less than 5 minutes (%)
Travel time to work - Less than 5 minutes (% change since 2000)
Travel time to work - 5 to 9 minutes (%)
Travel time to work - 5 to 9 minutes (% change since 2000)
Travel time to work - 10 to 19 minutes (%)
Travel time to work - 10 to 19 minutes (% change since 2000)
Travel time to work - 20 to 29 minutes (%)
Travel time to work - 20 to 29 minutes (% change since 2000)
Travel time to work - 30 to 39 minutes (%)
Travel time to work - 30 to 39 minutes (% change since 2000)
Travel time to work - 40 to 59 minutes (%)
Travel time to work - 40 to 59 minutes (% change since 2000)
Travel time to work - 60 to 89 minutes (%)
Travel time to work - 60 to 89 minutes (% change since 2000)
Travel time to work - 90 or more minutes (%)
Travel time to work - 90 or more minutes (% change since 2000)
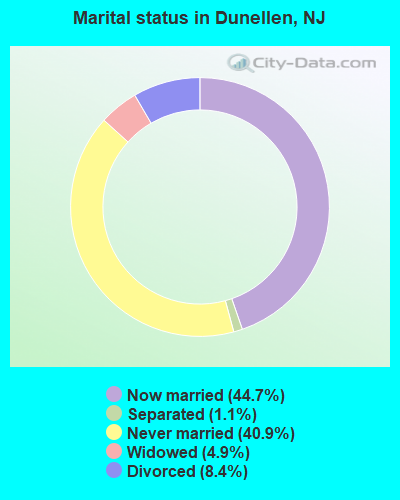
Marital status - Never married (%)
Marital status - Now married (%)
Marital status - Separated (%)
Marital status - Widowed (%)
Marital status - Divorced (%)
Median family income ($)
Median family income (% change since 2000)
Median non-family income ($)
Median non-family income (% change since 2000)
Median per capita income ($)
Median per capita income (% change since 2000)
Median family income ($) - White
Median family income ($) - Black or African American
Median family income ($) - Asian
Median family income ($) - Hispanic or Latino
Median family income ($) - American Indian and Alaska Native
Median family income ($) - Multirace
Median family income ($) - Other Race
Median year house/condo built
Median year apartment built
Year house built - Built 2005 or later (%)
Year house built - Built 2000 to 2004 (%)
Year house built - Built 1990 to 1999 (%)
Year house built - Built 1980 to 1989 (%)
Year house built - Built 1970 to 1979 (%)
Year house built - Built 1960 to 1969 (%)
Year house built - Built 1950 to 1959 (%)
Year house built - Built 1940 to 1949 (%)
Year house built - Built 1939 or earlier (%)
Average household size
Household density (households per square mile)
Average household size - White
Average household size - Black or African American
Average household size - Asian
Average household size - Hispanic or Latino
Average household size - American Indian and Alaska Native
Average household size - Multirace
Average household size - Other Race
Occupied housing units (%)
Vacant housing units (%)
Owner occupied housing units (%)
Renter occupied housing units (%)
Vacancy status - For rent (%)
Vacancy status - For sale only (%)
Vacancy status - Rented or sold, not occupied (%)
Vacancy status - For seasonal, recreational, or occasional use (%)
Vacancy status - For migrant workers (%)
Vacancy status - Other vacant (%)
Residents with income below the poverty level (%)
Residents with income below 50% of the poverty level (%)
Children below poverty level (%)
Poor families by family type - Married-couple family (%)
Poor families by family type - Male, no wife present (%)
Poor families by family type - Female, no husband present (%)
Poverty status for native-born residents (%)
Poverty status for foreign-born residents (%)
Poverty among high school graduates not in families (%)
Poverty among people who did not graduate high school not in families (%)
Residents with income below the poverty level (%) - White
Residents with income below the poverty level (%) - Black or African American
Residents with income below the poverty level (%) - Asian
Residents with income below the poverty level (%) - Hispanic or Latino
Residents with income below the poverty level (%) - American Indian and Alaska Native
Residents with income below the poverty level (%) - Multirace
Residents with income below the poverty level (%) - Other Race
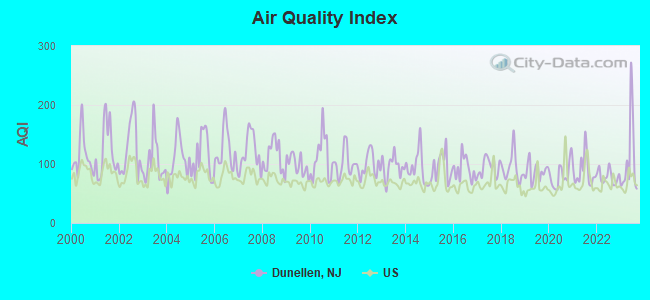
Air pollution - Air Quality Index (AQI)
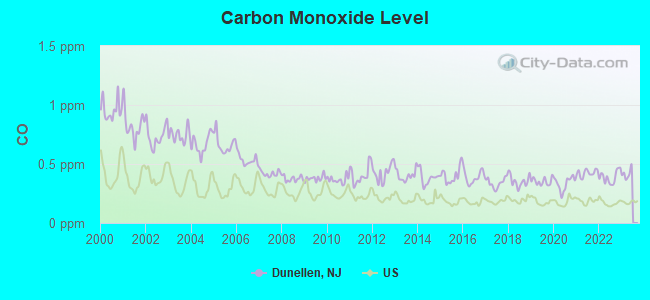
Air pollution - CO
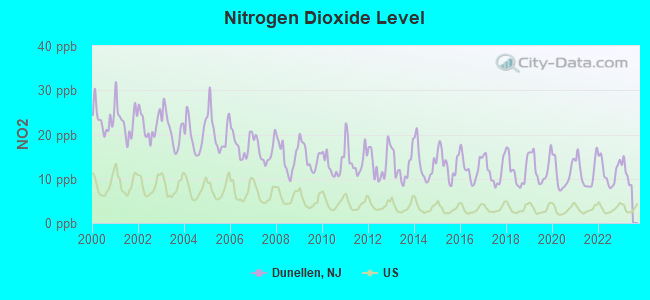
Air pollution - NO2
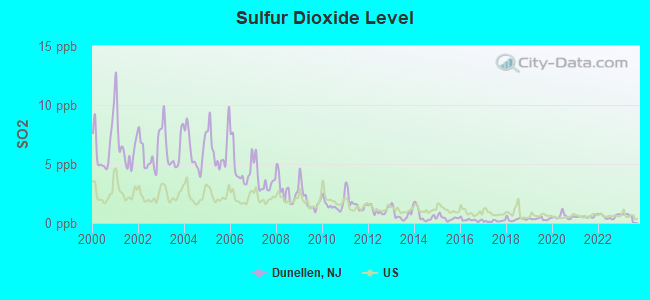
Air pollution - SO2
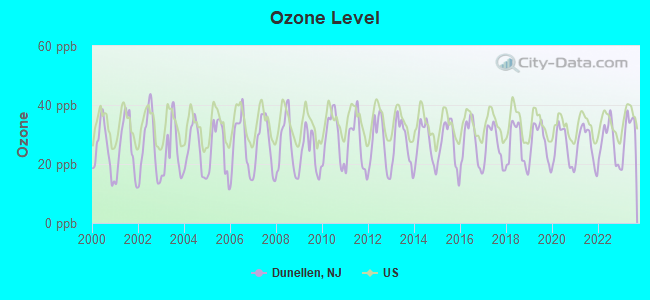
Air pollution - Ozone
Air pollution - PM10
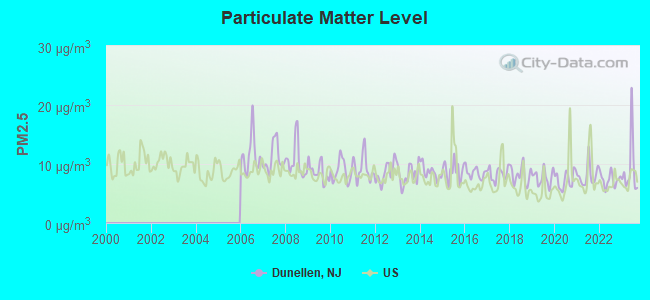
Air pollution - PM25
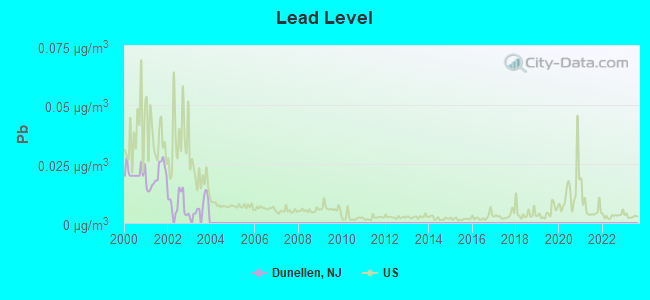
Air pollution - Pb
Crime - Murders per 100,000 population
Crime - Rapes per 100,000 population
Crime - Robberies per 100,000 population
Crime - Assaults per 100,000 population
Crime - Burglaries per 100,000 population
Crime - Thefts per 100,000 population
Crime - Auto thefts per 100,000 population
Crime - Arson per 100,000 population
Crime - City-data.com crime index
Crime - Violent crime index
Crime - Property crime index
Crime - Murders per 100,000 population (5 year average)
Crime - Rapes per 100,000 population (5 year average)
Crime - Robberies per 100,000 population (5 year average)
Crime - Assaults per 100,000 population (5 year average)
Crime - Burglaries per 100,000 population (5 year average)
Crime - Thefts per 100,000 population (5 year average)
Crime - Auto thefts per 100,000 population (5 year average)
Crime - Arson per 100,000 population (5 year average)
Crime - City-data.com crime index (5 year average)
Crime - Violent crime index (5 year average)
Crime - Property crime index (5 year average)
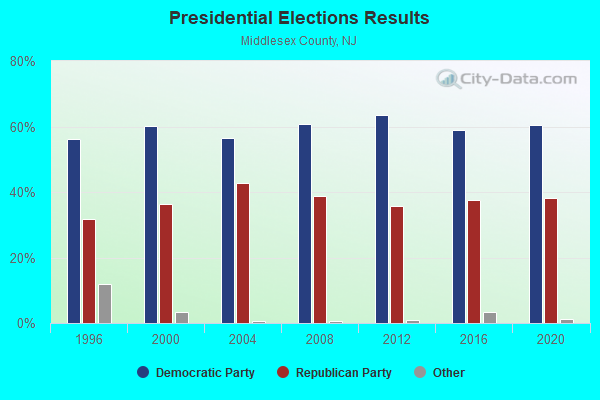
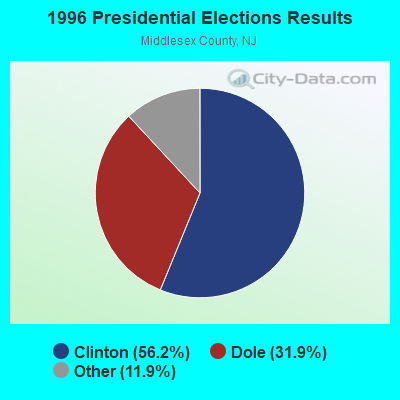
1996 Presidential Elections Results (%) - Democratic Party (Clinton)
1996 Presidential Elections Results (%) - Republican Party (Dole)
1996 Presidential Elections Results (%) - Other
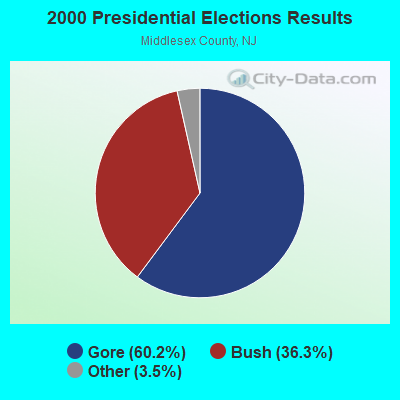
2000 Presidential Elections Results (%) - Democratic Party (Gore)
2000 Presidential Elections Results (%) - Republican Party (Bush)
2000 Presidential Elections Results (%) - Other
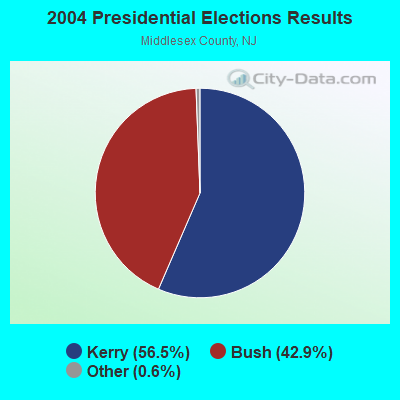
2004 Presidential Elections Results (%) - Democratic Party (Kerry)
2004 Presidential Elections Results (%) - Republican Party (Bush)
2004 Presidential Elections Results (%) - Other
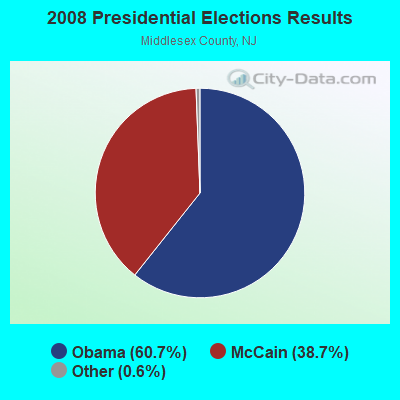
2008 Presidential Elections Results (%) - Democratic Party (Obama)
2008 Presidential Elections Results (%) - Republican Party (McCain)
2008 Presidential Elections Results (%) - Other
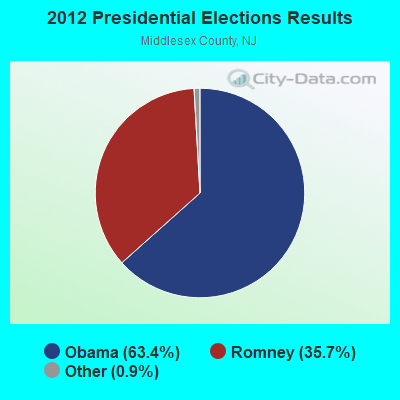
2012 Presidential Elections Results (%) - Democratic Party (Obama)
2012 Presidential Elections Results (%) - Republican Party (Romney)
2012 Presidential Elections Results (%) - Other
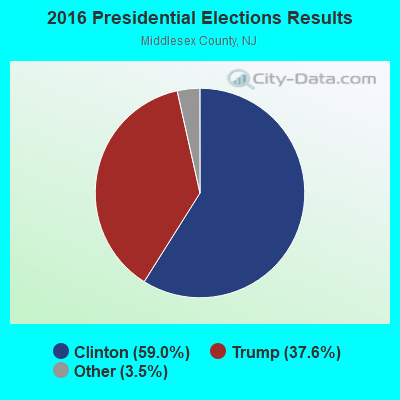
2016 Presidential Elections Results (%) - Democratic Party (Clinton)
2016 Presidential Elections Results (%) - Republican Party (Trump)
2016 Presidential Elections Results (%) - Other
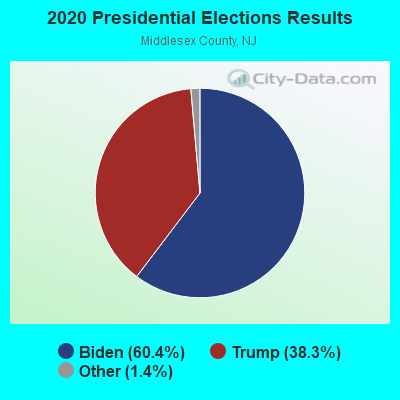
2020 Presidential Elections Results (%) - Democratic Party (Biden)
2020 Presidential Elections Results (%) - Republican Party (Trump)
2020 Presidential Elections Results (%) - Other
Ancestries Reported - Arab (%)
Ancestries Reported - Czech (%)
Ancestries Reported - Danish (%)
Ancestries Reported - Dutch (%)
Ancestries Reported - English (%)
Ancestries Reported - French (%)
Ancestries Reported - French Canadian (%)
Ancestries Reported - German (%)
Ancestries Reported - Greek (%)
Ancestries Reported - Hungarian (%)
Ancestries Reported - Irish (%)
Ancestries Reported - Italian (%)
Ancestries Reported - Lithuanian (%)
Ancestries Reported - Norwegian (%)
Ancestries Reported - Polish (%)
Ancestries Reported - Portuguese (%)
Ancestries Reported - Russian (%)
Ancestries Reported - Scotch-Irish (%)
Ancestries Reported - Scottish (%)
Ancestries Reported - Slovak (%)
Ancestries Reported - Subsaharan African (%)
Ancestries Reported - Swedish (%)
Ancestries Reported - Swiss (%)
Ancestries Reported - Ukrainian (%)
Ancestries Reported - United States (%)
Ancestries Reported - Welsh (%)
Ancestries Reported - West Indian (%)
Ancestries Reported - Other (%)
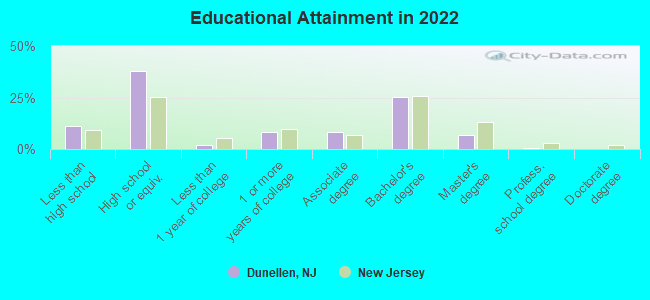
Educational Attainment - No schooling completed (%)
Educational Attainment - Less than high school (%)
Educational Attainment - High school or equivalent (%)
Educational Attainment - Less than 1 year of college (%)
Educational Attainment - 1 or more years of college (%)
Educational Attainment - Associate degree (%)
Educational Attainment - Bachelor's degree (%)
Educational Attainment - Master's degree (%)
Educational Attainment - Professional school degree (%)
Educational Attainment - Doctorate degree (%)
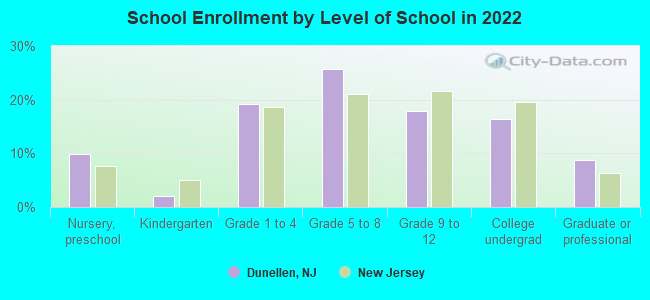
School Enrollment - Nursery, preschool (%)
School Enrollment - Kindergarten (%)
School Enrollment - Grade 1 to 4 (%)
School Enrollment - Grade 5 to 8 (%)
School Enrollment - Grade 9 to 12 (%)
School Enrollment - College undergrad (%)
School Enrollment - Graduate or professional (%)
School Enrollment - Not enrolled in school (%)
School enrollment - Public schools (%)
School enrollment - Private schools (%)
School enrollment - Not enrolled (%)
Median number of rooms in houses and condos
Median number of rooms in apartments
Housing units lacking complete plumbing facilities (%)
Housing units lacking complete kitchen facilities (%)
Density of houses
Urban houses (%)
Rural houses (%)
Households with people 60 years and over (%)
Households with people 65 years and over (%)
Households with people 75 years and over (%)
Households with one or more nonrelatives (%)
Households with no nonrelatives (%)
Population in households (%)
Family households (%)
Nonfamily households (%)
Population in families (%)
Family households with own children (%)
Median number of bedrooms in owner occupied houses
Mean number of bedrooms in owner occupied houses
Median number of bedrooms in renter occupied houses
Mean number of bedrooms in renter occupied houses
Median number of vehichles in owner occupied houses
Mean number of vehichles in owner occupied houses
Median number of vehichles in renter occupied houses
Mean number of vehichles in renter occupied houses
Mortgage status - with mortgage (%)
Mortgage status - with second mortgage (%)
Mortgage status - with home equity loan (%)
Mortgage status - with both second mortgage and home equity loan (%)
Mortgage status - without a mortgage (%)
Average family size
Average family size - White
Average family size - Black or African American
Average family size - Asian
Average family size - Hispanic or Latino
Average family size - American Indian and Alaska Native
Average family size - Multirace
Average family size - Other Race
Geographical mobility - Same house 1 year ago (%)
Geographical mobility - Moved within same county (%)
Geographical mobility - Moved from different county within same state (%)
Geographical mobility - Moved from different state (%)
Geographical mobility - Moved from abroad (%)
Place of birth - Born in state of residence (%)
Place of birth - Born in other state (%)
Place of birth - Native, outside of US (%)
Place of birth - Foreign born (%)
Housing units in structures - 1, detached (%)
Housing units in structures - 1, attached (%)
Housing units in structures - 2 (%)
Housing units in structures - 3 or 4 (%)
Housing units in structures - 5 to 9 (%)
Housing units in structures - 10 to 19 (%)
Housing units in structures - 20 to 49 (%)
Housing units in structures - 50 or more (%)
Housing units in structures - Mobile home (%)
Housing units in structures - Boat, RV, van, etc. (%)
House/condo owner moved in on average (years ago)
Renter moved in on average (years ago)
Year householder moved into unit - Moved in 1999 to March 2000 (%)
Year householder moved into unit - Moved in 1995 to 1998 (%)
Year householder moved into unit - Moved in 1990 to 1994 (%)
Year householder moved into unit - Moved in 1980 to 1989 (%)
Year householder moved into unit - Moved in 1970 to 1979 (%)
Year householder moved into unit - Moved in 1969 or earlier (%)
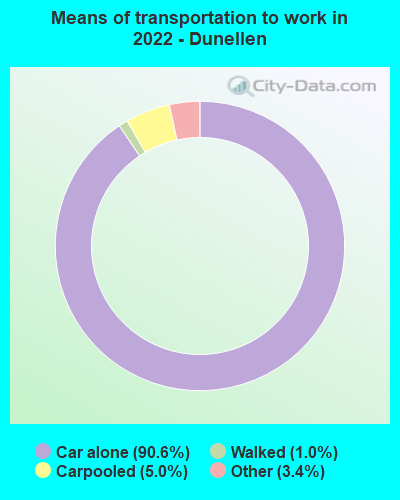
Means of transportation to work - Drove car alone (%)
Means of transportation to work - Carpooled (%)
Means of transportation to work - Public transportation (%)
Means of transportation to work - Bus or trolley bus (%)
Means of transportation to work - Streetcar or trolley car (%)
Means of transportation to work - Subway or elevated (%)
Means of transportation to work - Railroad (%)
Means of transportation to work - Ferryboat (%)
Means of transportation to work - Taxicab (%)
Means of transportation to work - Motorcycle (%)
Means of transportation to work - Bicycle (%)
Means of transportation to work - Walked (%)
Means of transportation to work - Other means (%)
Working at home (%)
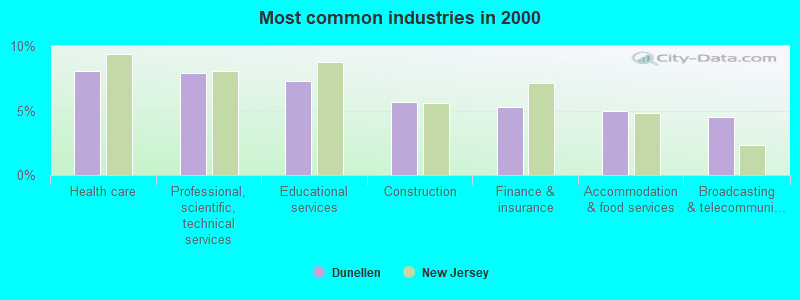
Industry diversity
Most Common Industries - Agriculture, forestry, fishing and hunting, and mining (%)
Most Common Industries - Agriculture, forestry, fishing and hunting (%)
Most Common Industries - Mining, quarrying, and oil and gas extraction (%)
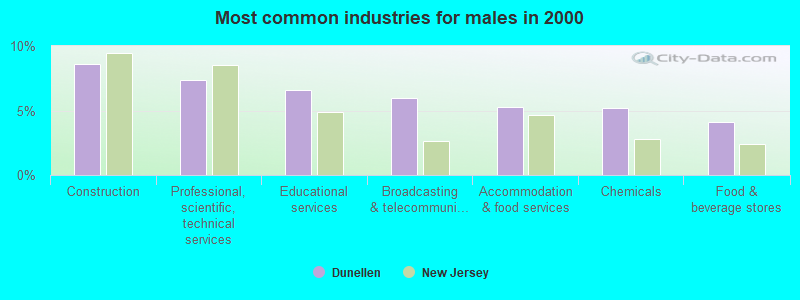
Most Common Industries - Construction (%)
Most Common Industries - Manufacturing (%)
Most Common Industries - Wholesale trade (%)
Most Common Industries - Retail trade (%)
Most Common Industries - Transportation and warehousing, and utilities (%)
Most Common Industries - Transportation and warehousing (%)
Most Common Industries - Utilities (%)
Most Common Industries - Information (%)
Most Common Industries - Finance and insurance, and real estate and rental and leasing (%)
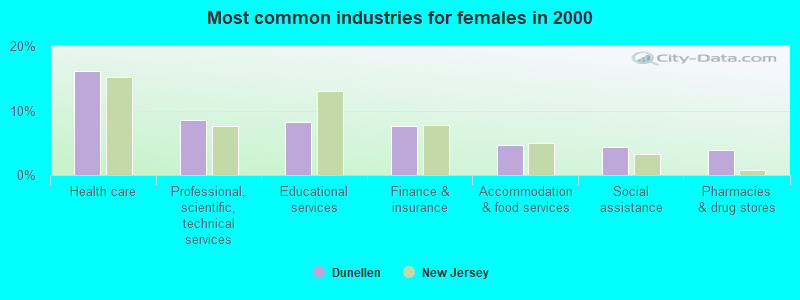
Most Common Industries - Finance and insurance (%)
Most Common Industries - Real estate and rental and leasing (%)
Most Common Industries - Professional, scientific, and management, and administrative and waste management services (%)
Most Common Industries - Professional, scientific, and technical services (%)
Most Common Industries - Management of companies and enterprises (%)
Most Common Industries - Administrative and support and waste management services (%)
Most Common Industries - Educational services, and health care and social assistance (%)
Most Common Industries - Educational services (%)
Most Common Industries - Health care and social assistance (%)
Most Common Industries - Arts, entertainment, and recreation, and accommodation and food services (%)
Most Common Industries - Arts, entertainment, and recreation (%)
Most Common Industries - Accommodation and food services (%)
Most Common Industries - Other services, except public administration (%)
Most Common Industries - Public administration (%)
Occupation diversity
Most Common Occupations - Management, business, science, and arts occupations (%)
Most Common Occupations - Management, business, and financial occupations (%)
Most Common Occupations - Management occupations (%)
Most Common Occupations - Business and financial operations occupations (%)
Most Common Occupations - Computer, engineering, and science occupations (%)
Most Common Occupations - Computer and mathematical occupations (%)
Most Common Occupations - Architecture and engineering occupations (%)
Most Common Occupations - Life, physical, and social science occupations (%)
Most Common Occupations - Education, legal, community service, arts, and media occupations (%)
Most Common Occupations - Community and social service occupations (%)
Most Common Occupations - Legal occupations (%)
Most Common Occupations - Education, training, and library occupations (%)
Most Common Occupations - Arts, design, entertainment, sports, and media occupations (%)
Most Common Occupations - Healthcare practitioners and technical occupations (%)
Most Common Occupations - Health diagnosing and treating practitioners and other technical occupations (%)
Most Common Occupations - Health technologists and technicians (%)
Most Common Occupations - Service occupations (%)
Most Common Occupations - Healthcare support occupations (%)
Most Common Occupations - Protective service occupations (%)
Most Common Occupations - Fire fighting and prevention, and other protective service workers including supervisors (%)
Most Common Occupations - Law enforcement workers including supervisors (%)
Most Common Occupations - Food preparation and serving related occupations (%)
Most Common Occupations - Building and grounds cleaning and maintenance occupations (%)
Most Common Occupations - Personal care and service occupations (%)
Most Common Occupations - Sales and office occupations (%)
Most Common Occupations - Sales and related occupations (%)
Most Common Occupations - Office and administrative support occupations (%)
Most Common Occupations - Natural resources, construction, and maintenance occupations (%)
Most Common Occupations - Farming, fishing, and forestry occupations (%)
Most Common Occupations - Construction and extraction occupations (%)
Most Common Occupations - Installation, maintenance, and repair occupations (%)
Most Common Occupations - Production, transportation, and material moving occupations (%)
Most Common Occupations - Production occupations (%)
Most Common Occupations - Transportation occupations (%)
Most Common Occupations - Material moving occupations (%)
People in Group quarters - Institutionalized population (%)
People in Group quarters - Correctional institutions (%)
People in Group quarters - Federal prisons and detention centers (%)
People in Group quarters - Halfway houses (%)
People in Group quarters - Local jails and other confinement facilities (including police lockups) (%)
People in Group quarters - Military disciplinary barracks (%)
People in Group quarters - State prisons (%)
People in Group quarters - Other types of correctional institutions (%)
People in Group quarters - Nursing homes (%)
People in Group quarters - Hospitals/wards, hospices, and schools for the handicapped (%)
People in Group quarters - Hospitals/wards and hospices for chronically ill (%)
People in Group quarters - Hospices or homes for chronically ill (%)
People in Group quarters - Military hospitals or wards for chronically ill (%)
People in Group quarters - Other hospitals or wards for chronically ill (%)
People in Group quarters - Hospitals or wards for drug/alcohol abuse (%)
People in Group quarters - Mental (Psychiatric) hospitals or wards (%)
People in Group quarters - Schools, hospitals, or wards for the mentally retarded (%)
People in Group quarters - Schools, hospitals, or wards for the physically handicapped (%)
People in Group quarters - Institutions for the deaf (%)
People in Group quarters - Institutions for the blind (%)
People in Group quarters - Orthopedic wards and institutions for the physically handicapped (%)
People in Group quarters - Wards in general hospitals for patients who have no usual home elsewhere (%)
People in Group quarters - Wards in military hospitals for patients who have no usual home elsewhere (%)
People in Group quarters - Juvenile institutions (%)
People in Group quarters - Long-term care (%)
People in Group quarters - Homes for abused, dependent, and neglected children (%)
People in Group quarters - Residential treatment centers for emotionally disturbed children (%)
People in Group quarters - Training schools for juvenile delinquents (%)
People in Group quarters - Short-term care, detention or diagnostic centers for delinquent children (%)
People in Group quarters - Type of juvenile institution unknown (%)
People in Group quarters - Noninstitutionalized population (%)
People in Group quarters - College dormitories (includes college quarters off campus) (%)
People in Group quarters - Military quarters (%)
People in Group quarters - On base (%)
People in Group quarters - Barracks, unaccompanied personnel housing (UPH), (Enlisted/Officer), ;and similar group living quarters for military personnel (%)
People in Group quarters - Transient quarters for temporary residents (%)
People in Group quarters - Military ships (%)
People in Group quarters - Group homes (%)
People in Group quarters - Homes or halfway houses for drug/alcohol abuse (%)
People in Group quarters - Homes for the mentally ill (%)
People in Group quarters - Homes for the mentally retarded (%)
People in Group quarters - Homes for the physically handicapped (%)
People in Group quarters - Other group homes (%)
People in Group quarters - Religious group quarters (%)
People in Group quarters - Dormitories (%)
People in Group quarters - Agriculture workers' dormitories on farms (%)
People in Group quarters - Job Corps and vocational training facilities (%)
People in Group quarters - Other workers' dormitories (%)
People in Group quarters - Crews of maritime vessels (%)
People in Group quarters - Other nonhousehold living situations (%)
People in Group quarters - Other noninstitutional group quarters (%)
Residents speaking English at home (%)
Residents speaking English at home - Born in the United States (%)
Residents speaking English at home - Native, born elsewhere (%)
Residents speaking English at home - Foreign born (%)
Residents speaking Spanish at home (%)
Residents speaking Spanish at home - Born in the United States (%)
Residents speaking Spanish at home - Native, born elsewhere (%)
Residents speaking Spanish at home - Foreign born (%)
Residents speaking other language at home (%)
Residents speaking other language at home - Born in the United States (%)
Residents speaking other language at home - Native, born elsewhere (%)
Residents speaking other language at home - Foreign born (%)
Class of Workers - Employee of private company (%)
Class of Workers - Self-employed in own incorporated business (%)
Class of Workers - Private not-for-profit wage and salary workers (%)
Class of Workers - Local government workers (%)
Class of Workers - State government workers (%)
Class of Workers - Federal government workers (%)
Class of Workers - Self-employed workers in own not incorporated business and Unpaid family workers (%)
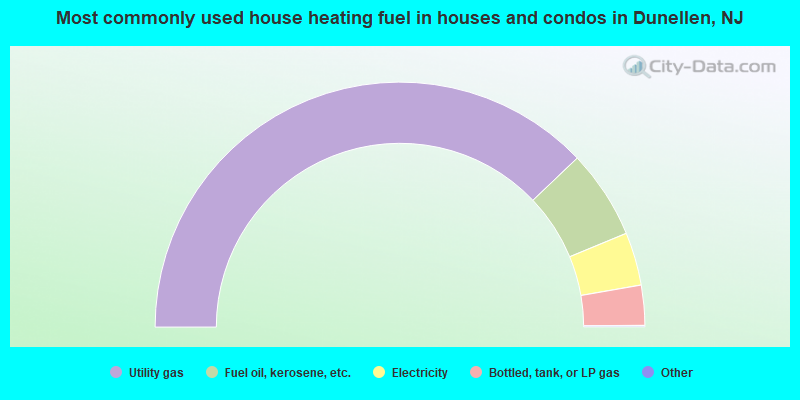
House heating fuel used in houses and condos - Utility gas (%)
House heating fuel used in houses and condos - Bottled, tank, or LP gas (%)
House heating fuel used in houses and condos - Electricity (%)
House heating fuel used in houses and condos - Fuel oil, kerosene, etc. (%)
House heating fuel used in houses and condos - Coal or coke (%)
House heating fuel used in houses and condos - Wood (%)
House heating fuel used in houses and condos - Solar energy (%)
House heating fuel used in houses and condos - Other fuel (%)
House heating fuel used in houses and condos - No fuel used (%)
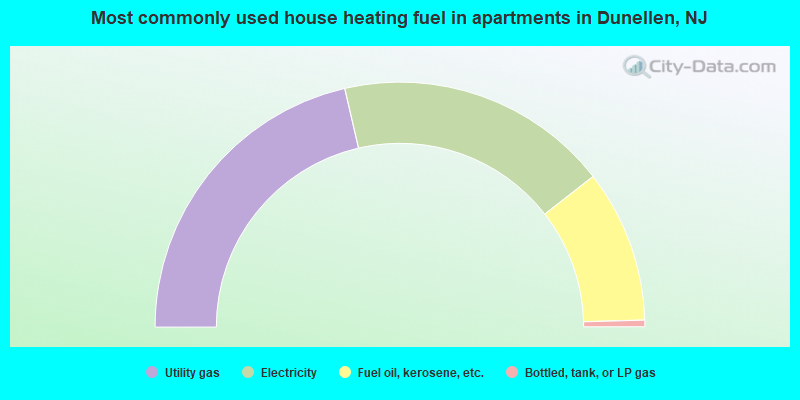
House heating fuel used in apartments - Utility gas (%)
House heating fuel used in apartments - Bottled, tank, or LP gas (%)
House heating fuel used in apartments - Electricity (%)
House heating fuel used in apartments - Fuel oil, kerosene, etc. (%)
House heating fuel used in apartments - Coal or coke (%)
House heating fuel used in apartments - Wood (%)
House heating fuel used in apartments - Solar energy (%)
House heating fuel used in apartments - Other fuel (%)
House heating fuel used in apartments - No fuel used (%)
Armed forces status - In Armed Forces (%)
Armed forces status - Civilian (%)
Armed forces status - Civilian - Veteran (%)
Armed forces status - Civilian - Nonveteran (%)
Fatal accidents locations in years 2005-2021
Fatal accidents locations in 2005
Fatal accidents locations in 2006
Fatal accidents locations in 2007
Fatal accidents locations in 2008
Fatal accidents locations in 2009
Fatal accidents locations in 2010
Fatal accidents locations in 2011
Fatal accidents locations in 2012
Fatal accidents locations in 2013
Fatal accidents locations in 2014
Fatal accidents locations in 2015
Fatal accidents locations in 2016
Fatal accidents locations in 2017
Fatal accidents locations in 2018
Fatal accidents locations in 2019
Fatal accidents locations in 2020
Fatal accidents locations in 2021
Alcohol use - People drinking some alcohol every month (%)
Alcohol use - People not drinking at all (%)
Alcohol use - Average days/month drinking alcohol
Alcohol use - Average drinks/week
Alcohol use - Average days/year people drink much
Audiometry - Average condition of hearing (%)
Audiometry - People that can hear a whisper from across a quiet room (%)
Audiometry - People that can hear normal voice from across a quiet room (%)
Audiometry - Ears ringing, roaring, buzzing (%)
Audiometry - Had a job exposure to loud noise (%)
Audiometry - Had off-work exposure to loud noise (%)
Blood Pressure & Cholesterol - Has high blood pressure (%)
Blood Pressure & Cholesterol - Checking blood pressure at home (%)
Blood Pressure & Cholesterol - Frequently checking blood cholesterol (%)
Blood Pressure & Cholesterol - Has high cholesterol level (%)
Consumer Behavior - Money monthly spent on food at supermarket/grocery store
Consumer Behavior - Money monthly spent on food at other stores
Consumer Behavior - Money monthly spent on eating out
Consumer Behavior - Money monthly spent on carryout/delivered foods
Consumer Behavior - Income spent on food at supermarket/grocery store (%)
Consumer Behavior - Income spent on food at other stores (%)
Consumer Behavior - Income spent on eating out (%)
Consumer Behavior - Income spent on carryout/delivered foods (%)
Current Health Status - General health condition (%)
Current Health Status - Blood donors (%)
Current Health Status - Has blood ever tested for HIV virus (%)
Current Health Status - Left-handed people (%)
Dermatology - People using sunscreen (%)
Diabetes - Diabetics (%)
Diabetes - Had a blood test for high blood sugar (%)
Diabetes - People taking insulin (%)
Diet Behavior & Nutrition - Diet health (%)
Diet Behavior & Nutrition - Milk product consumption (# of products/month)
Diet Behavior & Nutrition - Meals not home prepared (#/week)
Diet Behavior & Nutrition - Meals from fast food or pizza place (#/week)
Diet Behavior & Nutrition - Ready-to-eat foods (#/month)
Diet Behavior & Nutrition - Frozen meals/pizza (#/month)
Drug Use - People that ever used marijuana or hashish (%)
Drug Use - Ever used hard drugs (%)
Drug Use - Ever used any form of cocaine (%)
Drug Use - Ever used heroin (%)
Drug Use - Ever used methamphetamine (%)
Health Insurance - People covered by health insurance (%)
Kidney Conditions-Urology - Avg. # of times urinating at night
Medical Conditions - People with asthma (%)
Medical Conditions - People with anemia (%)
Medical Conditions - People with psoriasis (%)
Medical Conditions - People with overweight (%)
Medical Conditions - Elderly people having difficulties in thinking or remembering (%)
Medical Conditions - People who ever received blood transfusion (%)
Medical Conditions - People having trouble seeing even with glass/contacts (%)
Medical Conditions - People with arthritis (%)
Medical Conditions - People with gout (%)
Medical Conditions - People with congestive heart failure (%)
Medical Conditions - People with coronary heart disease (%)
Medical Conditions - People with angina pectoris (%)
Medical Conditions - People who ever had heart attack (%)
Medical Conditions - People who ever had stroke (%)
Medical Conditions - People with emphysema (%)
Medical Conditions - People with thyroid problem (%)
Medical Conditions - People with chronic bronchitis (%)
Medical Conditions - People with any liver condition (%)
Medical Conditions - People who ever had cancer or malignancy (%)
Mental Health - People who have little interest in doing things (%)
Mental Health - People feeling down, depressed, or hopeless (%)
Mental Health - People who have trouble sleeping or sleeping too much (%)
Mental Health - People feeling tired or having little energy (%)
Mental Health - People with poor appetite or overeating (%)
Mental Health - People feeling bad about themself (%)
Mental Health - People who have trouble concentrating on things (%)
Mental Health - People moving or speaking slowly or too fast (%)
Mental Health - People having thoughts they would be better off dead (%)
Oral Health - Average years since last visit a dentist
Oral Health - People embarrassed because of mouth (%)
Oral Health - People with gum disease (%)
Oral Health - General health of teeth and gums (%)
Oral Health - Average days a week using dental floss/device
Oral Health - Average days a week using mouthwash for dental problem
Oral Health - Average number of teeth
Pesticide Use - Households using pesticides to control insects (%)
Pesticide Use - Households using pesticides to kill weeds (%)
Physical Activity - People doing vigorous-intensity work activities (%)
Physical Activity - People doing moderate-intensity work activities (%)
Physical Activity - People walking or bicycling (%)
Physical Activity - People doing vigorous-intensity recreational activities (%)
Physical Activity - People doing moderate-intensity recreational activities (%)
Physical Activity - Average hours a day doing sedentary activities
Physical Activity - Average hours a day watching TV or videos
Physical Activity - Average hours a day using computer
Physical Functioning - People having limitations keeping them from working (%)
Physical Functioning - People limited in amount of work they can do (%)
Physical Functioning - People that need special equipment to walk (%)
Physical Functioning - People experiencing confusion/memory problems (%)
Physical Functioning - People requiring special healthcare equipment (%)
Prescription Medications - Average number of prescription medicines taking
Preventive Aspirin Use - Adults 40+ taking low-dose aspirin (%)
Reproductive Health - Vaginal deliveries (%)
Reproductive Health - Cesarean deliveries (%)
Reproductive Health - Deliveries resulted in a live birth (%)
Reproductive Health - Pregnancies resulted in a delivery (%)
Reproductive Health - Women breastfeeding newborns (%)
Reproductive Health - Women that had a hysterectomy (%)
Reproductive Health - Women that had both ovaries removed (%)
Reproductive Health - Women that have ever taken birth control pills (%)
Reproductive Health - Women taking birth control pills (%)
Reproductive Health - Women that have ever used Depo-Provera or injectables (%)
Reproductive Health - Women that have ever used female hormones (%)
Sexual Behavior - People 18+ that ever had sex (vaginal, anal, or oral) (%)
Sexual Behavior - Males 18+ that ever had vaginal sex with a woman (%)
Sexual Behavior - Males 18+ that ever performed oral sex on a woman (%)
Sexual Behavior - Males 18+ that ever had anal sex with a woman (%)
Sexual Behavior - Males 18+ that ever had any sex with a man (%)
Sexual Behavior - Females 18+ that ever had vaginal sex with a man (%)
Sexual Behavior - Females 18+ that ever performed oral sex on a man (%)
Sexual Behavior - Females 18+ that ever had anal sex with a man (%)
Sexual Behavior - Females 18+ that ever had any kind of sex with a woman (%)
Sexual Behavior - Average age people first had sex
Sexual Behavior - Average number of female sex partners in lifetime (males 18+)
Sexual Behavior - Average number of female vaginal sex partners in lifetime (males 18+)
Sexual Behavior - Average age people first performed oral sex on a woman (18+)
Sexual Behavior - Average number of woman performed oral sex on in lifetime (18+)
Sexual Behavior - Average number of male sex partners in lifetime (males 18+)
Sexual Behavior - Average number of male anal sex partners in lifetime (males 18+)
Sexual Behavior - Average age people first performed oral sex on a man (18+)
Sexual Behavior - Average number of male oral sex partners in lifetime (18+)
Sexual Behavior - People using protection when performing oral sex (%)
Sexual Behavior - Average number of times people have vaginal or anal sex a year
Sexual Behavior - People having sex without condom (%)
Sexual Behavior - Average number of male sex partners in lifetime (females 18+)
Sexual Behavior - Average number of male vaginal sex partners in lifetime (females 18+)
Sexual Behavior - Average number of female sex partners in lifetime (females 18+)
Sexual Behavior - Circumcised males 18+ (%)
Sleep Disorders - Average hours sleeping at night
Sleep Disorders - People that has trouble sleeping (%)
Smoking-Cigarette Use - People smoking cigarettes (%)
Taste & Smell - People 40+ having problems with smell (%)
Taste & Smell - People 40+ having problems with taste (%)
Taste & Smell - People 40+ that ever had wisdom teeth removed (%)
Taste & Smell - People 40+ that ever had tonsils teeth removed (%)
Taste & Smell - People 40+ that ever had a loss of consciousness because of a head injury (%)
Taste & Smell - People 40+ that ever had a broken nose or other serious injury to face or skull (%)
Taste & Smell - People 40+ that ever had two or more sinus infections (%)
Weight - Average height (inches)
Weight - Average weight (pounds)
Weight - Average BMI
Weight - People that are obese (%)
Weight - People that ever were obese (%)
Weight - People trying to lose weight (%)
Officers per 1,000 residents here:
2.56New Jersey average:
5.53
Latest news from Dunellen, NJ collected exclusively by city-data.com from local newspapers, TV, and radio stations
Ancestries: Italian (8.8%), Egyptian (7.6%), American (4.6%), Jamaican (2.9%), Polish (2.6%).
Current Local Time:
Land area: 1.04 square miles.
Population density: 7,298 people per square mile (high).
2,782 residents are foreign born (26.0% Latin America , 7.8% Asia ).
This borough:
36.6%New Jersey:
23.2%
Median real estate property taxes paid for housing units with mortgages in 2022: $9,632 (2.3%)Median real estate property taxes paid for housing units with no mortgage in 2022: $8,855 (3.2%)
Nearest city with pop. 50,000+: Edison, NJ
Nearest city with pop. 200,000+: Staten Island, NY
Nearest city with pop. 1,000,000+: Brooklyn, NY
Nearest cities:
Latitude: 40.59 N, Longitude: 74.47 W
Daytime population change due to commuting: -2,232 (-29.3%)Workers who live and work in this borough: 264 (7.4%)
Unemployment in December 2023:
Population change in the 1990s: +328 (+5.1%).
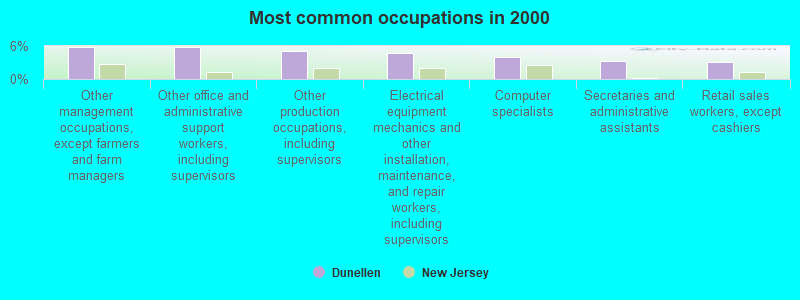
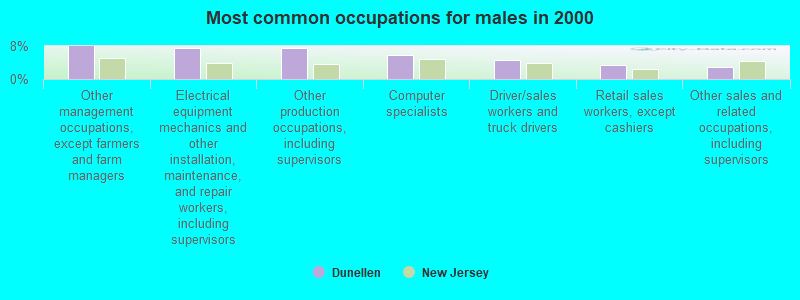
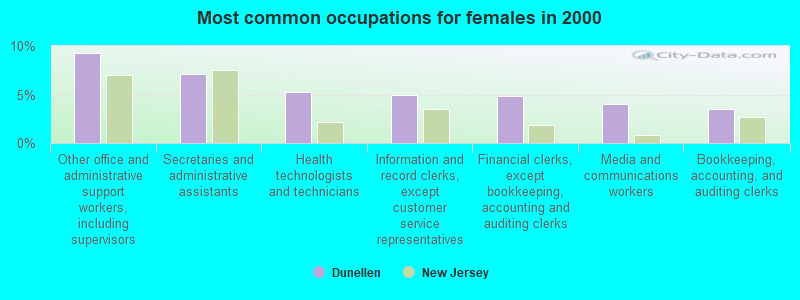
Most common occupations in Dunellen, NJ (%)
Both Males Females
Other management occupations, except farmers and farm managers (5.9%)
Other office and administrative support workers, including supervisors (5.8%)
Other production occupations, including supervisors (5.1%)
Electrical equipment mechanics and other installation, maintenance, and repair workers, including supervisors (4.7%)
Computer specialists (4.0%)
Secretaries and administrative assistants (3.2%)
Retail sales workers, except cashiers (3.0%)
Other management occupations, except farmers and farm managers (8.0%)
Electrical equipment mechanics and other installation, maintenance, and repair workers, including supervisors (7.6%)
Other production occupations, including supervisors (7.5%)
Computer specialists (5.7%)
Driver/sales workers and truck drivers (4.5%)
Retail sales workers, except cashiers (3.5%)
Other sales and related occupations, including supervisors (3.0%)
Other office and administrative support workers, including supervisors (9.3%)
Secretaries and administrative assistants (7.1%)
Health technologists and technicians (5.3%)
Information and record clerks, except customer service representatives (5.0%)
Financial clerks, except bookkeeping, accounting and auditing clerks (4.8%)
Media and communications workers (4.0%)
Bookkeeping, accounting, and auditing clerks (3.5%)
Tornado activity:
Dunellen-area historical tornado activity is near New Jersey state average. It is 28% smaller than the overall U.S. average.
On 5/28/1973, a category F3 (max. wind speeds 158-206 mph) tornado 14.7 miles away from the Dunellen borough center caused between $50,000 and $500,000 in damages.
On 10/18/1990, a category F3 tornado 17.7 miles away from the borough center injured 8 people and caused between $500,000 and $5,000,000 in damages.
Earthquake activity:
Dunellen-area historical earthquake activity is significantly above New Jersey state average. It is 68% smaller than the overall U.S. average. On 8/23/2011 at 17:51:04, a magnitude 5.8 (5.8 MW, Depth: 3.7 mi, Class: Moderate, Intensity: VI - VII) earthquake occurred 262.5 miles away from the city center On 1/16/1994 at 01:49:16, a magnitude 4.6 (4.6 MB, 4.6 LG, Depth: 3.1 mi, Class: Light, Intensity: IV - V) earthquake occurred 84.6 miles away from the city center On 10/7/1983 at 10:18:46, a magnitude 5.3 (5.1 MB, 5.3 LG, 5.1 ML) earthquake occurred 232.7 miles away from Dunellen center On 4/20/2002 at 10:50:47, a magnitude 5.3 (5.3 ML, Depth: 3.0 mi) earthquake occurred 274.1 miles away from the city center On 4/20/2002 at 10:50:47, a magnitude 5.2 (5.2 MB, 4.2 MS, 5.2 MW, 5.0 MW) earthquake occurred 272.2 miles away from the city center On 1/16/1994 at 00:42:43, a magnitude 4.2 (4.2 MB, 4.0 LG, Depth: 3.1 mi) earthquake occurred 83.1 miles away from Dunellen center Magnitude types: regional Lg-wave magnitude (LG), body-wave magnitude (MB), local magnitude (ML), surface-wave magnitude (MS), moment magnitude (MW) Natural disasters: The number of natural disasters in Middlesex County (26) is a lot greater than the US average (15).Major Disasters (Presidential) Declared: 17Emergencies Declared: 9Floods: 7, Hurricanes: 7, Storms: 6, Heavy Rains: 4, Snowstorms: 3, Blizzards: 2, Water Shortages: 2, Winter Storms: 2, Tornado: 1, Wind: 1, Other: 3 (Note: some incidents may be assigned to more than one category). Hospitals and medical centers near Dunellen: GREENBROOK MANOR CARE AND REHABILITATION CENTER (Nursing Home, about 2 miles away; GREEN BROOK, NJ)
FMC SO PLAINFIELD (Dialysis Facility, about 2 miles away; SOUTH PLAINFIELD, NJ)
ODYSSEY HEALTHCARE OF NEW JERSEY (Hospital, about 3 miles away; PISCATAWAY, NJ)
ABBOTT MANOR CONVALESCENT CENTER (Nursing Home, about 3 miles away; PLAINFIELD, NJ)
VILLA MARIA (Nursing Home, about 3 miles away; NORTH PLAINFIELD, NJ)
DVA PLAINFIELD DIALYSIS CENTER (Dialysis Facility, about 4 miles away; PLAINFIELD, NJ)
JFK AT HOME (Home Health Center, about 4 miles away; PLAINFIELD, NJ)
Amtrak stations near Dunellen: 7 miles: NEW BRUNSWICK (FRENCH & ALBANY STS.) Services: ticket office, fully wheelchair accessible, enclosed waiting area, public restrooms, public payphones, snack bar, ATM, free short-term parking, free long-term parking, call for car rental service, taxi stand, public transit connection.
8 miles: METROPARK (ISELIN, 100 MIDDLESEX-ESSEX TPK.) Services: ticket office, fully wheelchair accessible, enclosed waiting area, public restrooms, public payphones, paid short-term parking, call for car rental service, taxi stand, public transit connection.
16 miles: NEWARK INTERNATIONAL AIRPORT (NEWARK, ) Services: ticket office, enclosed waiting area, public restrooms, public payphones.
Colleges/universities with over 2000 students nearest to Dunellen:
Rutgers University-New Brunswick (about 6 miles; New Brunswick, NJ ; Full-time enrollment: 39,388)
Middlesex County College (about 8 miles; Edison, NJ ; FT enrollment: 9,849)
Union County College (about 10 miles; Cranford, NJ ; FT enrollment: 9,148)
Drew University (about 12 miles; Madison, NJ ; FT enrollment: 2,272)
Raritan Valley Community College (about 13 miles; Branchburg, NJ ; FT enrollment: 5,735)
Fairleigh Dickinson University-College at Florham (about 14 miles; Madison, NJ ; FT enrollment: 2,690)
Kean University (about 14 miles; Union, NJ ; FT enrollment: 12,648)
Public high school in Dunellen:
Public elementary/middle schools in Dunellen:
See full list of schools located in Dunellen Library in Dunellen: DUNELLEN FREE PUBLIC LIBRARY Operating income: $306,371; Location: NEW MARKET ROAD; 33,081 books ; 1,251 audio materials ; 1,830 video materials ; 22 state licensed databases ; 100 print serial subscriptions )
Notable locations in Dunellen: (A) , Always Caring Medical Transport (B) , Dunellen First Aid and Rescue Squad (C) , Dunellen Fire Department (D) , Dunellen First Aid and Rescue Squad (E) . Display/hide their locations on the map
Churches in Dunellen include: (A) , Saint Francis Episcopal Church (B) , Saint Johns Catholic Church (C) , Saint Luke's Lutheran Church (D) , Saint Nicholas Catholic Church (E) , Dunellen First Presbyterian Church (F) , Dunellen United Methodist Church (G) , Hope Korean United Methodist Church (H) . Display/hide their locations on the map
Park in Dunellen: (1) . Display/hide its location on the map
Middlesex County has a predicted average indoor radon screening level between 2 and 4 pCi/L (pico curies per liter) - Moderate Potential Drinking water stations with addresses in Dunellen and their reported violations in the past:
STEWARTS ROOT BEER (Population served: 129, Groundwater):
Past health violations:
MCL, Monthly (TCR) - In JUL-2013, Contaminant: Coliform. Follow-up actions: St Public Notif requested (JUL-29-2013), St Formal NOV issued (JUL-29-2013), St Compliance achieved (AUG-23-2013)
MCL, Acute (TCR) - In OCT-2012, Contaminant: Coliform. Follow-up actions: St Public Notif requested (NOV-02-2012), St Formal NOV issued (NOV-02-2012), St Compliance achieved (MAR-11-2013)
MCL, Monthly (TCR) - In JUL-2012, Contaminant: Coliform. Follow-up actions: St Public Notif requested (AUG-02-2012), St Formal NOV issued (AUG-02-2012), St Compliance achieved (AUG-20-2012), St Public Notif received (AUG-24-2012)
MCL, Monthly (TCR) - In JUN-2012, Contaminant: Coliform. Follow-up actions: St Public Notif requested (JUN-27-2012), St Formal NOV issued (JUN-27-2012), St Compliance achieved (AUG-20-2012), St Public Notif received (AUG-24-2012)
MCL, Monthly (TCR) - In MAY-2012, Contaminant: Coliform. Follow-up actions: St Public Notif requested (MAY-25-2012), St Formal NOV issued (MAY-25-2012), St Compliance achieved (AUG-20-2012), St Public Notif received (AUG-24-2012)
MCL, Monthly (TCR) - In JUN-2011, Contaminant: Coliform. Follow-up actions: St Public Notif requested (JUN-27-2011), St Formal NOV issued (JUN-27-2011), St Public Notif received (JUL-18-2011), St Compliance achieved (JUL-26-2011)
MCL, Monthly (TCR) - In MAY-2011, Contaminant: Coliform. Follow-up actions: St Public Notif requested (MAY-23-2011), St Formal NOV issued (MAY-23-2011), St Public Notif received (JUL-18-2011), St Compliance achieved (JUL-26-2011)
Past monitoring violations:
Monitoring, Source Water (GWR) - Between NOV-03-2012 and NOV-30-2012, Contaminant: E. COLI. Follow-up actions: St Public Notif requested (DEC-04-2012), St Formal NOV issued (DEC-04-2012), St Compliance achieved (MAY-24-2013)
Monitoring, Repeat Major (TCR) - In OCT-2012, Contaminant: Coliform (TCR). Follow-up actions: St Public Notif requested (NOV-02-2012), St Formal NOV issued (NOV-02-2012), St Compliance achieved (MAR-11-2013)
One routine major monitoring violation
2 regular monitoring violations
Average household size: This borough:
2.8 peopleNew Jersey:
2.7 people
Percentage of family households: This borough:
68.7%Whole state:
69.3%
Percentage of households with unmarried partners: This borough:
7.2%Whole state:
5.9%
Likely homosexual households (counted as self-reported same-sex unmarried-partner households)
Lesbian couples: 0.5% of all households Gay men: 0.3% of all households
10 people in emergency and transitional shelters (with sleeping facilities) for people experiencing homelessness in 2010People in group quarters in Dunellen in 2000:
31 people in other group homes
23 people in other nonhousehold living situations
17 people in other noninstitutional group quarters
11 people in homes or halfway houses for drug/alcohol abuse
5 people in homes for the mentally retarded
Banks with branches in Dunellen (2011 data):
Investors Bank: 205 N Washington Ave Branch at 205 N Washington Ave, branch established on 1909/01/01. Info updated 2012/02/27: Bank assets: $10,674.9 mil, Deposits: $7,419.7 mil, headquarters in Short Hills, NJ, positive income , Commercial Lending Specialization, 86 total offices , Holding Company: Investors Bancorp, Mhc
Bank of America, National Association: Dunellen Branch at 405 North Avenue, branch established on 1887/01/01. Info updated 2009/11/18: Bank assets: $1,451,969.3 mil, Deposits: $1,077,176.8 mil, headquarters in Charlotte, NC, positive income , 5782 total offices , Holding Company: Bank Of America Corporation
The Provident Bank: Dunellen Branch at 333 North Avenue, branch established on 1907/02/24. Info updated 2010/07/27: Bank assets: $7,097.5 mil, Deposits: $5,186.9 mil, headquarters in Jersey City, NJ, positive income , Commercial Lending Specialization, 83 total offices , Holding Company: Provident Financial Services, Inc.
Crown Bank: Dunellen Branch at 324 North Avenue, branch established on 2008/11/17. Info updated 2011/12/21: Bank assets: $566.3 mil, Deposits: $472.6 mil, headquarters in Elizabeth, NJ, positive income , Commercial Lending Specialization, 16 total offices , Holding Company: Jjr Holding Company, Inc.
For population 15 years and over in Dunellen:
Never married: 40.9%Now married: 44.7%Separated: 1.1%Widowed: 4.9%Divorced: 8.4% For population 25 years and over in Dunellen:
High school or higher: 89.6%Bachelor's degree or higher: 32.8%Graduate or professional degree: 7.0%Unemployed: 7.8%Mean travel time to work (commute): 25.1 minutes
Education Gini index (Inequality in education) Here:
11.8New Jersey average:
12.8
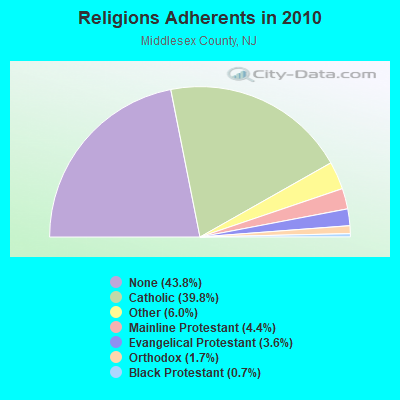
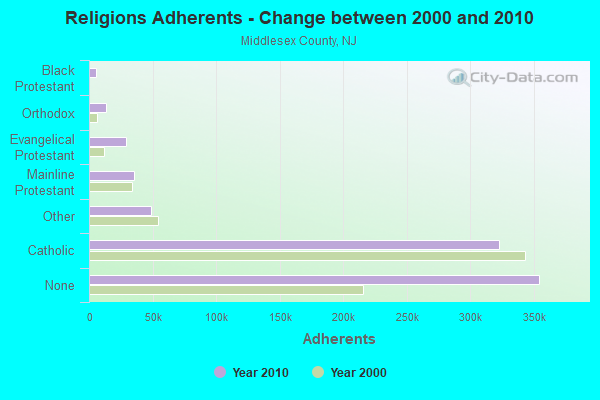
Religion statistics for Dunellen, NJ (based on Middlesex County data)
Religion Adherents Congregations Catholic 322,340 74 Other 48,717 73 Mainline Protestant 35,693 113 Evangelical Protestant 29,296 130 Orthodox 13,491 14 Black Protestant 5,879 17 None 354,442 -
Source: Clifford Grammich, Kirk Hadaway, Richard Houseal, Dale E.Jones, Alexei Krindatch, Richie Stanley and Richard H.Taylor. 2012. 2010 U.S.Religion Census: Religious Congregations & Membership Study. Association of Statisticians of American Religious Bodies. Jones, Dale E., et al. 2002. Congregations and Membership in the United States 2000. Nashville, TN: Glenmary Research Center. Graphs represent county-level data
Food Environment Statistics: Number of grocery stores : 221Here :
2.82 / 10,000 pop.New Jersey :
2.90 / 10,000 pop.
Number of supercenters and club stores : 4This county :
0.05 / 10,000 pop.New Jersey :
0.06 / 10,000 pop.
Number of convenience stores (no gas) : 172Middlesex County :
2.20 / 10,000 pop.State :
1.76 / 10,000 pop.
Number of convenience stores (with gas) : 69Middlesex County :
0.88 / 10,000 pop.New Jersey :
0.81 / 10,000 pop.
Number of full-service restaurants : 477This county :
6.09 / 10,000 pop.New Jersey :
7.15 / 10,000 pop.
Adult diabetes rate : This county :
7.6%New Jersey :
8.3%
Adult obesity rate : This county :
23.8%State :
23.3%
Low-income preschool obesity rate : Middlesex County :
18.2%New Jersey :
18.0%
Health and Nutrition: Healthy diet rate : This city:
50.3%New Jersey:
50.6%
Average overall health of teeth and gums : This city:
48.5%New Jersey:
48.5%
Average BMI : Dunellen:
28.6New Jersey:
28.5
People feeling badly about themselves : Dunellen:
20.3%State:
20.0%
People not drinking alcohol at all : This city:
10.5%New Jersey:
11.1%
Average hours sleeping at night : Overweight people : Dunellen:
33.5%New Jersey:
33.6%
General health condition : Average condition of hearing : Dunellen:
79.9%State:
80.0%
More about Health and Nutrition of Dunellen, NJ Residents
Local government employment and payroll (March 2022)
Function
Full-time employees
Monthly full-time payroll
Average yearly full-time wage
Part-time employees
Monthly part-time payroll
Police Protection - Officers
15 $141,893 $113,514 0 $0 Streets and Highways
7 $57,695 $98,906 3 $5,630 Police - Other
4 $14,557 $43,671 0 $0 Financial Administration
2 $9,423 $56,538 3 $4,917 Other Government Administration
2 $13,223 $79,338 11 $3,839 Local Libraries
2 $9,673 $58,038 13 $12,269 Other and Unallocable
2 $8,228 $49,368 2 $3,879 Judicial and Legal
2 $7,450 $44,700 4 $7,720 Parks and Recreation
1 $4,585 $55,020 0 $0 Sewerage
0 $0 1 $4,472 Fire - Other
0 $0 4 $1,661
Totals for Government
37 $266,727 $86,506 41 $44,387
Dunellen government finances - Expenditure in 2017 (per resident):
Construction - General - Other: $386,000 ($50.96)
Regular Highways: $278,000 ($36.70)Sewerage: $99,000 ($13.07)Solid Waste Management: $66,000 ($8.71)Current Operations - General - Other: $2,506,000 ($330.83)
Police Protection: $1,865,000 ($246.20)Regular Highways: $599,000 ($79.08)Libraries: $246,000 ($32.48)Parking Facilities: $246,000 ($32.48)Judicial and Legal Services: $225,000 ($29.70)Financial Administration: $185,000 ($24.42)Central Staff Services: $145,000 ($19.14)Local Fire Protection: $107,000 ($14.13)Protective Inspection and Regulation - Other: $92,000 ($12.15)General Public Buildings: $83,000 ($10.96)Health - Other: $81,000 ($10.69)Solid Waste Management: $79,000 ($10.43)Housing and Community Development: $46,000 ($6.07)Sewerage: $37,000 ($4.88)General - Interest on Debt: $49,000 ($6.47)
Intergovernmental to Local - Other - Sewerage: $399,000 ($52.67)
Other - General - Other: $104,000 ($13.73)Other - Solid Waste Management: $70,000 ($9.24)Other Capital Outlay - General - Other: $179,000 ($23.63)
Local Fire Protection: $48,000 ($6.34)Total Salaries and Wages: $2,730,000 ($360.40)
Dunellen government finances - Revenue in 2017 (per resident):
Charges - Parking Facilities: $253,000 ($33.40)
Federal Intergovernmental - Housing and Community Development: $40,000 ($5.28)
Miscellaneous - General Revenue - Other: $258,000 ($34.06)
Fines and Forfeits: $219,000 ($28.91)Interest Earnings: $9,000 ($1.19)State Intergovernmental - General Local Government Support: $582,000 ($76.83)
Other: $40,000 ($5.28)Health and Hospitals: $16,000 ($2.11)Tax - Property: $6,179,000 ($815.71)
Other License: $140,000 ($18.48)Public Utilities Sales: $24,000 ($3.17)Alcoholic Beverage License: $9,000 ($1.19)
Dunellen government finances - Debt in 2017 (per resident):
Long Term Debt - Beginning Outstanding - Unspecified Public Purpose: $1,067,000 ($140.86)
Outstanding Unspecified Public Purpose: $979,000 ($129.24)Retired Unspecified Public Purpose: $88,000 ($11.62)
Dunellen government finances - Cash and Securities in 2017 (per resident):
Other Funds - Cash and Securities: $914,000 ($120.66)
6.75% of this county's 2021 resident taxpayers lived in other counties in 2020 ($80,605 average adjusted gross income )
Here:
6.75%New Jersey average:
6.70%
0.01% of residents moved from foreign countries ($55 average AGI )Middlesex County:
0.01%New Jersey average:
0.01%
Top counties from which taxpayers relocated into this county between 2020 and 2021:
7.27% of this county's 2020 resident taxpayers moved to other counties in 2021 ($94,247 average adjusted gross income )
Here:
7.27%New Jersey average:
7.02%
0.02% of residents moved to foreign countries ($103 average AGI )Middlesex County:
0.02%New Jersey average:
0.02%
Top counties to which taxpayers relocated from this county between 2020 and 2021:
Businesses in Dunellen, NJ
Name Count Name Count
Advance Auto Parts 1 UPS 2 Sprint Nextel 1 World Gym 1
Strongest AM radio stations in Dunellen:
WMCA (570 AM; 50 kW; NEW YORK, NY; Owner: SALEM MEDIA OF NEW YORK, LLC)
WOR (710 AM; 50 kW; NEW YORK, NY; Owner: BUCKLEY BROADCASTING CORPORATION)
WINS (1010 AM; 50 kW; NEW YORK, NY; Owner: INFINITY BROADCASTING OPERATIONS, INC.)
WABC (770 AM; 50 kW; NEW YORK, NY; Owner: WABC-AM RADIO, INC.)
WEPN (1050 AM; 50 kW; NEW YORK, NY; Owner: NEW YORK AM RADIO, LLC)
WBBR (1130 AM; 50 kW; NEW YORK, NY; Owner: BLOOMBERG COMMUNICATIONS INC.)
WADO (1280 AM; 50 kW; NEW YORK, NY; Owner: WADO-AM LICENSE CORP.)
WSNR (620 AM; 20 kW; JERSEY CITY, NJ)
WLIB (1190 AM; 30 kW; NEW YORK, NY; Owner: ICBC BROADCAST HOLDINGS-NY, INC.)
WFAN (660 AM; 50 kW; NEW YORK, NY; Owner: INFINITY BROADCASTING OPERATIONS, INC.)
WJDM (1530 AM; 10 kW; ELIZABETH, NJ; Owner: RADIO UNICA OF NEW YORK LICENSE CORP)
WWJZ (640 AM; 50 kW; MOUNT HOLLY, NJ; Owner: ABC, INC.)
WQEW (1560 AM; 50 kW; NEW YORK, NY; Owner: THE NEW YORK TIMES ELECTRONIC MEDIA COMPANY)
Strongest FM radio stations in Dunellen:
WAWZ (99.1 FM; ZAREPHATH, NJ; Owner: PILLAR OF FIRE)
WMGQ (98.3 FM; NEW BRUNSWICK, NJ; Owner: THE SENTINEL PUBLISHING CO.)
WRKS (98.7 FM; NEW YORK, NY; Owner: EMMIS RADIO LICENSE CORP OF NEW YORK)
WNEW (102.7 FM; NEW YORK, NY; Owner: INFINITY BROADCASTING OPERATIONS, INC.)
WNYC-FM (93.9 FM; NEW YORK, NY; Owner: WNYC RADIO)
WPAT-FM (93.1 FM; PATERSON, NJ; Owner: WPAT LICENSING, INC.)
WQCD (101.9 FM; NEW YORK, NY; Owner: EMMIS RADIO LICENSE CORPORATION)
WKTU (103.5 FM; LAKE SUCCESS, NY; Owner: AMFM RADIO LICENSES, LLC)
WCAA (105.9 FM; NEWARK, NJ; Owner: WADO-AM LICENSE CORP. ("WADO"))
WBAI (99.5 FM; NEW YORK, NY; Owner: PACIFICA FOUNDATION, INC.)
WBLS (107.5 FM; NEW YORK, NY; Owner: ICBC BROADCAST HOLDINGS-NY, INC.)
WLTW (106.7 FM; NEW YORK, NY; Owner: AMFM NEW YORK LICENSES, LLC)
WQXR-FM (96.3 FM; NEW YORK, NY; Owner: THE NEW YORK TIMES ELECTRONIC MEDIA COMPANY)
WSKQ-FM (97.9 FM; NEW YORK, NY; Owner: WSKQ LICENSING, INC.)
WXRK (92.3 FM; NEW YORK, NY; Owner: INFINITY BROADCASTING OPERATIONS, INC.)
WAXQ (104.3 FM; NEW YORK, NY; Owner: AMFM NEW YORK LICENSES, LLC)
WHTZ (100.3 FM; NEWARK, NJ; Owner: AMFM RADIO LICENSES, L.L.C.)
WWPR-FM (105.1 FM; NEW YORK, NY; Owner: AMFM RADIO LICENSES, L.L.C.)
WQHT (97.1 FM; NEW YORK, NY; Owner: EMMIS LICENSE CORPORATION OF NEW YORK)
WCBS-FM (101.1 FM; NEW YORK, NY; Owner: INFINITY BROADCASTING OPERATIONS, INC.)
TV broadcast stations around Dunellen:
WNJB (Channel 58; NEW BRUNSWICK, NJ; Owner: NEW JERSEY PUBLIC BROADCASTING AUTHORITY)
WLBX-LP (Channel 22; CRANFORD, NJ; Owner: RENARD COMMUNICATIONS CORP.)
WCBS-TV (Channel 2; NEW YORK, NY; Owner: CBS BROADCASTING INC.)
WNYW (Channel 5; NEW YORK, NY; Owner: FOX TELEVISION STATIONS, INC.)
WABC-TV (Channel 7; NEW YORK, NY; Owner: AMERICAN BROADCASTING COMPANIES, INC)
WPIX (Channel 11; NEW YORK, NY; Owner: WPIX, INC.)
WWOR-TV (Channel 9; SECAUCUS, NJ; Owner: FOX TELEVISION STATIONS, INC.)
W36AS (Channel 36; NEW BRUNSWICK, NJ; Owner: DEEPAK VISWANATH)
WPXO-LP (Channel 34; EAST ORANGE, NJ; Owner: PAXSON COMMUNICATIONS LPTV, INC.)
WPXN-TV (Channel 31; NEW YORK, NY; Owner: PAXSON COMMUNICATIONS LICENSE COMPANY, LLC)
WNBC (Channel 4; NEW YORK, NY; Owner: NATIONAL BROADCASTING COMPANY, INC.)
WNET (Channel 13; NEWARK, NJ; Owner: EDUCATIONAL BROADCASTING CORPORATION)
WXTV (Channel 41; PATERSON, NJ; Owner: WXTV LICENSE PARTNERSHIP, G.P.)
WNJU (Channel 47; LINDEN, NJ; Owner: WNJU LICENSE CORPORATION)
WFUT (Channel 68; NEWARK, NJ; Owner: UNIVISION NEW YORK LLC)
WNYE-TV (Channel 25; NEW YORK, NY; Owner: NEW YORK CITY BOARD OF EDUCATION)
WXNY-LP (Channel 32; NEW YORK, NY; Owner: ISLAND BROADCASTING COMPANY)
WKOB-LP (Channel 53; NEW YORK, NY; Owner: WKOB COMMUNICATIONS, INC.)
WEBR-CA (Channel 17; MANHATTAN, NY; Owner: K LICENSEE INC.)
WRNN-LP (Channel 57; NYACK, NY; Owner: LP NYACK LIMITED PARTNERSHIP)
WNJT (Channel 52; TRENTON, NJ; Owner: NEW JERSEY PUBLIC BROADCASTING AUTHORITY)
W54CZ (Channel 54; MORRISTOWN, NJ; Owner: WLNY-TV, INC.)
W60AI (Channel 60; NEW YORK, NY; Owner: VENTANA TELEVISION, INC.)
WNJN (Channel 50; MONTCLAIR, NJ; Owner: NEW JERSEY PUBLIC B/CNG AUTHORITY)
WNXY-LP (Channel 26; NEW YORK, NY; Owner: ISLAND BROADCASTING COMPANY)
National Bridge Inventory (NBI) Statistics 10 Number of bridges82ft / 25.2m Total length $2,989,000 Total costs121,153 Total average daily traffic4,175 Total average daily truck traffic149,704 Total future (year 2039) average daily traffic
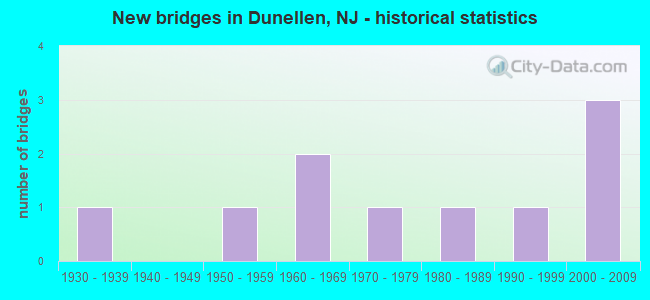
New bridges - historical statistics
1 1930-1939 1 1950-1959 2 1960-1969 1 1970-1979 1 1980-1989 1 1990-1999 3 2000-2009
See full National Bridge Inventory statistics for Dunellen, NJ
FCC Registered Broadcast Land Mobile Towers: 3
Police Hdqtrs 355 N Ave (Lat: 40.589000 Lon: -74.464611), Call Sign: WRW21, Assigned Frequencies: 458.475 MHz, Grant Date: 02/08/2023, Expiration Date: 05/04/2033, Registrant: Tactical Public Safety, 1036 Industrial Drive, West Berlin, NJ 08091, Phone: (856) 768-3336, Fax: (856) 768-3666, Email:
Lat: 40.582639 Lon: -74.466472, Call Sign: WQDK270, Assigned Frequencies: 72.1400 MHz, Grant Date: 09/15/2015, Expiration Date: 09/15/2025, Certifier: Vincent Olivo, Registrant: Primex Wireless, 965 Wells St., Lake Geneva, WI 53147, Phone: (800) 537-0464400 High St (Lat: 40.582222 Lon: -74.468056), Call Sign: WRUX354, Licensee ID: L02605461, Assigned Frequencies: 462.287 MHz, 462.387 MHz, 462.437 MHz, 462.462 MHz, 462.237 MHz, Grant Date: 10/14/2022, Expiration Date: 10/14/2032, Certifier: Ronnie Haynes, Registrant: Dunellen Board Of Education, 400 High Street, Dunellen, NJ 08812, Phone: (732) 400-5900, Email:
FCC Registered Amateur Radio Licenses: 27 (
See the full list of FCC Registered Amateur Radio Licenses in Dunellen )
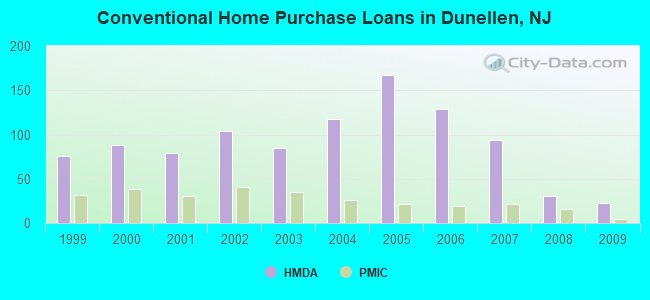
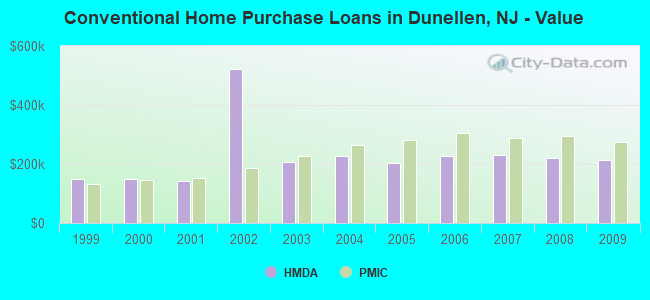
Home Mortgage Disclosure Act Aggregated Statistics For Year 2009(Based on 1 full tract) A) FHA, FSA/RHS & VA B) Conventional C) Refinancings D) Home Improvement Loans F) Non-occupant Loans on Number Average Value Number Average Value Number Average Value Number Average Value Number Average Value
LOANS ORIGINATED 38 $249,658 23 $214,478 130 $219,315 10 $120,200 3 $132,667 APPLICATIONS APPROVED, NOT ACCEPTED 6 $201,500 4 $186,750 9 $283,111 1 $8,000 0 $0 APPLICATIONS DENIED 4 $226,500 6 $241,000 60 $229,117 7 $117,143 2 $178,000 APPLICATIONS WITHDRAWN 11 $234,455 4 $159,000 36 $231,444 2 $27,500 1 $100,000 FILES CLOSED FOR INCOMPLETENESS 3 $244,333 2 $351,000 9 $235,222 1 $13,000 0 $0
Aggregated Statistics For Year 2008(Based on 1 full tract) A) FHA, FSA/RHS & VA B) Conventional C) Refinancings D) Home Improvement Loans E) Loans on Dwellings For 5+ Families F) Non-occupant Loans on Number Average Value Number Average Value Number Average Value Number Average Value Number Average Value Number Average Value
LOANS ORIGINATED 21 $288,048 31 $221,581 94 $210,032 13 $68,846 5 $710,600 7 $190,857 APPLICATIONS APPROVED, NOT ACCEPTED 3 $282,667 12 $243,583 18 $257,778 6 $22,000 0 $0 3 $229,667 APPLICATIONS DENIED 1 $271,000 5 $255,000 61 $260,803 16 $93,625 0 $0 4 $162,000 APPLICATIONS WITHDRAWN 4 $265,250 3 $225,667 32 $261,344 2 $162,500 1 $401,000 1 $183,000 FILES CLOSED FOR INCOMPLETENESS 1 $194,000 2 $252,500 3 $245,000 1 $41,000 0 $0 0 $0
Aggregated Statistics For Year 2007(Based on 1 full tract) A) FHA, FSA/RHS & VA B) Conventional C) Refinancings D) Home Improvement Loans E) Loans on Dwellings For 5+ Families F) Non-occupant Loans on Number Average Value Number Average Value Number Average Value Number Average Value Number Average Value Number Average Value
LOANS ORIGINATED 1 $314,000 94 $230,979 150 $217,967 38 $75,132 2 $595,000 19 $240,053 APPLICATIONS APPROVED, NOT ACCEPTED 1 $362,000 14 $258,571 34 $196,765 3 $32,667 0 $0 13 $217,538 APPLICATIONS DENIED 0 $0 20 $242,600 84 $246,369 28 $72,500 0 $0 16 $246,250 APPLICATIONS WITHDRAWN 2 $264,500 8 $268,250 42 $228,286 3 $138,333 1 $420,000 4 $264,000 FILES CLOSED FOR INCOMPLETENESS 0 $0 2 $248,000 15 $298,267 0 $0 0 $0 5 $276,400
Aggregated Statistics For Year 2006(Based on 1 full tract) A) FHA, FSA/RHS & VA B) Conventional C) Refinancings D) Home Improvement Loans E) Loans on Dwellings For 5+ Families F) Non-occupant Loans on G) Loans On Manufactured Number Average Value Number Average Value Number Average Value Number Average Value Number Average Value Number Average Value Number Average Value
LOANS ORIGINATED 5 $298,600 129 $227,442 198 $217,116 39 $123,128 1 $270,000 22 $273,955 0 $0 APPLICATIONS APPROVED, NOT ACCEPTED 0 $0 22 $212,318 34 $187,912 8 $63,625 0 $0 3 $214,000 0 $0 APPLICATIONS DENIED 1 $276,000 37 $226,486 100 $226,640 33 $72,000 0 $0 15 $227,600 1 $220,000 APPLICATIONS WITHDRAWN 0 $0 22 $253,545 70 $201,571 7 $136,857 0 $0 5 $183,000 0 $0 FILES CLOSED FOR INCOMPLETENESS 1 $345,000 2 $236,000 20 $255,450 0 $0 0 $0 2 $235,000 0 $0
Aggregated Statistics For Year 2005(Based on 1 full tract) A) FHA, FSA/RHS & VA B) Conventional C) Refinancings D) Home Improvement Loans E) Loans on Dwellings For 5+ Families F) Non-occupant Loans on G) Loans On Manufactured Number Average Value Number Average Value Number Average Value Number Average Value Number Average Value Number Average Value Number Average Value
LOANS ORIGINATED 8 $273,500 167 $203,210 274 $203,328 37 $93,730 3 $475,000 27 $223,333 0 $0 APPLICATIONS APPROVED, NOT ACCEPTED 0 $0 15 $205,267 41 $232,854 7 $61,571 1 $270,000 4 $241,500 0 $0 APPLICATIONS DENIED 2 $327,000 42 $199,833 86 $208,616 33 $90,091 2 $387,500 12 $177,333 1 $250,000 APPLICATIONS WITHDRAWN 3 $162,000 26 $224,923 67 $206,940 16 $203,188 0 $0 4 $318,250 0 $0 FILES CLOSED FOR INCOMPLETENESS 0 $0 14 $187,357 29 $246,207 3 $68,333 0 $0 4 $214,500 0 $0
Aggregated Statistics For Year 2004(Based on 1 full tract) A) FHA, FSA/RHS & VA B) Conventional C) Refinancings D) Home Improvement Loans E) Loans on Dwellings For 5+ Families F) Non-occupant Loans on Number Average Value Number Average Value Number Average Value Number Average Value Number Average Value Number Average Value
LOANS ORIGINATED 7 $255,714 117 $227,162 214 $178,916 32 $80,250 1 $650,000 26 $194,500 APPLICATIONS APPROVED, NOT ACCEPTED 1 $281,000 22 $221,182 42 $165,452 11 $78,182 0 $0 3 $216,667 APPLICATIONS DENIED 1 $240,000 26 $226,154 77 $183,545 31 $49,613 0 $0 8 $163,375 APPLICATIONS WITHDRAWN 0 $0 18 $245,722 48 $171,812 7 $58,714 0 $0 2 $207,500 FILES CLOSED FOR INCOMPLETENESS 0 $0 3 $117,667 10 $184,000 2 $39,000 0 $0 1 $200,000
Aggregated Statistics For Year 2003(Based on 1 full tract) A) FHA, FSA/RHS & VA B) Conventional C) Refinancings D) Home Improvement Loans F) Non-occupant Loans on Number Average Value Number Average Value Number Average Value Number Average Value Number Average Value
LOANS ORIGINATED 20 $232,100 85 $207,682 452 $150,821 33 $41,121 34 $172,265 APPLICATIONS APPROVED, NOT ACCEPTED 2 $208,500 7 $184,000 72 $150,139 9 $56,778 5 $174,800 APPLICATIONS DENIED 3 $207,000 12 $185,417 120 $157,525 21 $69,762 14 $181,929 APPLICATIONS WITHDRAWN 5 $215,800 11 $220,636 105 $160,371 4 $31,250 2 $73,500 FILES CLOSED FOR INCOMPLETENESS 0 $0 3 $273,333 19 $169,421 3 $36,667 2 $172,500
Aggregated Statistics For Year 2002(Based on 1 full tract) A) FHA, FSA/RHS & VA B) Conventional C) Refinancings D) Home Improvement Loans E) Loans on Dwellings For 5+ Families F) Non-occupant Loans on Number Average Value Number Average Value Number Average Value Number Average Value Number Average Value Number Average Value
LOANS ORIGINATED 12 $183,083 104 $523,606 244 $220,152 37 $42,378 1 $500,000 17 $142,235 APPLICATIONS APPROVED, NOT ACCEPTED 0 $0 14 $210,071 39 $131,641 19 $26,105 0 $0 5 $170,800 APPLICATIONS DENIED 1 $169,000 8 $154,875 97 $124,876 41 $28,805 0 $0 4 $94,250 APPLICATIONS WITHDRAWN 1 $138,000 7 $176,286 55 $144,291 12 $33,083 1 $500,000 3 $130,333 FILES CLOSED FOR INCOMPLETENESS 1 $180,000 1 $167,000 11 $132,091 2 $20,500 0 $0 1 $104,000
Aggregated Statistics For Year 2001(Based on 1 full tract) A) FHA, FSA/RHS & VA B) Conventional C) Refinancings D) Home Improvement Loans E) Loans on Dwellings For 5+ Families F) Non-occupant Loans on Number Average Value Number Average Value Number Average Value Number Average Value Number Average Value Number Average Value
LOANS ORIGINATED 19 $167,421 79 $142,329 153 $133,431 19 $28,526 0 $0 5 $167,200 APPLICATIONS APPROVED, NOT ACCEPTED 5 $159,800 11 $119,636 38 $119,816 14 $28,786 1 $119,000 3 $151,333 APPLICATIONS DENIED 2 $150,000 12 $170,417 67 $91,149 28 $23,536 0 $0 3 $106,333 APPLICATIONS WITHDRAWN 3 $160,667 5 $173,200 47 $112,787 11 $34,818 0 $0 2 $107,500 FILES CLOSED FOR INCOMPLETENESS 0 $0 0 $0 19 $120,158 3 $43,667 0 $0 1 $120,000
Aggregated Statistics For Year 2000(Based on 1 full tract) A) FHA, FSA/RHS & VA B) Conventional C) Refinancings D) Home Improvement Loans F) Non-occupant Loans on Number Average Value Number Average Value Number Average Value Number Average Value Number Average Value
LOANS ORIGINATED 24 $150,625 88 $148,943 49 $90,959 20 $26,350 11 $103,455 APPLICATIONS APPROVED, NOT ACCEPTED 2 $190,000 12 $131,500 22 $91,545 15 $24,200 0 $0 APPLICATIONS DENIED 3 $138,000 11 $125,727 64 $67,125 27 $16,148 1 $10,000 APPLICATIONS WITHDRAWN 5 $128,400 5 $132,800 33 $95,636 3 $15,333 5 $92,000 FILES CLOSED FOR INCOMPLETENESS 0 $0 5 $182,200 15 $109,400 0 $0 0 $0
Aggregated Statistics For Year 1999(Based on 1 full tract) A) FHA, FSA/RHS & VA B) Conventional C) Refinancings D) Home Improvement Loans F) Non-occupant Loans on Number Average Value Number Average Value Number Average Value Number Average Value Number Average Value
LOANS ORIGINATED 44 $132,107 76 $147,653 96 $288,180 14 $26,144 8 $101,792 APPLICATIONS APPROVED, NOT ACCEPTED 3 $140,403 16 $261,501 20 $95,571 4 $25,175 3 $184,300 APPLICATIONS DENIED 4 $123,700 13 $144,352 48 $83,879 15 $26,015 2 $59,550 APPLICATIONS WITHDRAWN 5 $139,436 12 $110,386 25 $101,826 2 $135,560 5 $85,792 FILES CLOSED FOR INCOMPLETENESS 2 $110,385 4 $100,702 17 $127,246 0 $0 0 $0
Detailed HMDA statistics for the following Tracts:
0003.00
Private Mortgage Insurance Companies Aggregated Statistics For Year 2009(Based on 1 full tract) A) Conventional B) Refinancings Number Average Value Number Average Value
LOANS ORIGINATED 5 $273,800 3 $262,000 APPLICATIONS APPROVED, NOT ACCEPTED 0 $0 0 $0 APPLICATIONS DENIED 3 $222,000 2 $277,000 APPLICATIONS WITHDRAWN 0 $0 0 $0 FILES CLOSED FOR INCOMPLETENESS 0 $0 0 $0
Aggregated Statistics For Year 2008(Based on 1 full tract) A) Conventional B) Refinancings C) Non-occupant Loans on Number Average Value Number Average Value Number Average Value
LOANS ORIGINATED 16 $296,500 6 $314,000 1 $176,000 APPLICATIONS APPROVED, NOT ACCEPTED 8 $295,250 1 $327,000 1 $327,000 APPLICATIONS DENIED 2 $295,500 3 $317,333 0 $0 APPLICATIONS WITHDRAWN 3 $315,333 0 $0 0 $0 FILES CLOSED FOR INCOMPLETENESS 0 $0 0 $0 0 $0
Aggregated Statistics For Year 2007(Based on 1 full tract) A) Conventional B) Refinancings C) Non-occupant Loans on Number Average Value Number Average Value Number Average Value
LOANS ORIGINATED 22 $289,000 16 $310,062 6 $283,500 APPLICATIONS APPROVED, NOT ACCEPTED 3 $256,000 6 $383,333 0 $0 APPLICATIONS DENIED 1 $315,000 2 $358,500 1 $327,000 APPLICATIONS WITHDRAWN 0 $0 4 $327,250 0 $0 FILES CLOSED FOR INCOMPLETENESS 0 $0 0 $0 0 $0
Aggregated Statistics For Year 2006(Based on 1 full tract) A) Conventional B) Refinancings C) Non-occupant Loans on Number Average Value Number Average Value Number Average Value
LOANS ORIGINATED 19 $306,737 1 $256,000 1 $252,000 APPLICATIONS APPROVED, NOT ACCEPTED 0 $0 0 $0 0 $0 APPLICATIONS DENIED 0 $0 0 $0 0 $0 APPLICATIONS WITHDRAWN 0 $0 1 $333,000 0 $0 FILES CLOSED FOR INCOMPLETENESS 0 $0 0 $0 0 $0
Aggregated Statistics For Year 2005(Based on 1 full tract) A) Conventional B) Refinancings C) Non-occupant Loans on Number Average Value Number Average Value Number Average Value
LOANS ORIGINATED 21 $279,857 6 $271,333 2 $288,000 APPLICATIONS APPROVED, NOT ACCEPTED 4 $290,500 4 $245,000 2 $327,000 APPLICATIONS DENIED 0 $0 0 $0 0 $0 APPLICATIONS WITHDRAWN 1 $276,000 2 $304,000 0 $0 FILES CLOSED FOR INCOMPLETENESS 0 $0 1 $153,000 0 $0
Aggregated Statistics For Year 2004(Based on 1 full tract) A) Conventional B) Refinancings C) Non-occupant Loans on Number Average Value Number Average Value Number Average Value
LOANS ORIGINATED 26 $263,500 5 $211,400 3 $295,667 APPLICATIONS APPROVED, NOT ACCEPTED 3 $291,667 2 $271,500 0 $0 APPLICATIONS DENIED 1 $194,000 0 $0 0 $0 APPLICATIONS WITHDRAWN 1 $320,000 0 $0 0 $0 FILES CLOSED FOR INCOMPLETENESS 1 $334,000 1 $290,000 1 $334,000
Aggregated Statistics For Year 2003(Based on 1 full tract) A) Conventional B) Refinancings C) Non-occupant Loans on Number Average Value Number Average Value Number Average Value
LOANS ORIGINATED 35 $227,057 21 $203,714 4 $224,500 APPLICATIONS APPROVED, NOT ACCEPTED 6 $205,000 7 $225,571 0 $0 APPLICATIONS DENIED 0 $0 0 $0 0 $0 APPLICATIONS WITHDRAWN 2 $191,000 2 $226,000 0 $0 FILES CLOSED FOR INCOMPLETENESS 0 $0 1 $221,000 0 $0
Aggregated Statistics For Year 2002(Based on 1 full tract) A) Conventional B) Refinancings C) Non-occupant Loans on Number Average Value Number Average Value Number Average Value
LOANS ORIGINATED 41 $186,927 17 $178,529 5 $185,400 APPLICATIONS APPROVED, NOT ACCEPTED 6 $161,833 6 $174,500 0 $0 APPLICATIONS DENIED 0 $0 1 $218,000 0 $0 APPLICATIONS WITHDRAWN 2 $146,500 2 $162,000 0 $0 FILES CLOSED FOR INCOMPLETENESS 0 $0 0 $0 0 $0
Aggregated Statistics For Year 2001(Based on 1 full tract) A) Conventional B) Refinancings C) Non-occupant Loans on Number Average Value Number Average Value Number Average Value
LOANS ORIGINATED 31 $154,097 17 $154,294 4 $131,250 APPLICATIONS APPROVED, NOT ACCEPTED 7 $145,857 3 $164,333 0 $0 APPLICATIONS DENIED 0 $0 0 $0 0 $0 APPLICATIONS WITHDRAWN 2 $159,500 0 $0 1 $166,000 FILES CLOSED FOR INCOMPLETENESS 0 $0 0 $0 0 $0
Aggregated Statistics For Year 2000(Based on 1 full tract) A) Conventional B) Refinancings C) Non-occupant Loans on Number Average Value Number Average Value Number Average Value
LOANS ORIGINATED 38 $146,816 4 $128,750 1 $96,000 APPLICATIONS APPROVED, NOT ACCEPTED 2 $122,500 1 $188,000 1 $96,000 APPLICATIONS DENIED 0 $0 0 $0 0 $0 APPLICATIONS WITHDRAWN 1 $57,000 0 $0 0 $0 FILES CLOSED FOR INCOMPLETENESS 0 $0 0 $0 0 $0
Aggregated Statistics For Year 1999(Based on 1 full tract) A) Conventional B) Refinancings C) Non-occupant Loans on Number Average Value Number Average Value Number Average Value
LOANS ORIGINATED 32 $131,174 6 $119,262 2 $122,975 APPLICATIONS APPROVED, NOT ACCEPTED 9 $132,011 2 $147,180 1 $137,500 APPLICATIONS DENIED 1 $193,660 0 $0 0 $0 APPLICATIONS WITHDRAWN 1 $161,710 0 $0 1 $161,710 FILES CLOSED FOR INCOMPLETENESS 1 $153,960 0 $0 0 $0
Detailed PMIC statistics for the following Tracts:
0003.00
Dunellen compared to New Jersey state average:
Unemployed percentage below state average. Black race population percentage below state average. Hispanic race population percentage above state average. Median age below state average. Foreign-born population percentage above state average. Length of stay since moving in above state average.
#7 on the list of "Top 101 cities with largest percentage of females in occupations: community and social service occupations (population 5,000+)"
#37 on the list of "Top 101 cities with the most residents born in Southern Africa (population 500+)"
#38 on the list of "Top 101 cities with the most residents born in South Africa (population 500+)"
#52 on the list of "Top 101 cities with the most residents born in Peru (population 500+)"
#64 on the list of "Top 101 cities with largest percentage of males in occupations: healthcare support occupations (population 5,000+)"
#79 on the list of "Top 101 cities with the most residents born in Ecuador (population 500+)"
#95 on the list of "Top 101 cities with the smallest house values disparities (population 5,000+)"
#15 on the list of "Top 101 counties with the most Orthodox adherents"
#17 on the list of "Top 101 counties with the lowest percentage of residents that keep firearms around their homes"
#24 on the list of "Top 101 counties with the lowest number of infant deaths per 1000 residents 2007-2013 (pop. 50,000+)"
#25 on the list of "Top 101 counties with the largest decrease in the number of infant deaths per 1000 residents 2000-2006 to 2007-2013 (pop. 50,000+)"
#29 on the list of "Top 101 counties with the most Catholic congregations"
Top Patent Applicants
Julio Lopes (7)
Matthew G. Woll (6)
Brian G. Worthington (5)
Sangwook Park (4)
George Raymond Maurer (4)
Michele Angelo Trovero (3)
Jayson T. Holovacs (3)
Brian Worthington (2)
Philip L. Ludwig (2)
Robert Priessnitz (2)
Total of 57 patent applications in 2008-2024.
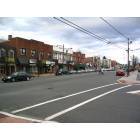
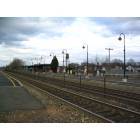
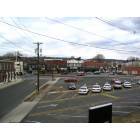
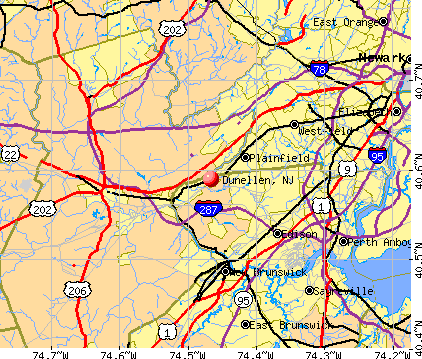


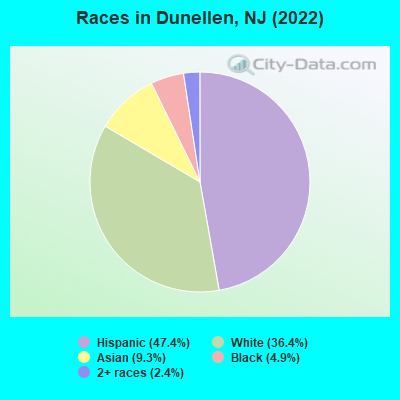
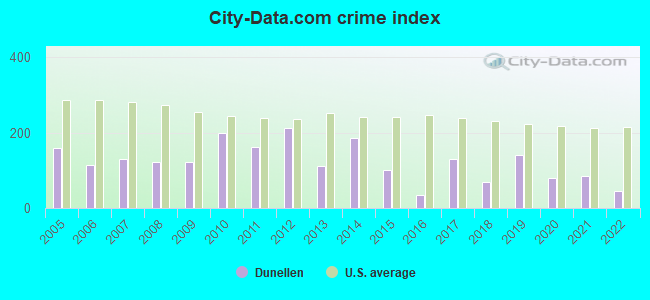
 Recent articles from our blog. Our writers, many of them Ph.D. graduates or candidates, create easy-to-read articles on a wide variety of topics.

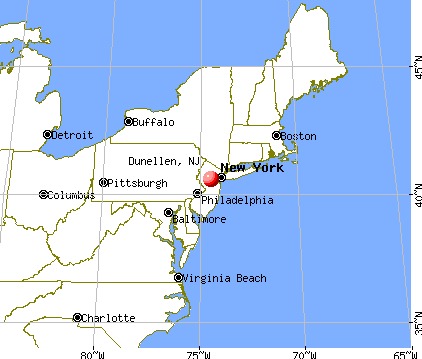
 (5.8 miles