Carlisle, Pennsylvania
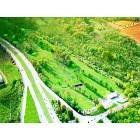
Carlisle: Rocky Meadows Golf Course along Interstate 81 in Carlisle, PA
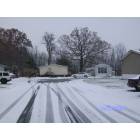
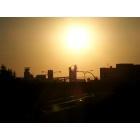
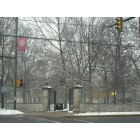
Carlisle: CARLISLE PA
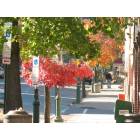
Carlisle: Autumn 2008 in Carlisle, Pennsylvania
Carlisle: Town Square; intersection of Hanover and High st
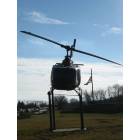
Carlisle: Helicopter at Army Heritage Museum
Carlisle
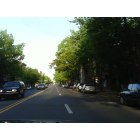
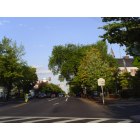
Carlisle: Hanover st in the Spring (main st)
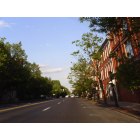
Carlisle: Gorgeous old houses along Hanover st
Carlisle: Dickinson College in Carlisle
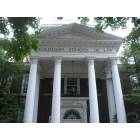
Carlisle: Dickinson School of Law - Trickett Hall
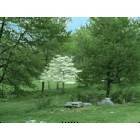
Carlisle: Dogwood Tree at Rocky Meadows Golf Course along Interstate 81 in Carlisle, PA
- add
your
Submit your own pictures of this borough and show them to the world
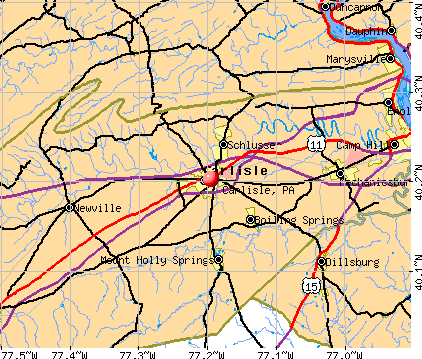
- OSM Map
- General Map
- Google Map
- MSN Map
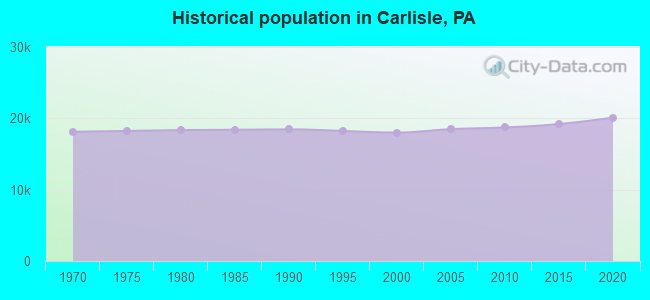
Population change since 2000: +23.6%
 |
| Males: 10,806 | |
| Females: 11,397 |
| Median resident age: | 31.7 years |
| Pennsylvania median age: | 40.9 years |
Zip codes: 17013.
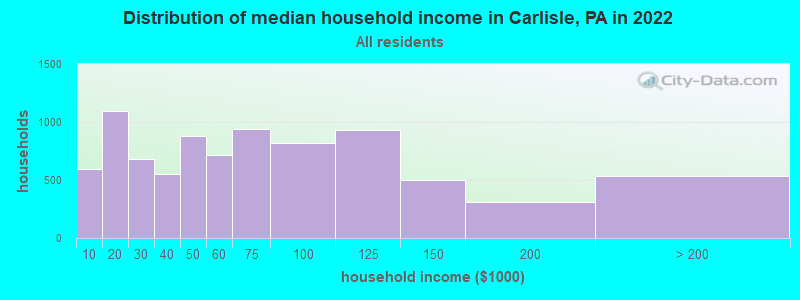
| Carlisle: | $54,462 |
| PA: | $71,798 |
Estimated per capita income in 2022: $34,819 (it was $21,394 in 2000)
Carlisle borough income, earnings, and wages data
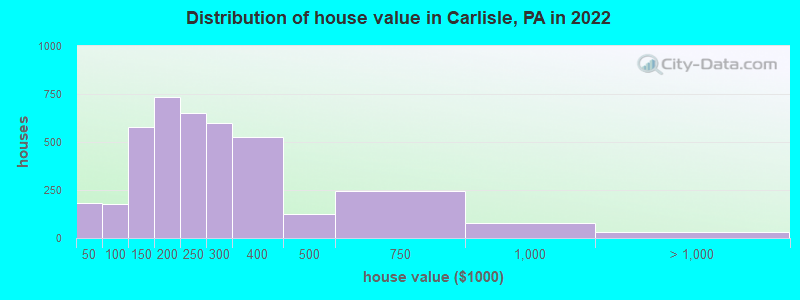
Estimated median house or condo value in 2022: $220,440 (it was $104,200 in 2000)
| Carlisle: | $220,440 |
| PA: | $245,500 |
Mean prices in 2022: all housing units: $276,350; detached houses: $315,886; townhouses or other attached units: $193,352; in 2-unit structures: $241,448; in 5-or-more-unit structures: $190,172
Median gross rent in 2022: $960.
(11.3% for White Non-Hispanic residents, 61.7% for Black residents, 50.6% for Hispanic or Latino residents, 32.7% for other race residents, 56.5% for two or more races residents)
Detailed information about poverty and poor residents in Carlisle, PA


Compare current foreclosures in Carlisle, PA:
| Photo | Address | Area | Beds / Baths | Price | Details |
|---|---|---|---|---|---|

|
#1
N West St
Carlisle, PA 17013
|
1,440 sq. feet
|
1 baths 3 beds |
show details | |

|
#2
Wheatfield Dr
Carlisle, PA 17015
|
1,101 sq. feet
|
2 baths 3 beds |
show details | |

|
#3
N West St
Carlisle, PA 17013
|
1,584 sq. feet
|
2 baths 3 beds |
show details | |

|
#4
Meeting House Rd
Carlisle, PA 17013
|
1,456 sq. feet
|
2 baths 3 beds |
show details | |

|
#5
Spring Rd
Carlisle, PA 17013
|
1,496 sq. feet
|
1 baths 3 beds |
show details | |

|
#6
Spring Rd
Carlisle, PA 17013
|
922 sq. feet
|
1 baths 2 beds |
show details | |

|
#7
Richland Rd
Carlisle, PA 17015
|
2,655 sq. feet
|
2 baths 2 beds |
show details | |

|
#8
W Penn St
Carlisle, PA 17013
|
1,272 sq. feet
|
- baths - beds |
show details | |

|
#9
Spring Rd
Carlisle, PA 17013
|
1,496 sq. feet
|
- baths - beds |
show details | |

|
#10
N West St
Carlisle, PA 17013
|
1,440 sq. feet
|
- baths - beds |
show details |
| Photo | Address | Area | Beds / Baths | Price | Details |
|---|---|---|---|---|---|

|
#11
Gobin Dr
Carlisle, PA 17013
|
1,643 sq. feet
|
- baths - beds |
show details | |

|
#12
Circle Rd
Carlisle, PA 17013
|
1,728 sq. feet
|
- baths - beds |
show details | |

|
#13
Courtyard Dr
Carlisle, PA 17013
|
1,877 sq. feet
|
- baths - beds |
show details | |

|
#14
C St
Carlisle, PA 17013
|
1,190 sq. feet
|
- baths - beds |
show details | |

|
#15
Longs Gap Rd
Carlisle, PA 17013
|
2,070 sq. feet
|
- baths - beds |
show details | |

|
#16
Clay Rd
Carlisle, PA 17015
|
1,224 sq. feet
|
- baths - beds |
show details | |

|
#17
Ridge Dr
Carlisle, PA 17015
|
1,232 sq. feet
|
- baths - beds |
show details | |

|
#18
Bennington Way
Carlisle, PA 17013
|
- sq. feet
|
- baths - beds |
show details | |

|
#19
Bradley Dr Apt 112
Carlisle, PA 17013
|
- sq. feet
|
- baths - beds |
show details | |

|
#20
Wesley Dr
Carlisle, PA 17015
|
1,690 sq. feet
|
- baths - beds |
show details |
| Photo | Address | Area | Beds / Baths | Price | Details |
|---|---|---|---|---|---|

|
#21
Kutz Rd
Carlisle, PA 17015
|
2,170 sq. feet
|
- baths - beds |
show details | |

|
#22
S Middlesex Rd
Carlisle, PA 17015
|
2,714 sq. feet
|
- baths - beds |
show details | |

|
#23
Courtyard Dr
Carlisle, PA 17013
|
1,877 sq. feet
|
- baths - beds |
show details | |

|
#24
Alters Rd
Carlisle, PA 17015
|
1,708 sq. feet
|
- baths - beds |
show details | |

|
#25
Winchester Gdns
Carlisle, PA 17013
|
- sq. feet
|
- baths - beds |
show details | |

|
#26
Gobin Dr
Carlisle, PA 17013
|
1,092 sq. feet
|
- baths - beds |
show details | |

|
#27
B St
Carlisle, PA 17013
|
1,237 sq. feet
|
- baths - beds |
show details | |

|
#28
Eastwood Dr
Carlisle, PA 17015
|
1,904 sq. feet
|
- baths - beds |
show details | |

|
#29
Waverly Ln
Carlisle, PA 17015
|
- sq. feet
|
- baths - beds |
show details | |

|
#30
Fry Loop Ave
Carlisle, PA 17013
|
2,444 sq. feet
|
- baths - beds |
show details |
| Photo | Address | Area | Beds / Baths | Price | Details |
|---|---|---|---|---|---|

|
#31
Spring Rd
Carlisle, PA 17013
|
1,064 sq. feet
|
- baths - beds |
show details | |

|
#32
Kutz Rd
Carlisle, PA 17015
|
1,020 sq. feet
|
- baths - beds |
show details | |

|
#33
S Middlesex Rd
Carlisle, PA 17015
|
- sq. feet
|
- baths - beds |
show details | |

|
#34
N Middlesex Rd
Carlisle, PA 17013
|
1,740 sq. feet
|
- baths - beds |
show details | |

|
#35
Mountainview Dr
Carlisle, PA 17013
|
- sq. feet
|
- baths - beds |
show details | |

|
#36
Eastgate Dr
Carlisle, PA 17015
|
- sq. feet
|
- baths - beds |
show details | |

|
#37
W Pomfret St
Carlisle, PA 17013
|
- sq. feet
|
- baths - beds |
show details | |

|
#38
W Pomfret St Apt 1
Carlisle, PA 17013
|
- sq. feet
|
- baths - beds |
show details | |

|
#39
Clemson Dr
Carlisle, PA 17013
|
1,768 sq. feet
|
- baths - beds |
show details | |

|
#40
Marion Ave
Carlisle, PA 17013
|
- sq. feet
|
- baths - beds |
show details |
| Photo | Address | Area | Beds / Baths | Price | Details |
|---|---|---|---|---|---|

|
#41
Church Rd
Carlisle, PA 17015
|
2,537 sq. feet
|
- baths - beds |
show details | |

|
#42
Hidden Noll Rd
Carlisle, PA 17013
|
- sq. feet
|
- baths - beds |
show details | |

|
#43
James Ct
Carlisle, PA 17015
|
- sq. feet
|
- baths - beds |
show details | |

|
#44
Sarasota Cir
Carlisle, PA 17015
|
- sq. feet
|
- baths - beds |
show details | |

|
#45
Monarch Dr
Carlisle, PA 17015
|
- sq. feet
|
- baths - beds |
show details | |

|
#46
Demi Ct
Carlisle, PA 17015
|
- sq. feet
|
- baths - beds |
show details | |

|
#47
Bonnybrook Rd
Carlisle, PA 17013
|
- sq. feet
|
- baths - beds |
show details | |

|
#48
Garden Pkwy
Carlisle, PA 17013
|
- sq. feet
|
- baths - beds |
show details | |

|
#49
Alexander Spring Rd
Carlisle, PA 17015
|
- sq. feet
|
- baths - beds |
show details | |

|
Check over 1 million property listings on Foreclosure.com!
|
browse all offers | |||


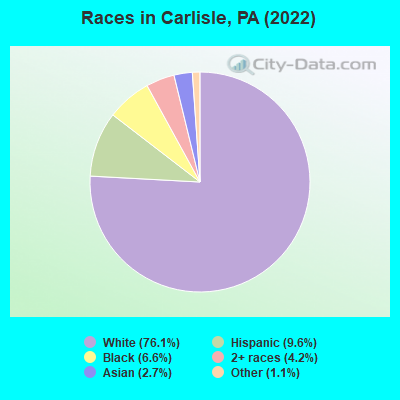
- 16,30976.1%White alone
- 2,0569.6%Hispanic
- 1,4116.6%Black alone
- 8944.2%Two or more races
- 5682.7%Asian alone
- 2411.1%Other race alone
Races in Carlisle detailed stats: ancestries, foreign born residents, place of birth
According to our research of Pennsylvania and other state lists, there were 76 registered sex offenders living in Carlisle, Pennsylvania as of June 12, 2024.
The ratio of all residents to sex offenders in Carlisle is 250 to 1.
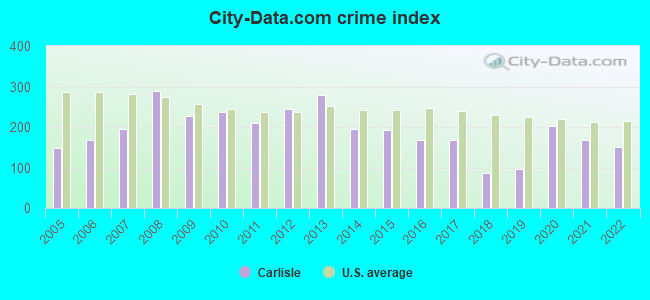
Type |
2009 |
2010 |
2011 |
2012 |
2013 |
2014 |
2015 |
2016 |
2017 |
2018 |
2019 |
2020 |
2021 |
2022 |
|---|---|---|---|---|---|---|---|---|---|---|---|---|---|---|
| Murders (per 100,000) | 1 (5.4) | 0 (0.0) | 0 (0.0) | 0 (0.0) | 3 (15.8) | 0 (0.0) | 0 (0.0) | 2 (10.4) | 1 (5.2) | 1 (5.2) | 0 (0.0) | 7 (36.4) | 2 (10.4) | 2 (9.9) |
| Rapes (per 100,000) | 10 (54.3) | 10 (53.5) | 8 (42.7) | 15 (78.5) | 15 (79.2) | 8 (42.2) | 4 (21.1) | 7 (36.4) | 9 (46.8) | 7 (36.2) | 6 (31.2) | 4 (20.8) | 8 (41.5) | 9 (44.5) |
| Robberies (per 100,000) | 17 (92.4) | 27 (144.5) | 26 (138.7) | 19 (99.5) | 15 (79.2) | 14 (73.8) | 21 (110.8) | 11 (57.2) | 12 (62.4) | 7 (36.2) | 11 (57.1) | 9 (46.8) | 7 (36.3) | 4 (19.8) |
| Assaults (per 100,000) | 14 (76.1) | 17 (91.0) | 24 (128.1) | 14 (73.3) | 14 (74.0) | 17 (89.6) | 21 (110.8) | 6 (31.2) | 17 (88.4) | 3 (15.5) | 9 (46.7) | 24 (124.7) | 16 (83.1) | 30 (148.2) |
| Burglaries (per 100,000) | 76 (412.9) | 72 (385.4) | 53 (282.8) | 60 (314.1) | 75 (396.2) | 51 (268.8) | 65 (342.8) | 49 (254.9) | 33 (171.6) | 8 (41.4) | 11 (57.1) | 9 (46.8) | 24 (124.6) | 12 (59.3) |
| Thefts (per 100,000) | 462 (2,510) | 482 (2,580) | 405 (2,161) | 547 (2,863) | 550 (2,906) | 476 (2,509) | 451 (2,379) | 350 (1,821) | 332 (1,726) | 137 (708.6) | 185 (960.9) | 324 (1,683) | 365 (1,895) | 265 (1,309) |
| Auto thefts (per 100,000) | 3 (16.3) | 3 (16.1) | 6 (32.0) | 3 (15.7) | 5 (26.4) | 4 (21.1) | 4 (21.1) | 11 (57.2) | 5 (26.0) | 4 (20.7) | 8 (41.6) | 7 (36.4) | 5 (26.0) | 7 (34.6) |
| Arson (per 100,000) | 2 (10.9) | 4 (21.4) | 4 (21.3) | 3 (15.7) | 1 (5.3) | 0 (0.0) | 5 (26.4) | 2 (10.4) | 2 (10.4) | 1 (5.2) | 1 (5.2) | 5 (26.0) | 5 (26.0) | 2 (9.9) |
| City-Data.com crime index | 227.9 | 235.8 | 210.2 | 245.1 | 279.7 | 194.6 | 193.1 | 168.6 | 167.4 | 86.2 | 97.2 | 201.8 | 168.1 | 150.2 |
The City-Data.com crime index weighs serious crimes and violent crimes more heavily. Higher means more crime, U.S. average is 246.1. It adjusts for the number of visitors and daily workers commuting into cities.
Crime rate in Carlisle detailed stats: murders, rapes, robberies, assaults, burglaries, thefts, arson
Full-time law enforcement employees in 2021, including police officers: 34 (32 officers - 30 male; 2 female).
| Officers per 1,000 residents here: | 1.66 |
| Pennsylvania average: | 2.55 |
 Recent articles from our blog. Our writers, many of them Ph.D. graduates or candidates, create easy-to-read articles on a wide variety of topics.

 | Carlisle area 55+ MH community, reasonable cost? (3 replies) |
| Hershey vs. Carlisle: Which is Better? (16 replies) |
| Walkable areas - PA small to mid sized cities (19 replies) |
| Brownfield Mixed-Use Redevelopment Project Slated for Carlisle (1 reply) |
| Carlisle area (4 replies) |
| Helping getting from Carlisle to Washington, D.C. (3 replies) |
Latest news from Carlisle, PA collected exclusively by city-data.com from local newspapers, TV, and radio stations
Carlisle, PA City Guides:
Ancestries: German (21.9%), Irish (7.5%), African (6.4%), American (6.2%), English (5.3%), Yugoslavian (4.8%).
Current Local Time: EST time zone
Incorporated in 1782
Elevation: 480 feet
Land area: 5.43 square miles.
Population density: 4,088 people per square mile (average).
1,642 residents are foreign born (2.7% Europe, 2.4% Asia, 1.3% Latin America, 0.9% Africa).
| This borough: | 7.7% |
| Pennsylvania: | 7.3% |
Median real estate property taxes paid for housing units with mortgages in 2022: $3,211 (1.6%)
Median real estate property taxes paid for housing units with no mortgage in 2022: $3,236 (1.3%)
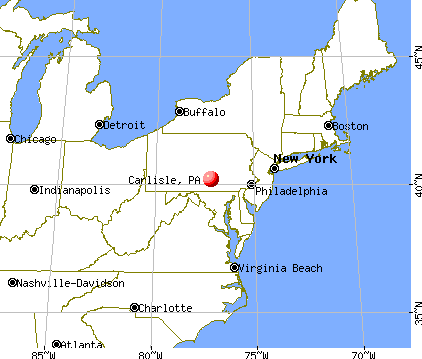
Nearest city with pop. 50,000+: Lancaster, PA  (48.4 miles , pop. 56,348).
Nearest city with pop. 200,000+: Baltimore, MD (69.1 miles , pop. 651,154).
Nearest city with pop. 1,000,000+: Philadelphia, PA (109.4 miles , pop. 1,517,550).
Nearest cities:
), ), ), )Latitude: 40.20 N, Longitude: 77.20 W
Daytime population change due to commuting: +8,234 (+38.4%)
Workers who live and work in this borough: 5,465 (54.9%)
Area code: 717

Carlisle, Pennsylvania accommodation & food services, waste management - Economy and Business Data
| Here: | 2.2% |
| Pennsylvania: | 2.9% |
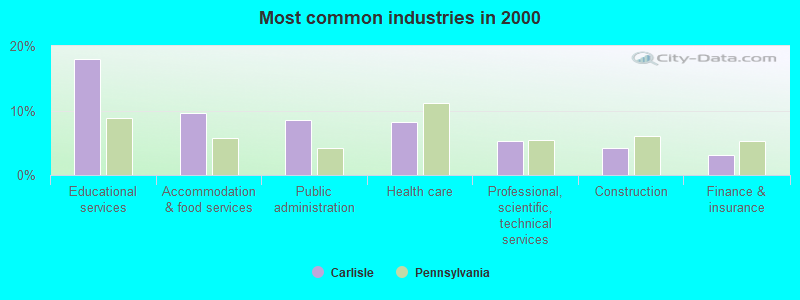
- Educational services (18.0%)
- Accommodation & food services (9.6%)
- Public administration (8.5%)
- Health care (8.2%)
- Professional, scientific, technical services (5.3%)
- Construction (4.1%)
- Finance & insurance (3.1%)
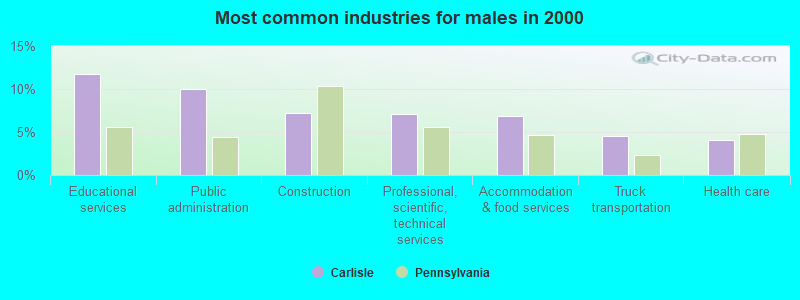
- Educational services (11.8%)
- Public administration (10.0%)
- Construction (7.2%)
- Professional, scientific, technical services (7.1%)
- Accommodation & food services (6.9%)
- Truck transportation (4.5%)
- Health care (4.0%)
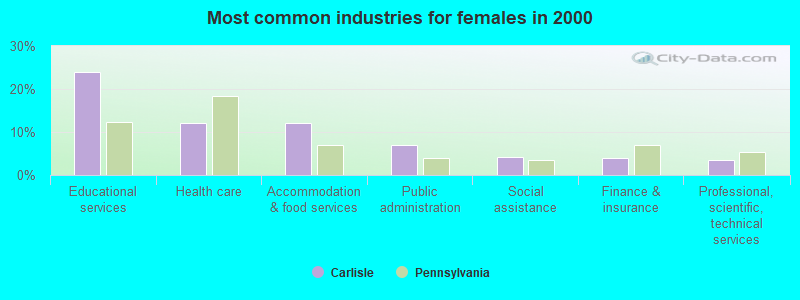
- Educational services (23.9%)
- Health care (12.2%)
- Accommodation & food services (12.1%)
- Public administration (7.0%)
- Social assistance (4.3%)
- Finance & insurance (3.9%)
- Professional, scientific, technical services (3.6%)

- Other management occupations, except farmers and farm managers (5.7%)
- Other office and administrative support workers, including supervisors (4.6%)
- Laborers and material movers, hand (4.0%)
- Building and grounds cleaning and maintenance occupations (3.9%)
- Preschool, kindergarten, elementary, and middle school teachers (3.3%)
- Postsecondary teachers (2.9%)
- Information and record clerks, except customer service representatives (2.9%)
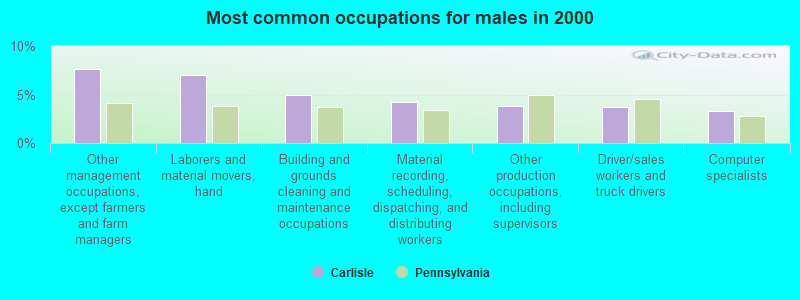
- Other management occupations, except farmers and farm managers (7.6%)
- Laborers and material movers, hand (7.0%)
- Building and grounds cleaning and maintenance occupations (4.9%)
- Material recording, scheduling, dispatching, and distributing workers (4.2%)
- Other production occupations, including supervisors (3.8%)
- Driver/sales workers and truck drivers (3.7%)
- Computer specialists (3.3%)
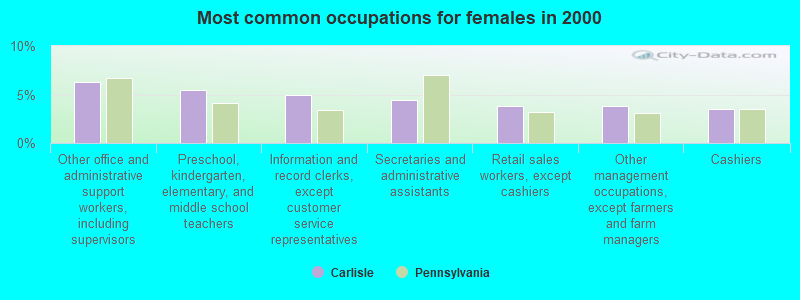
- Other office and administrative support workers, including supervisors (6.3%)
- Preschool, kindergarten, elementary, and middle school teachers (5.4%)
- Information and record clerks, except customer service representatives (5.0%)
- Secretaries and administrative assistants (4.5%)
- Retail sales workers, except cashiers (3.8%)
- Other management occupations, except farmers and farm managers (3.8%)
- Cashiers (3.5%)
Average climate in Carlisle, Pennsylvania
Based on data reported by over 4,000 weather stations


|
|


(lower is better)
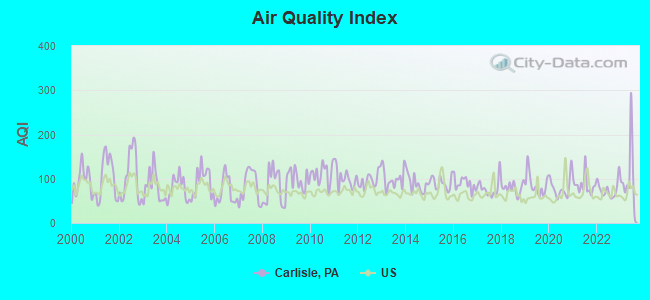
Air Quality Index (AQI) level in 2023 was 104. This is significantly worse than average.
| City: | 104 |
| U.S.: | 73 |
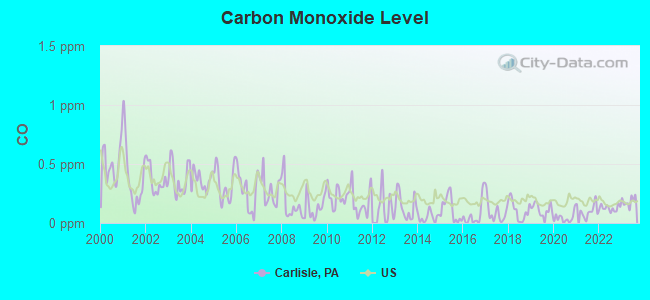
Carbon Monoxide (CO) [ppm] level in 2023 was 0.183. This is better than average. Closest monitor was 17.0 miles away from the city center.
| City: | 0.183 |
| U.S.: | 0.251 |
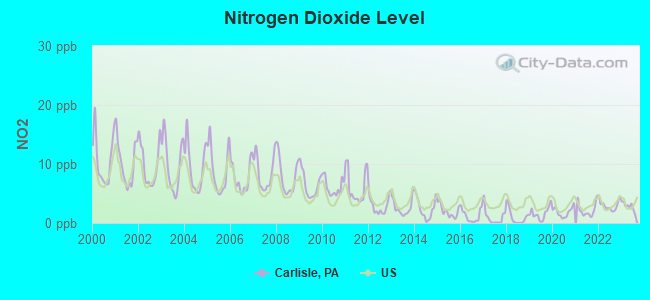
Nitrogen Dioxide (NO2) [ppb] level in 2023 was 2.84. This is significantly better than average. Closest monitor was 17.3 miles away from the city center.
| City: | 2.84 |
| U.S.: | 5.11 |
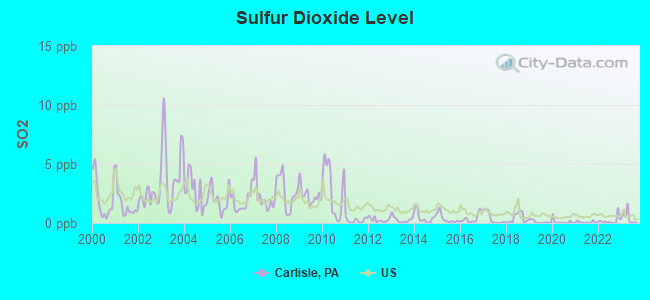
Sulfur Dioxide (SO2) [ppb] level in 2023 was 0.475. This is significantly better than average. Closest monitor was 17.3 miles away from the city center.
| City: | 0.475 |
| U.S.: | 1.515 |
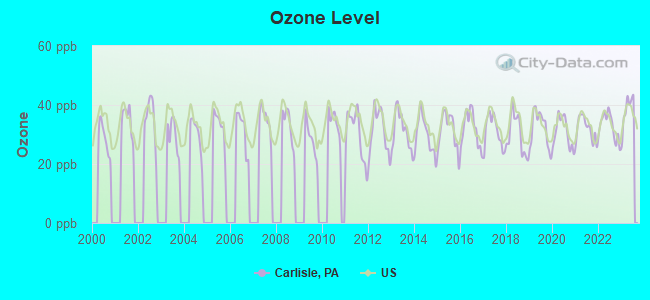
Ozone [ppb] level in 2023 was 38.2. This is about average. Closest monitor was 17.3 miles away from the city center.
| City: | 38.2 |
| U.S.: | 33.3 |
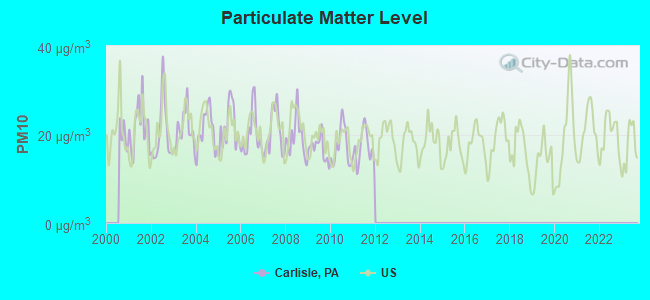
Particulate Matter (PM10) [µg/m3] level in 2011 was 17.0. This is about average. Closest monitor was 17.7 miles away from the city center.
| City: | 17.0 |
| U.S.: | 19.2 |
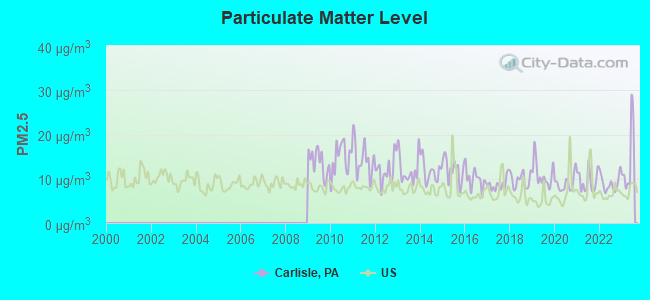
Particulate Matter (PM2.5) [µg/m3] level in 2023 was 14.2. This is significantly worse than average. Closest monitor was 3.1 miles away from the city center.
| City: | 14.2 |
| U.S.: | 8.1 |
Tornado activity:
Carlisle-area historical tornado activity is slightly above Pennsylvania state average. It is 4% smaller than the overall U.S. average.
On 4/16/1961, a category F3 (max. wind speeds 158-206 mph) tornado 20.2 miles away from the Carlisle borough center caused between $50,000 and $500,000 in damages.
On 6/7/1980, a category F3 tornado 21.0 miles away from the borough center caused between $50,000 and $500,000 in damages.
Earthquake activity:
Carlisle-area historical earthquake activity is significantly above Pennsylvania state average. It is 62% smaller than the overall U.S. average.On 8/23/2011 at 17:51:04, a magnitude 5.8 (5.8 MW, Depth: 3.7 mi, Class: Moderate, Intensity: VI - VII) earthquake occurred 163.5 miles away from the city center
On 1/16/1994 at 01:49:16, a magnitude 4.6 (4.6 MB, 4.6 LG, Depth: 3.1 mi, Class: Light, Intensity: IV - V) earthquake occurred 61.7 miles away from the city center
On 9/25/1998 at 19:52:52, a magnitude 5.2 (4.8 MB, 4.3 MS, 5.2 LG, 4.5 MW, Depth: 3.1 mi) earthquake occurred 189.7 miles away from Carlisle center
On 1/16/1994 at 00:42:43, a magnitude 4.2 (4.2 MB, 4.0 LG, Depth: 3.1 mi) earthquake occurred 63.3 miles away from Carlisle center
On 1/31/1986 at 16:46:43, a magnitude 5.0 (5.0 MB) earthquake occurred 228.7 miles away from the city center
On 10/7/1983 at 10:18:46, a magnitude 5.3 (5.1 MB, 5.3 LG, 5.1 ML) earthquake occurred 297.9 miles away from Carlisle center
Magnitude types: regional Lg-wave magnitude (LG), body-wave magnitude (MB), local magnitude (ML), surface-wave magnitude (MS), moment magnitude (MW)
Natural disasters:
The number of natural disasters in Cumberland County (17) is near the US average (15).Major Disasters (Presidential) Declared: 13
Emergencies Declared: 4
Causes of natural disasters: Winter Storms: 4, Floods: 3, Hurricanes: 3, Snowstorms: 3, Storms: 3, Tropical Storms: 3, Blizzard: 1, Heavy Rain: 1, Snowfall: 1, Tropical Depression: 1, Other: 1 (Note: some incidents may be assigned to more than one category).

Hospitals in Carlisle:
- CARLISLE REGIONAL MEDICAL CENTER (Proprietary, provides emergency services, 361 ALEXANDER SPRING ROAD)
Nursing Homes in Carlisle:
- CHAPEL POINTE AT CARLISLE (770 S. HANOVER STREET)
- CHURCH OF GOD HOME, INC (801 N. HANOVER STREET)
- CLAREMONT NRC OF CUMBERLAND CO (375 CLAREMONT ROAD)
- CUMBERLAND CROSSINGS RETIREMENT COMMUNITY (1 LONGSDORF WAY)
- FOREST PARK HEALTH CENTER (700 WALNUT BOTTOM ROAD)
- MANORCARE HEALTH SERVICES-CARLISLE (940 WALNUT BOTTOM ROAD)
- SARA A TODD MEM HOME (50 MOORELAND AVE)
- SARAH A TODD MEMORIAL HOME (1000 WEST SOUTH STREET)
- THORNWALD HOME (442 WALNUT BOTTOM ROAD)
Dialysis Facilities in Carlisle:
- FRESENIUS MEDICAL CARE CUMBERLAND COUNTY (254 EAST HIGH STREET)
- US RENAL CARE CARLISLE (101 NOBLE BOULEVARD, SUITE 103)
Home Health Centers in Carlisle:
Airports and heliports located in Carlisle:
- Carlisle Airport (N94) (Runways: 1, Air Taxi Ops: 500, Itinerant Ops: 8,000, Local Ops: 15,000, Military Ops: 1,000)
- Neiderer Airport (PA55) (Runways: 1)
- Carlisle Barracks Heliport (N95)
- Carlisle Regional Medical Center Heliport (21PN)
- North Middlesex Heliport (6PS6)
Amtrak station near Carlisle:
- 18 miles: HARRISBURG (4TH & CHESTNUT STS.) . Services: ticket office, fully wheelchair accessible, enclosed waiting area, public restrooms, public payphones, snack bar, ATM, paid short-term parking, paid long-term parking, call for car rental service, taxi stand, intercity bus service, public transit connection.
Colleges/Universities in Carlisle:
Other colleges/universities with over 2000 students near Carlisle:
- Messiah College (about 12 miles; Mechanicsburg, PA; Full-time enrollment: 3,035)
- Harrisburg Area Community College-Harrisburg (about 18 miles; Harrisburg, PA; FT enrollment: 13,276)
- Shippensburg University of Pennsylvania (about 21 miles; Shippensburg, PA; FT enrollment: 7,051)
- Pennsylvania State University-Penn State Harrisburg (about 24 miles; Middletown, PA; FT enrollment: 3,797)
- Gettysburg College (about 26 miles; Gettysburg, PA; FT enrollment: 2,772)
- York College Pennsylvania (about 31 miles; York, PA; FT enrollment: 5,140)
- YTI Career Institute-York (about 32 miles; York, PA; FT enrollment: 2,212)
Public high school in Carlisle:
- CARLISLE AREA HS (Students: 1,625, Location: 623 W PENN ST, Grades: 9-12)
Private high schools in Carlisle:
Public elementary/middle schools in Carlisle:
- LAMBERTON MS (Students: 562, Location: 777 S HANOVER ST, Grades: 6-8)
- WILSON MS (Students: 532, Location: 900 WAGGONER'S GAP RD, Grades: 6-8)
- CRESTVIEW EL SCH (Students: 479, Location: 240 LONGS GAP RD, Grades: KG-5)
- MIDDLESEX EL SCH (Students: 406, Location: 250 N MIDDLESEX RD, Grades: KG-5)
- BELLAIRE EL SCH (Students: 390, Location: 905 WAGGONER'S GAP RD, Grades: KG-5)
- MOORELAND EL SCH (Students: 283, Location: 329 WILSON ST, Grades: KG-5)
- NORTH DICKINSON EL SCH (Students: 236, Location: 151 N DICKINSON SCHOOL RD, Grades: KG-5)
- LETORT EL SCH (Location: 110 E SOUTH ST, Grades: KG-5)
- HAMILTON EL SCH (Location: 735 CLAY ST, Grades: KG-5)
Private elementary/middle schools in Carlisle:
User-submitted facts and corrections:
- Carlisle Hospital has recently moved to 45 Sprint Drive, Carlisle, PA
- The U.S. Army War College is an accredited MA-level school in Carlisle. added by Tom
Points of interest:
Notable locations in Carlisle: Anita Tuvin Schlechter Auditorium (A), Baird-McClintock Hall (B), Benjamin D James Center (C), Biddle House (D), Central Pennsylvania Youth Ballet (E), Colonel John Montgomery Hall (F), Cook House (G), Denny Memorial Hall (H), Doctor C Scott Althouse Hall (I), Drayer Hall (J), East College Building (K), Education Department Building (L), Emil R Weiss Center for the Arts (M), George Edward Reed Hall (N), Gilbert Malcolm Hall (O), Goodyear Building (P), Hartman Guest House (Q), Hugh B and Helen Kisner-Woodward Hall (R), James Buchanan Hall (S), James Henry Morgan Hall (T). Display/hide their locations on the map
Shopping Centers: Carlisle Plaza Mall (1), M J Carlisle Mall (2). Display/hide their locations on the map
Cemeteries: Ashland Cemetery (1), Union Cemetery (2). Display/hide their locations on the map
Parks in Carlisle include: Hays Tennis Courts (1), Dickinson Park Intramural Fields (2), Herman Bosier Biddle Athletic Field (3), Letort Park (4). Display/hide their locations on the map
Tourist attractions: Cumberland County Historical Society (Museums; 21 North Pitt Street), Get Tanked Aquariums (Cultural Attractions- Events- & Facilities; 1-A North Letort Dr.), Carlisle Area School District - David L Swartz Intermediate High School- Lib (Cultural Attractions- Events- & Facilities; 623 West Penn Street), British Network Ltd. (Tours & Charters; 112 West High Street), British Network Limited (Tours & Charters; 112 West High Street).
Hotels: Clarion Embers Hotel And Convention Center (313 Hanover St. Suite #4 S.), Clarion Hotel Embers & Convention Center (1700 Harrisburg Pike), Coach & Four Motor Lodge (1239 Harrisburg Pike), Hampton Inn (1164 Harrisburg Pike), Carlisle Thriftlodge (1179 Harrisburg Pike), Appalachian Motor Inn (1825 Harrisburg Pike), Duffy's Restaurant & Lounge (1450 Harrisburg Pike), Best Western (1155 Harrisburg Pike), Days Inn Carlisle (101 Alexander Spring Road).
Birthplace of: Bill Pearce - Gospel singer, John Bigler - Governor of California, Jay Zeamer, Jr. - Air Force Medal of Honor recipient, Anthony Lerew - 2005 Major League Baseball player (Atlanta Braves, born: Oct 28, 1982), Arthur Japy Hepburn - Navy admiral, Billy Owens - Basketball player, James Geddes (engineer) - Politician, Jeff Lebo - College basketball player, John Armstrong, Jr. - Politician, John Keeny - University president.
Drinking water stations with addresses in Carlisle and their reported violations in the past:
CARLISLE WATER TRMT PLT (Population served: 19,800, Surface water):Past monitoring violations:LINCOLN SPEEDWAY (Population served: 600, Groundwater):
- Monitoring, Turbidity (Enhanced SWTR) - In SEP-2011, Contaminant: IESWTR. Follow-up actions: St Compliance achieved (NOV-08-2011)
- Monitoring, Turbidity (Enhanced SWTR) - In APR-2011, Contaminant: IESWTR. Follow-up actions: St Violation/Reminder Notice (JUN-10-2011), St Compliance achieved (JUN-10-2011)
- Monitoring and Reporting (DBP) - Between JUL-2010 and SEP-2010, Contaminant: Total Haloacetic Acids (HAA5). Follow-up actions: St Violation/Reminder Notice (NOV-05-2010), St Compliance achieved (NOV-05-2010)
- Monitoring and Reporting (DBP) - Between JUL-2008 and SEP-2008, Contaminant: CARBON, TOTAL. Follow-up actions: St Violation/Reminder Notice (NOV-25-2008), St Compliance achieved (NOV-25-2008)
- Monitoring, Turbidity (Enhanced SWTR) - In SEP-2007, Contaminant: IESWTR. Follow-up actions: St Violation/Reminder Notice (NOV-09-2007), St Compliance achieved (NOV-09-2007)
- One routine major monitoring violation
- 2 regular monitoring violations
- 4 other older monitoring violations
Past monitoring violations:BIG SPRING TERRACE MHP (Population served: 440, Groundwater):
- 3 regular monitoring violations
Past monitoring violations:PLAINFIELD MART (Population served: 250, Groundwater):
- Monitoring and Reporting (DBP) - Between JUL-2012 and SEP-2012, Contaminant: Chlorine. Follow-up actions: St Compliance achieved (OCT-12-2012)
- Monitoring of Treatment (SWTR-Unfilt/GWR) - In APR-2012, Contaminant: GROUNDWATER RULE. Follow-up actions: St Compliance achieved (JUN-12-2012)
- Monitoring and Reporting (DBP) - Between JUL-2005 and SEP-2005, Contaminant: Chlorine. Follow-up actions: St Violation/Reminder Notice (APR-20-2006), St Compliance achieved (APR-20-2006)
- Monitoring and Reporting (DBP) - Between APR-2005 and JUN-2005, Contaminant: Chlorine. Follow-up actions: St Consent Decree/Judgement (AUG-09-2005), St Compliance achieved (AUG-09-2005), St Violation/Reminder Notice (AUG-09-2005)
- Follow-up Or Routine LCR Tap M/R - In JAN-01-2005, Contaminant: Lead and Copper Rule. Follow-up actions: St Public Notif requested (APR-12-2005), St Public Notif received (APR-12-2005), St Compliance achieved (APR-12-2005), St Violation/Reminder Notice (APR-12-2005)
- 4 regular monitoring violations
Past monitoring violations:MIDWAY SKATING & BOWLING CNTR (Population served: 200, Groundwater):
- 9 routine major monitoring violations
- 8 regular monitoring violations
Past monitoring violations:BETTY NELSON MHP (Population served: 170, Groundwater):
- One routine major monitoring violation
- 2 regular monitoring violations
Past monitoring violations:AUDUBON PARK (Population served: 150, Groundwater):
- Monitoring and Reporting (DBP) - Between APR-2010 and JUN-2010, Contaminant: Chlorine. Follow-up actions: St Violation/Reminder Notice (JUN-23-2010), St Compliance achieved (JUN-23-2010)
- Monitoring and Reporting (DBP) - Between JAN-2009 and MAR-2009, Contaminant: Chlorine. Follow-up actions: St Violation/Reminder Notice (APR-10-2009), St Compliance achieved (APR-10-2009)
- Monitoring and Reporting (DBP) - Between OCT-2005 and DEC-2005, Contaminant: Chlorine. Follow-up actions: St Consent Decree/Judgement (JAN-25-2006), St Compliance achieved (JAN-25-2006), St Violation/Reminder Notice (JAN-25-2006)
- Monitoring and Reporting (DBP) - Between JUL-2005 and SEP-2005, Contaminant: Chlorine. Follow-up actions: St Consent Decree/Judgement (NOV-01-2005), St Compliance achieved (NOV-01-2005), St Violation/Reminder Notice (NOV-01-2005)
- One minor monitoring violation
Past monitoring violations:EAGLES CROSSING GOLF CLUB (Population served: 150, Groundwater):
- Monitoring of Treatment (SWTR-Unfilt/GWR) - In MAY-2014, Contaminant: GROUNDWATER RULE. Follow-up actions: St Violation/Reminder Notice (JUL-17-2014)
- Monitoring of Treatment (SWTR-Unfilt/GWR) - In APR-2014, Contaminant: GROUNDWATER RULE. Follow-up actions: St Violation/Reminder Notice (JUN-19-2014)
- One routine major monitoring violation
- One regular monitoring violation
Past monitoring violations:
- 2 routine major monitoring violations
| This borough: | 2.1 people |
| Pennsylvania: | 2.5 people |
| This borough: | 53.5% |
| Whole state: | 65.0% |
| This borough: | 7.8% |
| Whole state: | 6.6% |
Likely homosexual households (counted as self-reported same-sex unmarried-partner households)
- Lesbian couples: 0.6% of all households
- Gay men: 0.3% of all households
People in group quarters in Carlisle in 2010:
- 1,760 people in college/university student housing
- 344 people in nursing facilities/skilled-nursing facilities
- 91 people in emergency and transitional shelters (with sleeping facilities) for people experiencing homelessness
- 54 people in other noninstitutional facilities
- 15 people in group homes intended for adults
- 11 people in correctional facilities intended for juveniles
- 5 people in residential treatment centers for adults
People in group quarters in Carlisle in 2000:
- 1,660 people in college dormitories (includes college quarters off campus)
- 566 people in nursing homes
- 44 people in homes or halfway houses for drug/alcohol abuse
- 43 people in other noninstitutional group quarters
- 42 people in other group homes
- 14 people in training schools for juvenile delinquents
- 13 people in military barracks, etc.
- 12 people in homes for the mentally retarded
- 9 people in homes for the mentally ill
- 4 people in religious group quarters
Banks with most branches in Carlisle (2011 data):
- Orrstown Bank: North Middleton Branch, Hanover Street Branch, Seven Gables Branch, Stonehedge Branch, Carlisle Events Branch. Info updated 2007/06/29: Bank assets: $1,449.8 mil, Deposits: $1,220.6 mil, headquarters in Shippensburg, PA, negative income in the last year, Commercial Lending Specialization, 22 total offices, Holding Company: Orrstown Financial Services, Inc.
- Farmers and Merchants Trust Company of Chambersburg: 1901 Ritner Highway Branch, Carlisle Crossings Branch, 14-20 North Hanover Street Branch, East High Street Carlisle Branch. Info updated 2009/01/14: Bank assets: $986.3 mil, Deposits: $789.0 mil, headquarters in Chambersburg, PA, positive income, Commercial Lending Specialization, 28 total offices, Holding Company: Franklin Financial Services Corporation
- Manufacturers and Traders Trust Company: Spring Garden Branch, High Street Branch, Stonehedge Branch, Carlisle West Branch. Info updated 2011/08/08: Bank assets: $76,887.1 mil, Deposits: $60,064.2 mil, headquarters in Buffalo, NY, positive income, Commercial Lending Specialization, 808 total offices, Holding Company: M&T Bank Corporation
- Susquehanna Bank: Carlisle Branch, 330 York Road, Walnut Bottom Road Branch. Info updated 2012/02/28: Bank assets: $14,849.0 mil, Deposits: $10,294.4 mil, headquarters in Lititz, PA, positive income, Commercial Lending Specialization, 308 total offices, Holding Company: Susquehanna Bancshares, Inc.
- Sovereign Bank, National Association: Penrose Place Branch, Carlisle Branch, North Middleton Branch. Info updated 2012/01/31: Bank assets: $78,146.9 mil, Deposits: $48,042.9 mil, headquarters in Wilmington, DE, positive income, Commercial Lending Specialization, 718 total offices, Holding Company: Banco Santander, S.A.
- Metro Bank: Carlisle Branch at 65 Ashland Avenue, branch established on 1998/08/22; Carlisle Commons Branch at 20 Noble Boulevard,, branch established on 2002/12/14. Info updated 2009/09/09: Bank assets: $2,417.8 mil, Deposits: $2,091.3 mil, headquarters in Lemoyne, PA, positive income, Commercial Lending Specialization, 33 total offices, Holding Company: Metro Bancorp, Inc.
- Citizens Bank of Pennsylvania: Carlisle Branch at 665 North East Street, branch established on 1956/05/14. Info updated 2010/09/24: Bank assets: $32,316.9 mil, Deposits: $25,297.1 mil, headquarters in Philadelphia, PA, positive income, 396 total offices, Holding Company: Uk Financial Investments Limited
- PNC Bank, National Association: Carlisle Branch at 105 Noble Boulevard, branch established on 1965/06/08. Info updated 2012/03/20: Bank assets: $263,309.6 mil, Deposits: $197,343.0 mil, headquarters in Wilmington, DE, positive income, Commercial Lending Specialization, 3085 total offices, Holding Company: Pnc Financial Services Group, Inc., The
- Woodforest National Bank: Carlisle Wal-Mart Branch at 60 Noble Boulevard, branch established on 2007/05/12. Info updated 2011/05/10: Bank assets: $3,488.9 mil, Deposits: $3,097.6 mil, headquarters in Houston, TX, positive income, Commercial Lending Specialization, 766 total offices, Holding Company: Woodforest Financial Group Employee Stock Ownership Plan (With 401(K) Provisions)
For population 15 years and over in Carlisle:
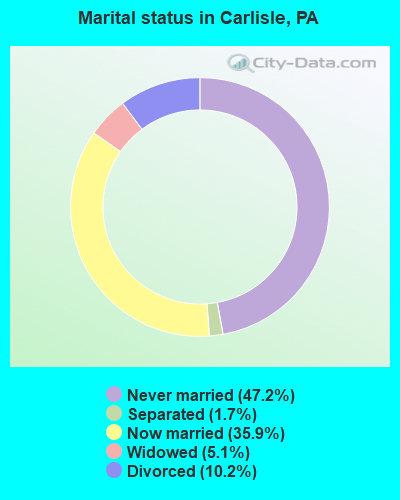
- Never married: 47.2%
- Now married: 35.9%
- Separated: 1.7%
- Widowed: 5.1%
- Divorced: 10.2%
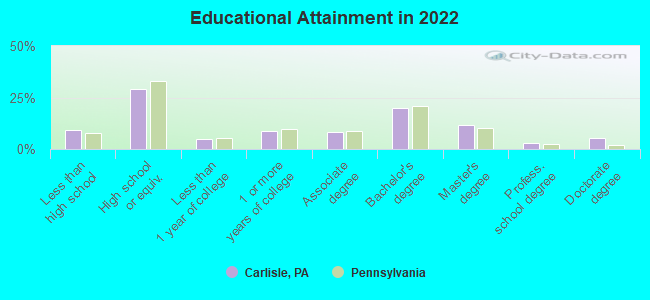
For population 25 years and over in Carlisle:
- High school or higher: 91.1%
- Bachelor's degree or higher: 38.4%
- Graduate or professional degree: 16.7%
- Unemployed: 7.2%
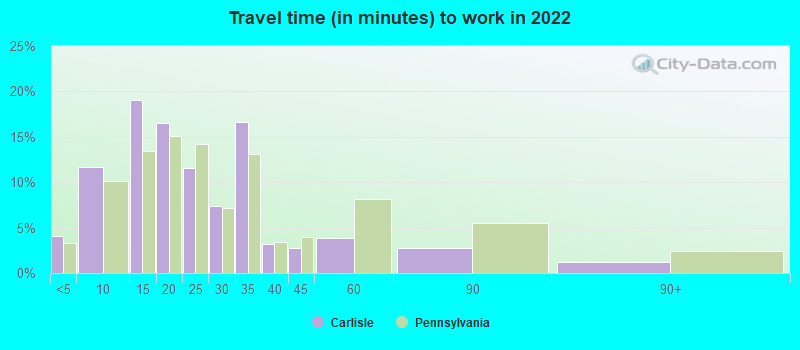
- Mean travel time to work (commute): 14.3 minutes
| Here: | 13.7 |
| Pennsylvania average: | 11.4 |

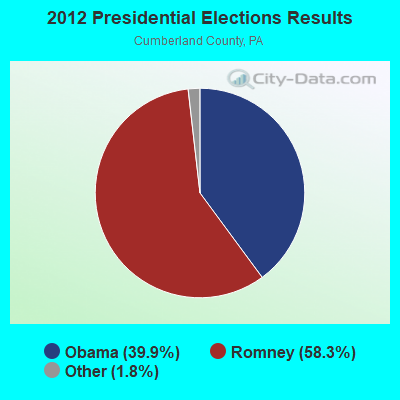
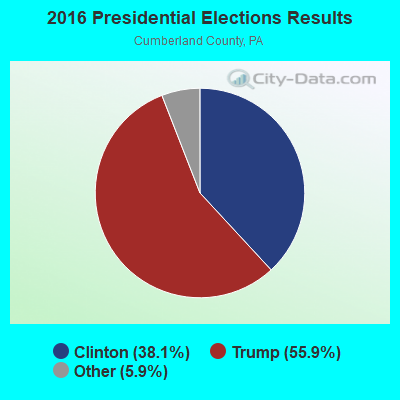
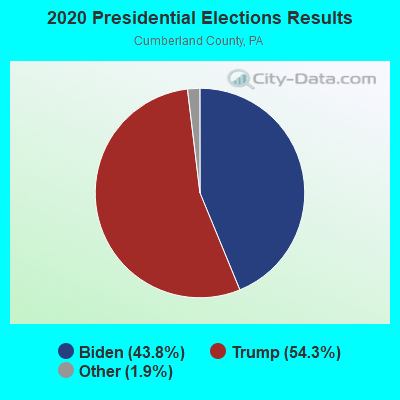
Graphs represent county-level data. Detailed 2008 Election Results
Religion statistics for Carlisle, PA (based on Cumberland County data)
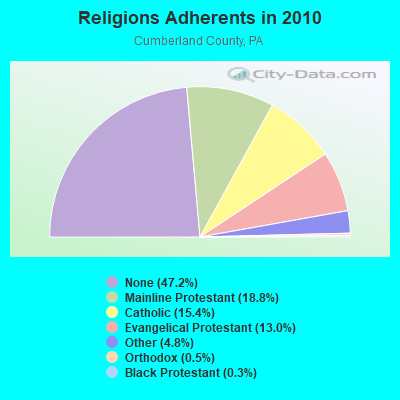
| Religion | Adherents | Congregations |
|---|---|---|
| Mainline Protestant | 44,228 | 106 |
| Catholic | 36,186 | 8 |
| Evangelical Protestant | 30,598 | 148 |
| Other | 11,324 | 17 |
| Orthodox | 1,241 | 4 |
| Black Protestant | 605 | 5 |
| None | 111,224 | - |
Food Environment Statistics:
| Cumberland County: | 1.80 / 10,000 pop. |
| State: | 2.04 / 10,000 pop. |
| This county: | 0.13 / 10,000 pop. |
| State: | 0.09 / 10,000 pop. |
| Cumberland County: | 0.53 / 10,000 pop. |
| Pennsylvania: | 0.88 / 10,000 pop. |
| This county: | 2.64 / 10,000 pop. |
| Pennsylvania: | 2.52 / 10,000 pop. |
| Cumberland County: | 7.75 / 10,000 pop. |
| Pennsylvania: | 7.12 / 10,000 pop. |
| This county: | 10.1% |
| Pennsylvania: | 9.1% |
| This county: | 25.6% |
| State: | 27.2% |
| Cumberland County: | 12.8% |
| Pennsylvania: | 11.5% |
Health and Nutrition:
| Carlisle: | 50.9% |
| Pennsylvania: | 50.2% |
| Carlisle: | 48.4% |
| State: | 47.1% |
| Carlisle: | 28.6 |
| State: | 28.7 |
| This city: | 20.4% |
| Pennsylvania: | 20.8% |
| Carlisle: | 12.2% |
| State: | 10.9% |
| Here: | 6.9 |
| Pennsylvania: | 6.8 |
| Carlisle: | 32.9% |
| State: | 34.3% |
| Carlisle: | 57.2% |
| Pennsylvania: | 56.2% |
| This city: | 78.4% |
| Pennsylvania: | 78.3% |
More about Health and Nutrition of Carlisle, PA Residents
| Local government employment and payroll (March 2022) | |||||
| Function | Full-time employees | Monthly full-time payroll | Average yearly full-time wage | Part-time employees | Monthly part-time payroll |
|---|---|---|---|---|---|
| Police Protection - Officers | 30 | $213,793 | $85,517 | 0 | $0 |
| Sewerage | 21 | $121,705 | $69,546 | 0 | $0 |
| Water Supply | 13 | $74,391 | $68,669 | 0 | $0 |
| Streets and Highways | 10 | $52,909 | $63,491 | 0 | $0 |
| Financial Administration | 9 | $47,301 | $63,068 | 1 | $1,571 |
| Parks and Recreation | 7 | $30,935 | $53,031 | 5 | $2,318 |
| Other and Unallocable | 4 | $20,954 | $62,862 | 5 | $5,271 |
| Other Government Administration | 3 | $29,267 | $117,068 | 0 | $0 |
| Solid Waste Management | 2 | $10,285 | $61,710 | 0 | $0 |
| Police - Other | 2 | $9,006 | $54,036 | 3 | $2,894 |
| Firefighters | 0 | $0 | 2 | $6,361 | |
| Totals for Government | 101 | $610,544 | $72,540 | 16 | $18,415 |
Carlisle government finances - Expenditure in 2018 (per resident):
- Construction - Regular Highways: $1,116,000 ($50.26)
Parks and Recreation: $615,000 ($27.70)
Sewerage: $516,000 ($23.24)
Water Utilities: $178,000 ($8.02)
General Public Buildings: $27,000 ($1.22)
- Current Operations - Sewerage: $4,093,000 ($184.34)
Police Protection: $3,335,000 ($150.20)
Water Utilities: $2,879,000 ($129.67)
General - Other: $2,230,000 ($100.44)
Parks and Recreation: $1,660,000 ($74.76)
Regular Highways: $1,313,000 ($59.14)
Housing and Community Development: $1,274,000 ($57.38)
Local Fire Protection: $870,000 ($39.18)
Solid Waste Management: $820,000 ($36.93)
Parking Facilities: $514,000 ($23.15)
Natural Resources - Other: $429,000 ($19.32)
Protective Inspection and Regulation - Other: $312,000 ($14.05)
Financial Administration: $180,000 ($8.11)
Judicial and Legal Services: $72,000 ($3.24)
Central Staff Services: $66,000 ($2.97)
General Public Buildings: $24,000 ($1.08)
Health - Other: $22,000 ($0.99)
- General - Interest on Debt: $654,000 ($29.46)
- Other Capital Outlay - Local Fire Protection: $1,228,000 ($55.31)
Sewerage: $804,000 ($36.21)
Water Utilities: $747,000 ($33.64)
Regular Highways: $297,000 ($13.38)
Police Protection: $76,000 ($3.42)
Parks and Recreation: $22,000 ($0.99)
Central Staff Services: $13,000 ($0.59)
- Total Salaries and Wages: $7,531,000 ($339.19)
Carlisle government finances - Revenue in 2018 (per resident):
- Charges - Sewerage: $6,822,000 ($307.26)
Solid Waste Management: $806,000 ($36.30)
Parking Facilities: $681,000 ($30.67)
Other: $575,000 ($25.90)
Parks and Recreation: $224,000 ($10.09)
Regular Highways: $16,000 ($0.72)
- Federal Intergovernmental - Housing and Community Development: $345,000 ($15.54)
Other: $285,000 ($12.84)
- Local Intergovernmental - Other: $1,694,000 ($76.30)
- Miscellaneous - General Revenue - Other: $1,066,000 ($48.01)
Donations From Private Sources: $210,000 ($9.46)
Fines and Forfeits: $147,000 ($6.62)
Interest Earnings: $142,000 ($6.40)
Rents: $65,000 ($2.93)
Sale of Property: $22,000 ($0.99)
- Revenue - Water Utilities: $4,405,000 ($198.40)
- State Intergovernmental - Other: $1,035,000 ($46.62)
Highways: $523,000 ($23.56)
General Local Government Support: $14,000 ($0.63)
- Tax - Property: $5,006,000 ($225.47)
Individual Income: $2,023,000 ($91.11)
Occupation and Business License - Other: $757,000 ($34.09)
Documentary and Stock Transfer: $332,000 ($14.95)
Public Utility License: $295,000 ($13.29)
Amusements Sales: $72,000 ($3.24)
Carlisle government finances - Debt in 2018 (per resident):
- Long Term Debt - Outstanding Unspecified Public Purpose: $35,895,000 ($1616.67)
Issue, Unspecified Public Purpose: $29,604,000 ($1333.33)
Beginning Outstanding - Unspecified Public Purpose: $25,005,000 ($1126.20)
Retired Unspecified Public Purpose: $18,714,000 ($842.86)
Carlisle government finances - Cash and Securities in 2018 (per resident):
- Bond Funds - Cash and Securities: $5,251,000 ($236.50)
- Other Funds - Cash and Securities: $36,321,000 ($1635.86)
7.10% of this county's 2021 resident taxpayers lived in other counties in 2020 ($59,936 average adjusted gross income)
| Here: | 7.10% |
| Pennsylvania average: | 5.27% |
0.04% of residents moved from foreign countries ($587 average AGI)
Cumberland County: 0.04% Pennsylvania average: 0.01%
Top counties from which taxpayers relocated into this county between 2020 and 2021:
| from Dauphin County, PA | |
| from York County, PA | |
| from Franklin County, PA |
6.20% of this county's 2020 resident taxpayers moved to other counties in 2021 ($69,359 average adjusted gross income)
| Here: | 6.20% |
| Pennsylvania average: | 5.44% |
0.05% of residents moved to foreign countries ($979 average AGI)
Cumberland County: 0.05% Pennsylvania average: 0.01%
Top counties to which taxpayers relocated from this county between 2020 and 2021:
| to Dauphin County, PA | |
| to York County, PA | |
| to Franklin County, PA |
| Businesses in Carlisle, PA | ||||
| Name | Count | Name | Count | |
|---|---|---|---|---|
| AT&T | 1 | McDonald's | 4 | |
| Advance Auto Parts | 1 | Motel 6 | 2 | |
| Applebee's | 1 | New Balance | 1 | |
| Arby's | 2 | Nike | 2 | |
| AutoZone | 1 | OfficeMax | 1 | |
| Bath & Body Works | 1 | Old Navy | 1 | |
| Best Western | 1 | Panera Bread | 1 | |
| Blockbuster | 1 | Papa John's Pizza | 1 | |
| Burger King | 1 | Penske | 2 | |
| CVS | 2 | PetSmart | 1 | |
| Carson Pirie Scott | 1 | Pier 1 Imports | 1 | |
| Comfort Suites | 1 | Pizza Hut | 1 | |
| Cracker Barrel | 1 | Quality | 1 | |
| Curves | 1 | Quiznos | 1 | |
| Dairy Queen | 1 | RadioShack | 1 | |
| Days Inn | 1 | Red Robin | 1 | |
| Dennys | 1 | Red Roof Inn | 1 | |
| Domino's Pizza | 1 | Rite Aid | 3 | |
| Dunkin Donuts | 3 | Rodeway Inn | 1 | |
| Econo Lodge | 1 | SAS Shoes | 1 | |
| FedEx | 13 | Sleep Inn | 1 | |
| Ford | 1 | Sprint Nextel | 2 | |
| GNC | 1 | Staples | 1 | |
| GameStop | 2 | Starbucks | 2 | |
| Giant | 1 | Subway | 5 | |
| H&R Block | 2 | Super 8 | 2 | |
| Hilton | 1 | T-Mobile | 3 | |
| Home Depot | 1 | T.J.Maxx | 1 | |
| Howard Johnson | 1 | Taco Bell | 1 | |
| Jones New York | 1 | Target | 1 | |
| KFC | 1 | The Room Place | 1 | |
| Kincaid | 1 | Travelodge | 1 | |
| Kmart | 1 | U-Haul | 3 | |
| Kohl's | 1 | UPS | 9 | |
| Kroger | 1 | Verizon Wireless | 2 | |
| Little Caesars Pizza | 1 | Waffle House | 1 | |
| Lowe's | 1 | Walmart | 1 | |
| Marriott | 1 | Wendy's | 2 | |
| MasterBrand Cabinets | 5 | YMCA | 1 | |
Strongest AM radio stations in Carlisle:
- WHYL (960 AM; 5 kW; CARLISLE, PA; Owner: CITADEL BROADCASTING COMPANY)
- WIOO (1000 AM; daytime; 1 kW; CARLISLE, PA; Owner: WIOO RADIO INC.)
- WHP (580 AM; 5 kW; HARRISBURG, PA; Owner: CLEAR CHANNEL BROADCASTING LICENSES, INC.)
- WCBM (680 AM; 50 kW; BALTIMORE, MD; Owner: WCBM MARYLAND, INC.)
- WWII (720 AM; daytime; 2 kW; SHIREMANSTOWN, PA; Owner: HENSLEY BROADCASTING)
- WTKT (1460 AM; 5 kW; HARRISBURG, PA; Owner: CLEAR CHANNEL BROADCASTING LICENSES, INC.)
- WBAL (1090 AM; 50 kW; BALTIMORE, MD; Owner: HEARST RADIO, INC.)
- WGOP (700 AM; daytime; 25 kW; WALKERSVILLE, MD; Owner: BIRACH BROADCASTING CORPORATION)
- WMET (1150 AM; 50 kW; GAITHERSBURG, MD; Owner: BELTWAY ACQUISITION CORPORATION)
- WWLG (1370 AM; 50 kW; BALTIMORE, MD; Owner: M-10 BROADCASTING, INC.)
- WSBA (910 AM; 5 kW; YORK, PA; Owner: WSBA LICO, INC.)
- WVCH (740 AM; 50 kW; CHESTER, PA; Owner: WVCH COMMUNICATIONS, INC.)
- WWJZ (640 AM; 50 kW; MOUNT HOLLY, NJ; Owner: ABC, INC.)
Strongest FM radio stations in Carlisle:
- WDCV-FM (88.3 FM; CARLISLE, PA; Owner: TRUSTEES OF DICKINSON COLLEGE)
- WRKZ-FM (102.3 FM; CARLISLE, PA; Owner: CITADEL BROADCASTING COMPANY)
- WITF-FM (89.5 FM; HARRISBURG, PA; Owner: WITF, INC.)
- WJAZ (91.7 FM; SUMMERDALE, PA; Owner: TEMPLE UNIV. COMMWEALTH SYS. HGHR ED)
- WJUN-FM (92.5 FM; MEXICO, PA; Owner: STARVIEW MEDIA, INC.)
- WNNK-FM (104.1 FM; HARRISBURG, PA; Owner: CUMULUS LICENSING CORP.)
- WRBT (94.9 FM; HARRISBURG, PA; Owner: CLEAR CHANNEL BROADCASTING LICENSES, INC.)
- WHKF (99.3 FM; HARRISBURG, PA; Owner: CLEAR CHANNEL BROADCASTING LICENSES, INC.)
- WTPA (93.5 FM; MECHANICSBURG, PA; Owner: CUMULUS LICENSING CORP.)
- WRVV (97.3 FM; HARRISBURG, PA; Owner: CLEAR CHANNEL BROADCASTING LICENSES, INC.)
- WQLV (98.9 FM; MILLERSBURG, PA; Owner: HEPCO COMMUNICATIONS, INC.)
- WHBO (92.7 FM; STARVIEW, PA; Owner: HALL COMMUNICATIONS, INC.)
- WQJU (107.1 FM; MIFFLINTOWN, PA; Owner: CENTRAL PA CHRISTIAN INSTITUTE, INC.)
- WJRC (90.9 FM; LEWISTOWN, PA; Owner: SALT AND LIGHT MEDIA MINISTRIES, INC)
- WROZ (101.3 FM; LANCASTER, PA; Owner: HALL COMMUNICATIONS, INC.)
- WARM-FM (103.3 FM; YORK, PA; Owner: WSBA LICO, INC.)
- WLZS (106.1 FM; BEAVER SPRINGS, PA; Owner: STARVIEW MEDIA, INC)
- WYCR (98.5 FM; YORK-HANOVER, PA; Owner: RADIO HANOVER, INC.)
- WXMJ (99.5 FM; MOUNT UNION, PA; Owner: MEGAHERTZ LICENSES, LLC)
- WAYZ-FM (104.7 FM; HAGERSTOWN, MD; Owner: HJV LIMITED PARTNERSHIP)
TV broadcast stations around Carlisle:
- WHTM-TV (Channel 27; HARRISBURG, PA; Owner: HARRISBURG TELEVISION, INC.)
- WITF-TV (Channel 33; HARRISBURG, PA; Owner: WITF, INC.)
- WHP-TV (Channel 21; HARRISBURG, PA; Owner: CLEAR CHANNEL BROADCASTING LICENSES, INC.)
- WPMT (Channel 43; YORK, PA; Owner: TRIBUNE TELEVISION COMPANY)
- WLYH-TV (Channel 15; LANCASTER, PA; Owner: TELEVISION STATION GROUP LICENSE SUBSIDIARY, LLC)
- WGAL (Channel 8; LANCASTER, PA; Owner: WGAL HEARST-ARGYLE TELEVISION, INC.)
- W40AF (Channel 40; DILLSBURG, PA; Owner: PENNSYLVANIA SPORTS ENTERTAINMENT NETWORK, LLC)
- W12CA (Channel 12; ELLIOTTSBURG, PA; Owner: HEIRLOOM MINISTRIES, INC.)
Medal of Honor Recipients
Medal of Honor Recipients born in Carlisle: Jacob Cart, Jay Jr. Zeamer.
- National Bridge Inventory (NBI) Statistics
- 73Number of bridges
- 390ft / 119mTotal length
- $5,333,000Total costs
- 907,779Total average daily traffic
- 222,215Total average daily truck traffic
- New bridges - historical statistics
- 11940-1949
- 41950-1959
- 431960-1969
- 21970-1979
- 21980-1989
- 11990-1999
- 202010-2019
FCC Registered Commercial Land Mobile Towers: 3 (See the full list of FCC Registered Commercial Land Mobile Towers in Carlisle, PA)
FCC Registered Broadcast Land Mobile Towers: 62 (See the full list of FCC Registered Broadcast Land Mobile Towers)
FCC Registered Microwave Towers: 42 (See the full list of FCC Registered Microwave Towers in this town)
FCC Registered Paging Towers: 6 (See the full list of FCC Registered Paging Towers)
FCC Registered Maritime Coast & Aviation Ground Towers: 1 (See the full list of FCC Registered Maritime Coast & Aviation Ground Towers)
FCC Registered Amateur Radio Licenses: 293 (See the full list of FCC Registered Amateur Radio Licenses in Carlisle)
FAA Registered Aircraft: 34 (See the full list of FAA Registered Aircraft in Carlisle)
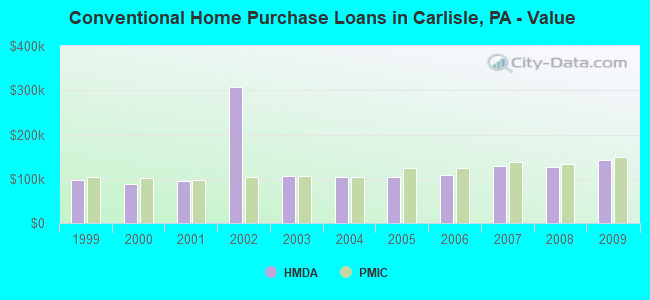
| Home Mortgage Disclosure Act Aggregated Statistics For Year 2009 (Based on 5 full tracts) | ||||||||||||||
| A) FHA, FSA/RHS & VA Home Purchase Loans | B) Conventional Home Purchase Loans | C) Refinancings | D) Home Improvement Loans | E) Loans on Dwellings For 5+ Families | F) Non-occupant Loans on < 5 Family Dwellings (A B C & D) | G) Loans On Manufactured Home Dwelling (A B C & D) | ||||||||
|---|---|---|---|---|---|---|---|---|---|---|---|---|---|---|
| Number | Average Value | Number | Average Value | Number | Average Value | Number | Average Value | Number | Average Value | Number | Average Value | Number | Average Value | |
| LOANS ORIGINATED | 86 | $143,512 | 107 | $141,944 | 285 | $144,839 | 37 | $74,162 | 9 | $2,061,111 | 49 | $146,551 | 1 | $21,000 |
| APPLICATIONS APPROVED, NOT ACCEPTED | 2 | $106,000 | 0 | $0 | 24 | $133,333 | 5 | $14,200 | 1 | $11,000,000 | 0 | $0 | 0 | $0 |
| APPLICATIONS DENIED | 7 | $166,714 | 10 | $87,700 | 77 | $153,935 | 14 | $36,714 | 0 | $0 | 10 | $129,100 | 1 | $36,000 |
| APPLICATIONS WITHDRAWN | 6 | $158,000 | 10 | $149,700 | 65 | $145,708 | 4 | $89,750 | 0 | $0 | 3 | $60,333 | 0 | $0 |
| FILES CLOSED FOR INCOMPLETENESS | 1 | $109,000 | 0 | $0 | 17 | $140,588 | 1 | $244,000 | 1 | $275,000 | 2 | $127,500 | 0 | $0 |
Detailed HMDA statistics for the following Tracts: 0120.00 , 0121.00, 0122.00, 0123.00, 0124.00
| Private Mortgage Insurance Companies Aggregated Statistics For Year 2009 (Based on 5 full tracts) | ||||
| A) Conventional Home Purchase Loans | B) Refinancings | |||
|---|---|---|---|---|
| Number | Average Value | Number | Average Value | |
| LOANS ORIGINATED | 27 | $148,815 | 16 | $155,375 |
| APPLICATIONS APPROVED, NOT ACCEPTED | 6 | $174,167 | 3 | $115,667 |
| APPLICATIONS DENIED | 1 | $97,000 | 0 | $0 |
| APPLICATIONS WITHDRAWN | 0 | $0 | 1 | $203,000 |
| FILES CLOSED FOR INCOMPLETENESS | 0 | $0 | 0 | $0 |
Detailed PMIC statistics for the following Tracts: 0120.00 , 0121.00, 0122.00, 0123.00, 0124.00
2003 - 2018 National Fire Incident Reporting System (NFIRS) incidents
- Fire incident types reported to NFIRS in Carlisle, PA
- 1,98255.8%Structure Fires
- 69719.6%Outside Fires
- 65318.4%Mobile Property/Vehicle Fires
- 2226.2%Other
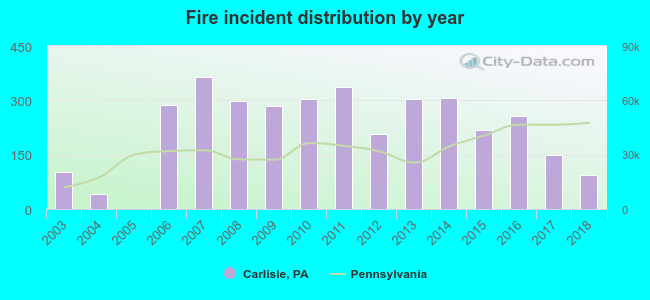 According to the data from the years 2003 - 2018 the average number of fire incidents per year is 222. The highest number of fires - 364 took place in 2007, and the least - 1 in 2005. The data has a decreasing trend.
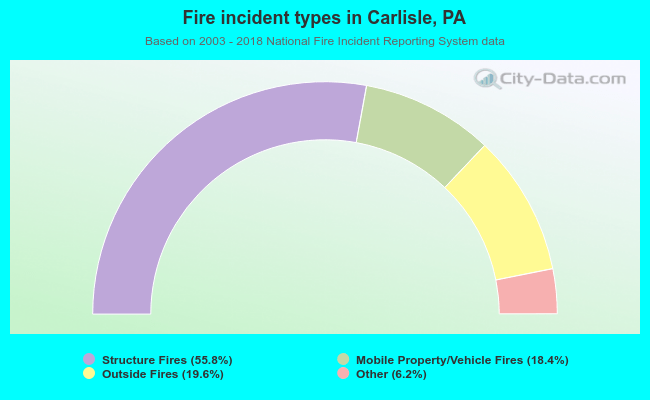 When looking into fire subcategories, the most reports belonged to: Structure Fires (55.8%), and Outside Fires (19.6%).
Fire-safe hotels and motels in Carlisle, Pennsylvania:
- Days Inn & Suites Carlisle, 101 Alexander Spring Rd, Carlisle, Pennsylvania 17013 , Phone: (717) 258-4147, Fax: (717) 258-1207
- Econo Lodge - Carlisle, 1460 Harrisburg Pike, Carlisle, Pennsylvania 17013 , Phone: (717) 249-7775, Fax: (717) 249-4457
- Rodeway Inn, 1239 Harrisburg Pike, Carlisle, Pennsylvania 17013 , Phone: (717) 249-2800, Fax: (717) 249-9444
- Days Inn Carlisle North, 1825 Harrisburg Pike, Carlisle, Pennsylvania 17015 , Phone: (717) 245-2242, Fax: (717) 258-4881
- Sleep Inn Carlisle, 5 E Garland Dr, Carlisle, Pennsylvania 17013 , Phone: (717) 249-8863, Fax: (717) 249-8893
- Holiday Inn-Carlisle, 1450 Harrisburg Pike, Carlisle, Pennsylvania 17013 , Phone: (717) 245-2400
- Hotel Carlisle, 1700 Harrisburg Pike, Carlisle, Pennsylvania 17015 , Phone: (717) 243-1717, Fax: (717) 243-6648
- Super 8 Motel, 100 Alexander SPG Rd, Carlisle, Pennsylvania 17013 , Phone: (717) 245-9898
- 13 other hotels and motels
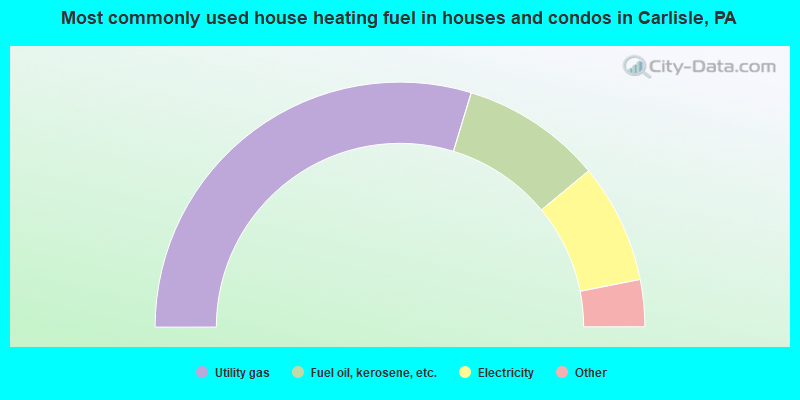
- 59.4%Utility gas
- 18.6%Fuel oil, kerosene, etc.
- 15.8%Electricity
- 2.4%No fuel used
- 2.2%Bottled, tank, or LP gas
- 1.1%Other fuel
- 0.5%Solar energy
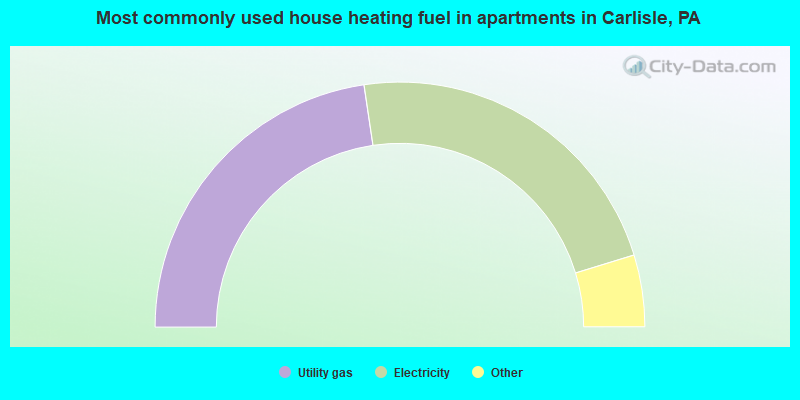
- 45.3%Utility gas
- 45.2%Electricity
- 3.4%Bottled, tank, or LP gas
- 2.5%Fuel oil, kerosene, etc.
- 2.1%Other fuel
- 1.6%No fuel used
Carlisle compared to Pennsylvania state average:
- Unemployed percentage below state average.
- Median age below state average.
- Renting percentage above state average.
- Length of stay since moving in significantly above state average.
- Number of college students above state average.
- Percentage of population with a bachelor's degree or higher above state average.
Carlisle on our top lists:
- #63 on the list of "Top 101 cities with the most residents born in Bosnia and Herzegovina (population 500+)"
- #15 on the list of "Top 101 counties with the largest number of people without health insurance coverage in 2000 (pop. 50,000+)"
- #28 on the list of "Top 101 counties with the largest increase in the number of births per 1000 residents 2000-2006 to 2007-2013 (pop 50,000+)"
- #36 on the list of "Top 101 counties with the highest Particulate Matter (PM2.5) Annual air pollution readings in 2012 (µg/m3)"
- #81 on the list of "Top 101 counties with the lowest number of births per 1000 residents 2007-2013"
- #97 on the list of "Top 101 counties with the most Mainline Protestant adherents"

|
|
Total of 146 patent applications in 2008-2024.