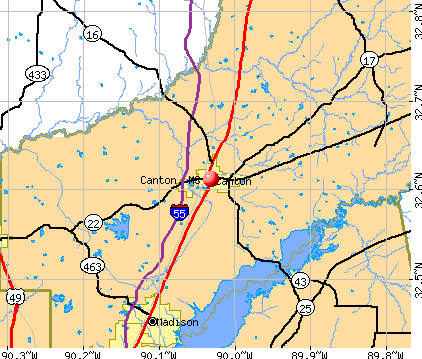
Canton, Mississippi

Canton

Canton: The Old Madison County, Mississippi Court House
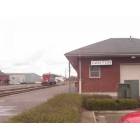
Canton: Canton's Train Station
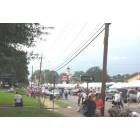
Canton: Canton, Mississippi Flea Market
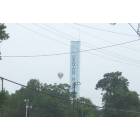
Canton: Canton's historic water tank with a hot air balloon in the back ground
- add
your
Submit your own pictures of this city and show them to the world
- OSM Map
- General Map
- Google Map
- MSN Map
Population change since 2000: -16.8%
 |
| Males: 5,394 | |
| Females: 5,350 |
| Median resident age: | 36.0 years |
| Mississippi median age: | 38.9 years |
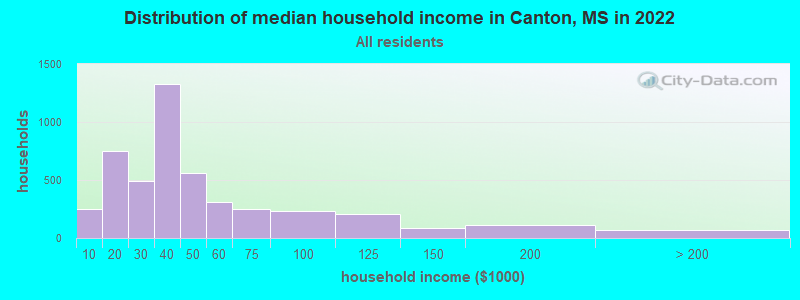
| Canton: | $32,288 |
| MS: | $52,719 |
Estimated per capita income in 2022: $20,299 (it was $12,643 in 2000)
Canton city income, earnings, and wages data
Estimated median house or condo value in 2022: $119,766 (it was $52,200 in 2000)
| Canton: | $119,766 |
| MS: | $162,500 |
Mean prices in 2022: all housing units: $294,002; detached houses: $293,520; townhouses or other attached units: $153,520; mobile homes: $42,664
Median gross rent in 2022: $890.
(14.6% for White Non-Hispanic residents, 33.6% for Black residents, 42.6% for Hispanic or Latino residents, 85.9% for two or more races residents)
Detailed information about poverty and poor residents in Canton, MS
Compare current foreclosures in Canton, MS:
| Photo | Address | Area | Beds / Baths | Price | Details |
|---|---|---|---|---|---|

|
#1
Dunston Dr
Canton, MS 39046
|
3,504 sq. feet
|
7 baths 3 beds |
show details | |

|
#2
Katherine Dr
Canton, MS 39046
|
2,971 sq. feet
|
3 baths 4 beds |
show details | |

|
#3
Rankin Rd
Canton, MS 39046
|
1,451 sq. feet
|
2 baths 4 beds |
show details | |

|
#4
E Peace St
Canton, MS 39046
|
1,525 sq. feet
|
- baths 3 beds |
show details | |

|
#5
George Washington Ave
Canton, MS 39046
|
1,120 sq. feet
|
- baths 3 beds |
show details | |

|
#6
Singleton St
Canton, MS 39046
|
798 sq. feet
|
- baths 3 beds |
show details | |

|
#7
E Fulton St
Canton, MS 39046
|
1,058 sq. feet
|
- baths 3 beds |
show details | |

|
#8
Yandell Rd
Canton, MS 39046
|
1,700 sq. feet
|
- baths 3 beds |
show details | |

|
#9
Highway 43 N
Canton, MS 39046
|
1,680 sq. feet
|
- baths 3 beds |
show details | |

|
#10
Boyd St
Canton, MS 39046
|
1,232 sq. feet
|
- baths 2 beds |
show details |
| Photo | Address | Area | Beds / Baths | Price | Details |
|---|---|---|---|---|---|

|
#11
John Day Rd
Canton, MS 39046
|
1,188 sq. feet
|
- baths 3 beds |
show details | |

|
#12
Lee St
Canton, MS 39046
|
1,100 sq. feet
|
- baths 2 beds |
show details | |

|
#13
N Old Canton Rd
Canton, MS 39046
|
624 sq. feet
|
- baths 1 beds |
show details | |

|
#14
Dobson Ave
Canton, MS 39046
|
1,168 sq. feet
|
- baths 3 beds |
show details | |

|
#15
Miggins Rd
Canton, MS 39046
|
1,080 sq. feet
|
- baths 3 beds |
show details | |

|
#16
Willie Burrell Dr
Canton, MS 39046
|
1,361 sq. feet
|
- baths 3 beds |
show details | |

|
#17
Willie Burrell Dr
Canton, MS 39046
|
1,248 sq. feet
|
- baths 5 beds |
show details | |

|
#18
Jade Cv
Canton, MS 39046
|
1,268 sq. feet
|
- baths 3 beds |
show details | |

|
#19
Way Rd
Canton, MS 39046
|
954 sq. feet
|
- baths 3 beds |
show details | |

|
#20
Old Highway 16
Canton, MS 39046
|
704 sq. feet
|
- baths 6 beds |
show details |
| Photo | Address | Area | Beds / Baths | Price | Details |
|---|---|---|---|---|---|

|
#21
E Academy St
Canton, MS 39046
|
1,656 sq. feet
|
- baths 3 beds |
show details | |

|
#22
Cleo Clark Rd
Canton, MS 39046
|
1,008 sq. feet
|
- baths 2 beds |
show details | |

|
#23
Pat Luckett Rd
Canton, MS 39046
|
992 sq. feet
|
- baths 2 beds |
show details | |

|
#24
Pisgah Bottom Rd
Canton, MS 39046
|
1,624 sq. feet
|
- baths 3 beds |
show details | |

|
#25
Shady Ln
Canton, MS 39046
|
822 sq. feet
|
- baths 2 beds |
show details | |

|
#26
Nest St
Canton, MS 39046
|
1,270 sq. feet
|
- baths 2 beds |
show details | |

|
#27
N Canal St
Canton, MS 39046
|
888 sq. feet
|
- baths 3 beds |
show details | |

|
#28
Washington St
Canton, MS 39046
|
1,120 sq. feet
|
- baths 3 beds |
show details | |

|
#29
E Dinkins St
Canton, MS 39046
|
1,105 sq. feet
|
- baths 3 beds |
show details | |

|
#30
E Peace St
Canton, MS 39046
|
1,383 sq. feet
|
- baths 3 beds |
show details |
| Photo | Address | Area | Beds / Baths | Price | Details |
|---|---|---|---|---|---|

|
#31
John Day Rd # B
Canton, MS 39046
|
1,054 sq. feet
|
- baths 2 beds |
show details | |

|
#32
Douglas St
Canton, MS 39046
|
1,200 sq. feet
|
- baths 3 beds |
show details | |

|
#33
E Kathy Cir
Canton, MS 39046
|
1,850 sq. feet
|
- baths 3 beds |
show details | |

|
#34
Williams St
Canton, MS 39046
|
1,080 sq. feet
|
- baths 3 beds |
show details | |

|
#35
Willie Burrell Dr
Canton, MS 39046
|
972 sq. feet
|
- baths 3 beds |
show details | |

|
#36
E Center St
Canton, MS 39046
|
1,650 sq. feet
|
- baths 3 beds |
show details | |

|
#37
Sunset Dr
Canton, MS 39046
|
1,684 sq. feet
|
- baths 3 beds |
show details | |

|
#38
W Deerfield Dr
Canton, MS 39046
|
2,030 sq. feet
|
- baths 3 beds |
show details | |

|
#39
E Dinkins St
Canton, MS 39046
|
1,952 sq. feet
|
- baths 3 beds |
show details | |

|
#40
Holmes Hollow Ln
Canton, MS 39046
|
2,640 sq. feet
|
- baths 3 beds |
show details |
| Photo | Address | Area | Beds / Baths | Price | Details |
|---|---|---|---|---|---|

|
#41
E Fulton St
Canton, MS 39046
|
3,164 sq. feet
|
- baths 4 beds |
show details | |

|
#42
Glenfield Rd
Canton, MS 39046
|
2,039 sq. feet
|
- baths 4 beds |
show details | |

|
#43
Movietown Dr
Canton, MS 39046
|
- sq. feet
|
- baths - beds |
show details | |

|
#44
Parkview Dr Apt 251
Canton, MS 39046
|
- sq. feet
|
- baths - beds |
show details | |

|
#45
Cripple Creek Rd
Canton, MS 39046
|
- sq. feet
|
- baths - beds |
show details | |

|
#46
Cedar Green
Canton, MS 39046
|
- sq. feet
|
- baths - beds |
show details | |

|
#47
Old Yazoo City Rd # 631
Canton, MS 39046
|
- sq. feet
|
- baths - beds |
show details | |

|
#48
Dogwood Dr
Canton, MS 39046
|
- sq. feet
|
- baths - beds |
show details | |

|
#49
Doris Francis Blvd
Canton, MS 39046
|
- sq. feet
|
- baths - beds |
show details | |

|
Check over 1 million property listings on Foreclosure.com!
|
browse all offers | |||


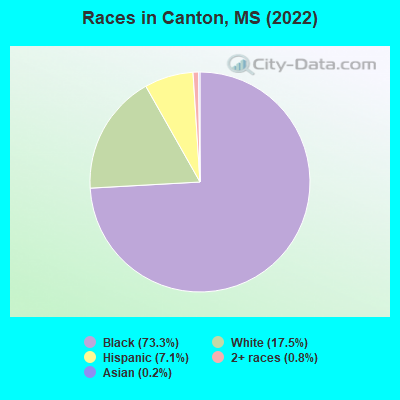
- 7,97473.3%Black alone
- 1,89917.5%White alone
- 7777.1%Hispanic
- 880.8%Two or more races
- 170.2%Asian alone
Races in Canton detailed stats: ancestries, foreign born residents, place of birth
According to our research of Mississippi and other state lists, there were 73 registered sex offenders living in Canton, Mississippi as of June 04, 2024.
The ratio of all residents to sex offenders in Canton is 185 to 1.
Type |
2009 |
|---|---|
| Murders (per 100,000) | 0 (0.0) |
| Rapes (per 100,000) | 9 (72.1) |
| Robberies (per 100,000) | 27 (216.4) |
| Assaults (per 100,000) | 49 (392.8) |
| Burglaries (per 100,000) | 317 (2,541) |
| Thefts (per 100,000) | 187 (1,499) |
| Auto thefts (per 100,000) | 13 (104.2) |
| Arson (per 100,000) | 0 (0.0) |
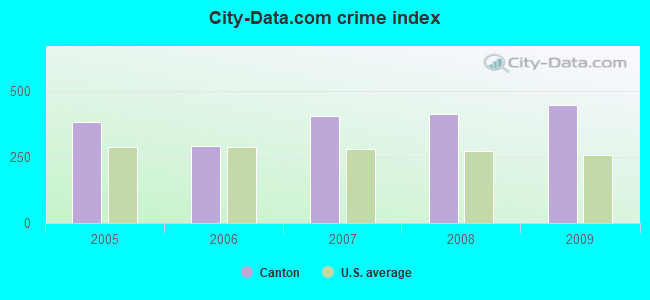
| City-Data.com crime index | 447.3 |
The City-Data.com crime index weighs serious crimes and violent crimes more heavily. Higher means more crime, U.S. average is 246.1. It adjusts for the number of visitors and daily workers commuting into cities.
Crime rate in Canton detailed stats: murders, rapes, robberies, assaults, burglaries, thefts, arson
Full-time law enforcement employees in 2021, including police officers: 35 (23 officers - 19 male; 4 female).
| Officers per 1,000 residents here: | 1.95 |
| Mississippi average: | 2.18 |
 Recent articles from our blog. Our writers, many of them Ph.D. graduates or candidates, create easy-to-read articles on a wide variety of topics.

 | Not just Friday, but Sunday, too, is 'Hell Day', in Madison? (26 replies) |
| TRAPPED, on Colonial Circle (18 replies) |
| Canton mansion tops list of 'Haunted Houses You Can Buy Right Now' (5 replies) |
| Growing Northern Metro (1 reply) |
| Is white flight from Jackson ending? (152 replies) |
| Where to find a nice rental house in Madison near Reunion/Gluckstadt area (19 replies) |
Latest news from Canton, MS collected exclusively by city-data.com from local newspapers, TV, and radio stations
Ancestries: American (2.5%), English (2.5%), Irish (2.5%), Italian (2.4%), German (1.1%).
Current Local Time: CST time zone
Incorporated in 1834
Elevation: 250 feet
Land area: 18.6 square miles.
Population density: 578 people per square mile (low).
263 residents are foreign born (1.7% Latin America, 0.5% Asia).
| This city: | 2.4% |
| Mississippi: | 2.3% |
Median real estate property taxes paid for housing units with mortgages in 2022: $991 (0.7%)
Median real estate property taxes paid for housing units with no mortgage in 2022: $583 (0.6%)
Nearest city with pop. 50,000+: Jackson, MS  (22.5 miles , pop. 184,256).
Nearest city with pop. 200,000+: Baton Rouge, LA (162.7 miles , pop. 227,818).
Nearest city with pop. 1,000,000+: Houston, TX (372.9 miles , pop. 1,953,631).
Nearest cities:
), ), ), Latitude: 32.61 N, Longitude: 90.03 W
Daytime population change due to commuting: +9,593 (+86.1%)
Workers who live and work in this city: 2,541 (53.4%)
Area code: 601

Canton, Mississippi accommodation & food services, waste management - Economy and Business Data
Single-family new house construction building permits:
- 2022: 6 buildings, average cost: $200,000
- 2019: 2 buildings, average cost: $276,500
- 2018: 2 buildings, average cost: $276,500
- 2016: 4 buildings, average cost: $216,300
- 2015: 2 buildings, average cost: $80,000
- 2014: 1 building, cost: $40,000
- 2013: 4 buildings, average cost: $207,200
- 2012: 4 buildings, average cost: $140,900
- 2011: 3 buildings, average cost: $190,100
- 2010: 3 buildings, average cost: $97,700
- 2009: 3 buildings, average cost: $97,700
- 2008: 11 buildings, average cost: $143,200
- 2007: 35 buildings, average cost: $141,100
- 2006: 26 buildings, average cost: $107,100
- 2005: 29 buildings, average cost: $127,700
- 2004: 6 buildings, average cost: $133,800
- 2003: 22 buildings, average cost: $21,700
- 2002: 24 buildings, average cost: $69,800
- 2001: 17 buildings, average cost: $124,100
- 2000: 21 buildings, average cost: $116,700
- 1999: 29 buildings, average cost: $66,100
- 1998: 23 buildings, average cost: $50,000
- 1997: 22 buildings, average cost: $50,000
| Here: | 2.0% |
| Mississippi: | 2.6% |
Population change in the 1990s: +263 (+2.1%).
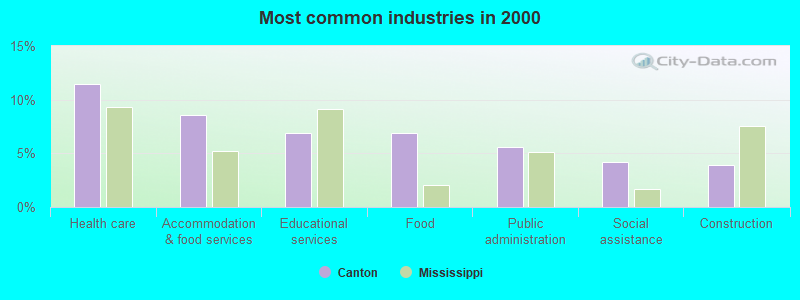
- Health care (11.5%)
- Accommodation & food services (8.6%)
- Educational services (6.9%)
- Food (6.9%)
- Public administration (5.6%)
- Social assistance (4.2%)
- Construction (3.9%)
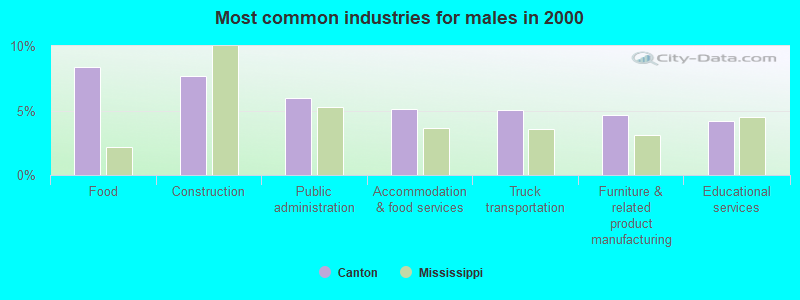
- Food (8.4%)
- Construction (7.6%)
- Public administration (6.0%)
- Accommodation & food services (5.1%)
- Truck transportation (5.0%)
- Furniture & related product manufacturing (4.7%)
- Educational services (4.2%)
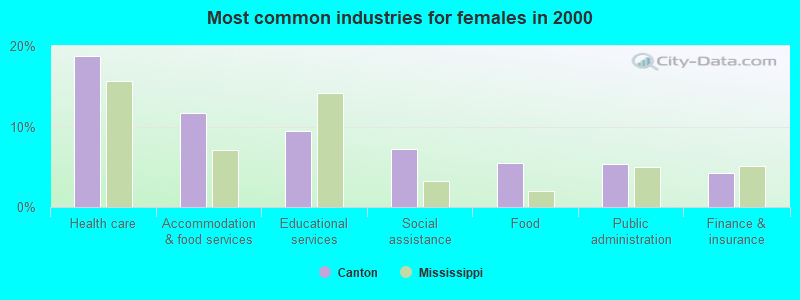
- Health care (18.8%)
- Accommodation & food services (11.7%)
- Educational services (9.4%)
- Social assistance (7.3%)
- Food (5.5%)
- Public administration (5.3%)
- Finance & insurance (4.3%)
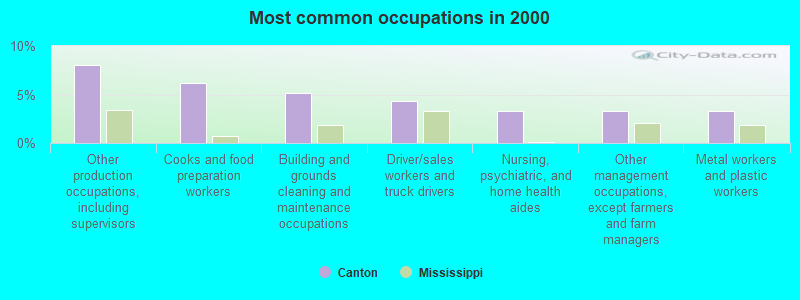
- Other production occupations, including supervisors (8.0%)
- Cooks and food preparation workers (6.2%)
- Building and grounds cleaning and maintenance occupations (5.1%)
- Driver/sales workers and truck drivers (4.4%)
- Nursing, psychiatric, and home health aides (3.3%)
- Other management occupations, except farmers and farm managers (3.3%)
- Metal workers and plastic workers (3.3%)
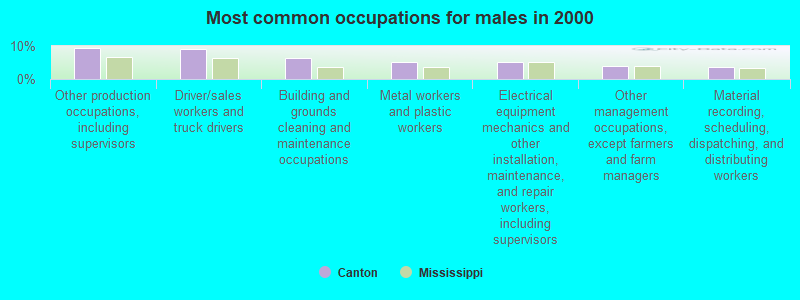
- Other production occupations, including supervisors (9.4%)
- Driver/sales workers and truck drivers (9.1%)
- Building and grounds cleaning and maintenance occupations (6.2%)
- Metal workers and plastic workers (5.3%)
- Electrical equipment mechanics and other installation, maintenance, and repair workers, including supervisors (5.2%)
- Other management occupations, except farmers and farm managers (4.1%)
- Material recording, scheduling, dispatching, and distributing workers (3.7%)
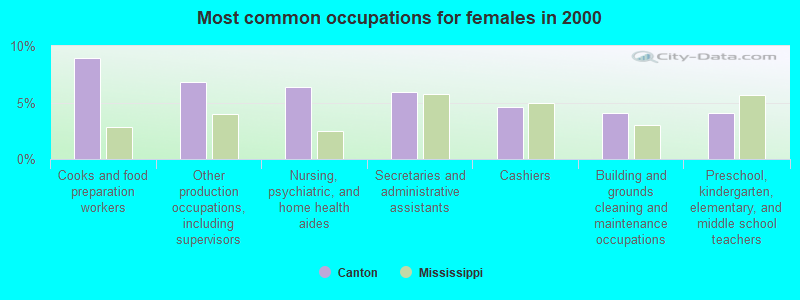
- Cooks and food preparation workers (8.9%)
- Other production occupations, including supervisors (6.8%)
- Nursing, psychiatric, and home health aides (6.4%)
- Secretaries and administrative assistants (5.9%)
- Cashiers (4.6%)
- Building and grounds cleaning and maintenance occupations (4.1%)
- Preschool, kindergarten, elementary, and middle school teachers (4.0%)
Average climate in Canton, Mississippi
Based on data reported by over 4,000 weather stations


|
|

(lower is better)
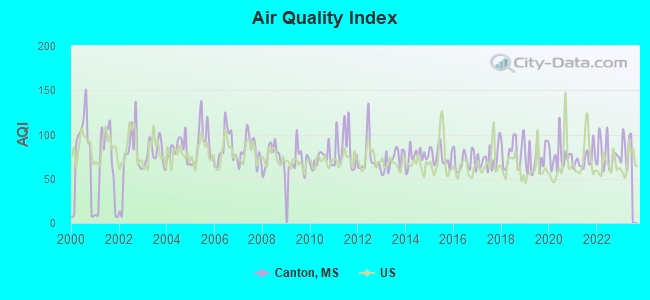
Air Quality Index (AQI) level in 2022 was 77.4. This is about average.
| City: | 77.4 |
| U.S.: | 72.6 |
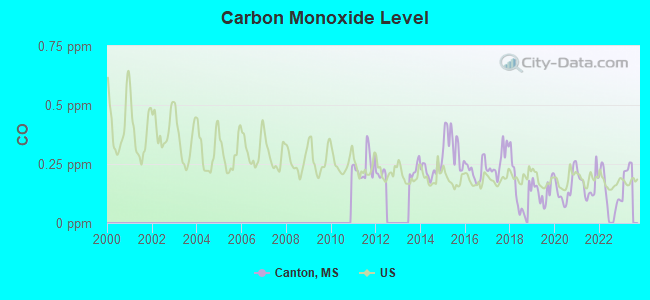
Carbon Monoxide (CO) [ppm] level in 2022 was 0.104. This is significantly better than average. Closest monitor was 16.9 miles away from the city center.
| City: | 0.104 |
| U.S.: | 0.251 |
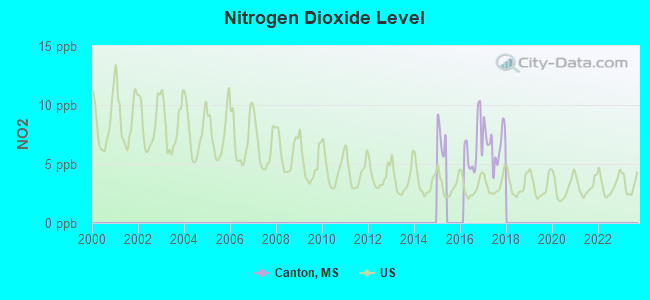
Nitrogen Dioxide (NO2) [ppb] level in 2017 was 6.79. This is worse than average. Closest monitor was 16.9 miles away from the city center.
| City: | 6.79 |
| U.S.: | 5.11 |
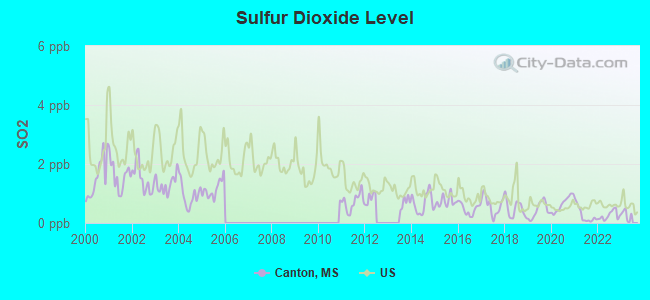
Sulfur Dioxide (SO2) [ppb] level in 2022 was 0.254. This is significantly better than average. Closest monitor was 16.9 miles away from the city center.
| City: | 0.254 |
| U.S.: | 1.515 |
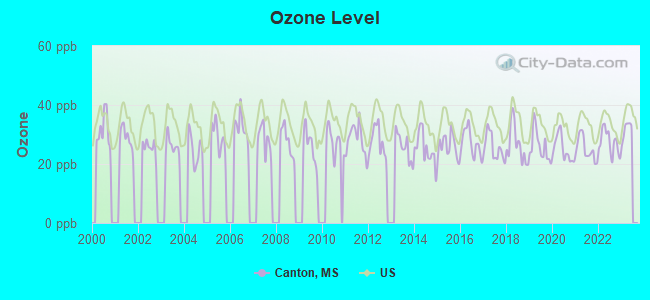
Ozone [ppb] level in 2022 was 27.3. This is better than average. Closest monitor was 11.1 miles away from the city center.
| City: | 27.3 |
| U.S.: | 33.3 |
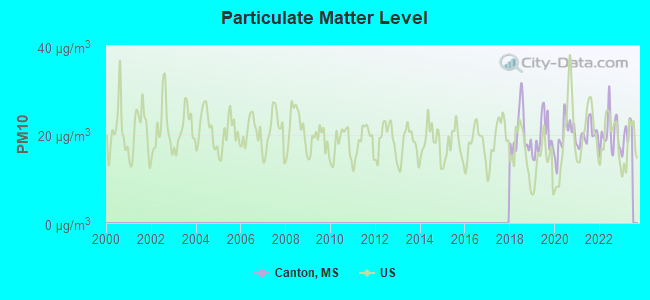
Particulate Matter (PM10) [µg/m3] level in 2022 was 20.0. This is about average. Closest monitor was 21.0 miles away from the city center.
| City: | 20.0 |
| U.S.: | 19.2 |
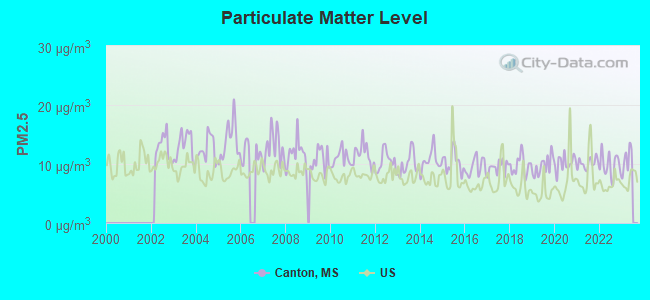
Particulate Matter (PM2.5) [µg/m3] level in 2022 was 9.80. This is worse than average. Closest monitor was 16.9 miles away from the city center.
| City: | 9.80 |
| U.S.: | 8.11 |
Tornado activity:
Canton-area historical tornado activity is slightly above Mississippi state average. It is 157% greater than the overall U.S. average.
On 11/24/2001, a category F4 (max. wind speeds 207-260 mph) tornado 3.1 miles away from the Canton city center killed 2 people and injured 21 people and caused $12 million in damages.
On 3/29/1976, a category F4 tornado 11.2 miles away from the city center killed 3 people and injured 177 people and caused between $5,000,000 and $50,000,000 in damages.
Earthquake activity:
Canton-area historical earthquake activity is significantly above Mississippi state average. It is 214% greater than the overall U.S. average.On 1/18/1999 at 07:00:53, a magnitude 4.8 (4.8 MB, 4.0 LG, Depth: 0.6 mi, Class: Light, Intensity: IV - V) earthquake occurred 170.1 miles away from the city center
On 3/25/1976 at 00:41:20, a magnitude 5.0 (4.9 MB, 5.0 LG, Class: Moderate, Intensity: VI - VII) earthquake occurred 209.9 miles away from the city center
On 10/24/1997 at 08:35:17, a magnitude 4.9 (4.8 MB, 4.2 MS, 4.9 LG, Depth: 6.2 mi) earthquake occurred 192.0 miles away from the city center
On 6/24/1975 at 11:11:36, a magnitude 4.5 (4.5 MB) earthquake occurred 148.2 miles away from the city center
On 11/7/2004 at 11:20:21, a magnitude 4.3 (4.3 MW, Depth: 3.1 mi) earthquake occurred 122.3 miles away from Canton center
On 1/21/1982 at 00:33:54, a magnitude 4.7 (4.5 MB, 4.7 LG, 4.5 LG) earthquake occurred 216.6 miles away from Canton center
Magnitude types: regional Lg-wave magnitude (LG), body-wave magnitude (MB), surface-wave magnitude (MS), moment magnitude (MW)
Natural disasters:
The number of natural disasters in Madison County (17) is near the US average (15).Major Disasters (Presidential) Declared: 14
Emergencies Declared: 2
Causes of natural disasters: Storms: 10, Tornadoes: 10, Floods: 8, Hurricanes: 4, Drought: 1, Freeze: 1, Tropical Storm: 1, Other: 1 (Note: some incidents may be assigned to more than one category).

Hospitals and medical centers in Canton:
- CANTON MANOR (1145 E TISDALE AV BOX 269)
- GUARDIAN ANGEL HOSPICE CARE FOR CHILDREN, INC (514 WEST FULTON STREET)
- MADISON RIVER OAKS MEDICAL CENTER (Proprietary, provides emergency services, 161 RIVER OAKS DRIVE)
- MID DELTA HOSPICE OF CANTON (1150 EAST PEACE STREET)
- PHYSICIAN HOSPICE CARE, LLC (1883 HIGHWAY 43 SOUTH)
- MADISON CO NH (1421-A EAST PEACE STREET/P. O. BOX 488)
- DSI CANTON (620 E. PEACE ST.)
- FMC CANTON (1976 HWY 43 N.)
Airports located in Canton:
- Cloud 9 Airport (7MS4) (Runways: 1)
- Eagle Crest Estates Airport (7MS1) (Runways: 1)
- Pace Airstrip Airport (MS29) (Runways: 1)
- Providence Airpark Airport (4MS9) (Runways: 1)
- Supplejack Airport (MS36) (Runways: 1)
Colleges/universities with over 2000 students nearest to Canton:
- Belhaven University (about 22 miles; Jackson, MS; Full-time enrollment: 3,147)
- Jackson State University (about 25 miles; Jackson, MS; FT enrollment: 7,485)
- Holmes Community College (about 26 miles; Goodman, MS; FT enrollment: 5,352)
- Mississippi College (about 26 miles; Clinton, MS; FT enrollment: 3,919)
- Hinds Community College (about 34 miles; Raymond, MS; FT enrollment: 9,115)
- East Central Community College (about 55 miles; Decatur, MS; FT enrollment: 2,380)
- Mississippi Delta Community College (about 64 miles; Moorhead, MS; FT enrollment: 2,100)
Public high schools in Canton:
- CANTON PUBLIC HIGH SCHOOL (Location: 634 FINNEY ROAD, Grades: 9-12)
- CANTON EDUCATIONAL SERVICES CENTER (Location: 529 N. MACE STREET, Grades: 4-12)
- CANTON CAREER CENTER (Location: 487 NORTH UNION EXTENSION, Grades: 10-12)
Public elementary/middle schools in Canton:
- CANTON ELEMENTARY SCHOOL (Location: 740 EAST ACADEMY STREET, Grades: 2-5)
- MC NEAL ELEMENTARY SCHOOL (Location: 364 MARTIN LUTHER KING DRIVE, Grades: PK-2)
- NICHOLS MIDDLE SCHOOL (Location: 529 NORTH MACE STREET, Grades: 5-8)
- REUBEN B. MYERS CANTON SCHOOL OF AR (Location: 357 OLD YAZOO ROAD, Grades: KG-5)
- HUEY L. PORTER MIDDLE SCHOOL (Location: 551 FINNEY ROAD, Grades: 6-8)
- JIMMIE M. GOODLOE ELEMENTARY SCHOOL (Location: 551 FINNEY ROAD, Grades: KG-5)
- LUTHER BRANSON SCHOOL (Location: 3903 HIGHWAY 16 E, Grades: PK-5)
- NORTHEAST MADISON MIDDLE SCHOOL (Location: 820 SULPHUR SPRINGS ROAD, Grades: 6-8)
- MADISON CROSSING ELEMENTARY (Location: 300 YANDELL ROAD, Grades: KG-5)
Points of interest:
Notable locations in Canton: Canton Fire Department Station 2 (A), Canton Fire Department Station 4 (B), Canton Fire Department Station 1 (C), Canton Fire Department Station 3 (D). Display/hide their locations on the map
Churches in Canton include: Buckhorn Church (A), Mount Able Church (B). Display/hide their locations on the map
Cemeteries: Mount Able Cemetery (1), Canton Cemetery (2). Display/hide their locations on the map
Creeks: Camp Creek (A), Walnut Creek (B), Little Bear Creek (C). Display/hide their locations on the map
Park in Canton: Red Bud Park (1). Display/hide its location on the map
Tourist attractions: Madison County Historical Society (Historical Places & Services; 234 East Fulton Street) (1), Lacour J A & CO LBR (Cultural Attractions- Events- & Facilities; 222 Yandell Avenue) (2), Canton Convention and Visitors Bureau (147 North Union Street) (3). Display/hide their approximate locations on the map
Hotels: Budget Inn (3116 South Liberty Street) (1), Hampton Inn (139 Soldier Colony Road) (2), Holiday Inn Express Hotel & Suites (125 Soldier Colony Road) (3), Days Inn Canton (123 Sidney Runnels) (4), Econo Lodge Canton (119 Soldier Colony Road) (5), Comfort Inn Canton (145 Soldier Colony Road) (6), Best Western Canton Inn (137 Soldier Colony Road) (7). Display/hide their approximate locations on the map
Courts: Madison County - Human Services Department- Youth Court Counselor (103 West Peace Street) (1), Madison County - Justice Court System (2961 South Liberty Street) (2), Madison County - Youth Court Judge (Chancery Building) (3). Display/hide their approximate locations on the map
Birthplace of: William M. Walton - Politician, Earl B. Dickerson - Lawyer, George Doherty - Football player and coach, L. C. Greenwood - Football player, Marvin Hayes - Artist, Ronnie Lester - Basketball player, Scott Field (Texas politician) - Congressman, Clyde X - Member of the Nation of Islam, Rowland Garrett - Basketball player, Hilton Tompkins - College basketball player (Jackson State Tigers).
Drinking water stations with addresses in Canton and their reported violations in the past:
BEAR CREEK W/A-WEST (Population served: 18,133, Groundwater):Past monitoring violations:CITY OF CANTON (Population served: 15,376, Groundwater):
- Monitoring and Reporting (DBP) - Between JUL-2009 and SEP-2009, Contaminant: Chlorine. Follow-up actions: St Public Notif requested (SEP-03-2009), St Formal NOV issued (SEP-03-2009), St Compliance achieved (DEC-31-2009)
- 105 regular monitoring violations
Past health violations:BEAR CREEK W/A -EAST (Population served: 12,717, Groundwater):Past monitoring violations:
- MCL, Monthly (TCR) - In APR-2009, Contaminant: Coliform. Follow-up actions: St Public Notif requested (MAY-05-2009), St Formal NOV issued (MAY-05-2009), St Public Notif received (JUN-05-2009)
- 42 regular monitoring violations
Past health violations:EAST MADISON WATER ASSN-WEST (Population served: 7,648, Groundwater):Past monitoring violations:
- MCL, Monthly (TCR) - In OCT-2005, Contaminant: Coliform. Follow-up actions: St Violation/Reminder Notice (NOV-29-2005), St Public Notif requested (NOV-29-2005)
- 84 regular monitoring violations
Past health violations:CMU - LAKE CAROLINE (Population served: 2,852, Groundwater):Past monitoring violations:
- MCL, Monthly (TCR) - In OCT-2013, Contaminant: Coliform. Follow-up actions: St Compliance achieved (NOV-20-2013)
- MCL, Average - Between JUL-2013 and SEP-2013, Contaminant: Total Haloacetic Acids (HAA5). Follow-up actions: St Formal NOV issued (NOV-15-2013), St Public Notif requested (NOV-15-2013), St Public Notif received (DEC-06-2013), St AO (w/o penalty) issued (APR-25-2014), St Public Notif received (2 times from APR-30-2014 to JUN-30-2014)
- MCL, Monthly (TCR) - In NOV-2010, Contaminant: Coliform. Follow-up actions: St Public Notif requested (DEC-03-2010), St Formal NOV issued (DEC-03-2010), St Compliance achieved (JAN-13-2011), St Public Notif received (JAN-13-2011)
- Monitoring and Reporting (DBP) - Between OCT-2008 and DEC-2008, Contaminant: Chlorine. Follow-up actions: St Formal NOV issued (JAN-29-2009), St Public Notif requested (MAR-01-2009), St Compliance achieved (MAR-31-2009), St Public Notif received (JUN-24-2009)
- 2 minor monitoring violations
- 319 regular monitoring violations
Past monitoring violations:BIG BLACK W/A-CAMDEN (Population served: 1,105, Groundwater):
- Monitoring and Reporting (DBP) - Between OCT-2008 and DEC-2008, Contaminant: Chlorine. Follow-up actions: St Formal NOV issued (JAN-29-2009), St Compliance achieved (MAR-31-2009), St Public Notif received (JUN-30-2009)
- Monitoring and Reporting (DBP) - Between APR-2008 and JUN-2008, Contaminant: Chlorine. Follow-up actions: St Compliance achieved (SEP-30-2008), St Formal NOV issued (JAN-29-2009), St Public Notif received (JUN-30-2009)
- 90 regular monitoring violations
Past health violations:BIG BLACK WATER ASSOCIATION (Population served: 1,063, Groundwater):Past monitoring violations:
- MCL, Average - Between JAN-2010 and MAR-2010, Contaminant: Total Haloacetic Acids (HAA5). Follow-up actions: St Compliance achieved (MAY-20-2010), St Formal NOV issued (JUN-08-2010), St Public Notif requested (JUN-08-2010), St Public Notif received (JUL-06-2010)
- MCL, Average - Between OCT-2009 and DEC-2009, Contaminant: Total Haloacetic Acids (HAA5). Follow-up actions: St Formal NOV issued (MAR-03-2010), St Public Notif requested (MAR-03-2010), St Public Notif received (APR-05-2010), St Compliance achieved (MAY-20-2010)
- MCL, Average - Between JUL-2009 and SEP-2009, Contaminant: Total Haloacetic Acids (HAA5). Follow-up actions: St Formal NOV issued (JAN-07-2010), St Public Notif requested (JAN-07-2010), St Public Notif received (FEB-05-2010), St Compliance achieved (MAY-20-2010)
- MCL, Average - Between JUL-2007 and SEP-2007, Contaminant: Total Haloacetic Acids (HAA5). Follow-up actions: St Compliance achieved (OCT-11-2007), St Violation/Reminder Notice (APR-25-2008), St Public Notif requested (APR-25-2008), St Public Notif received (MAY-16-2008)
- MCL, Average - Between JUL-2007 and SEP-2007, Contaminant: TTHM. Follow-up actions: St Compliance achieved (OCT-11-2007), St Violation/Reminder Notice (APR-25-2008), St Public Notif requested (APR-25-2008), St Public Notif received (MAY-16-2008)
- MCL, Average - Between APR-2007 and JUN-2007, Contaminant: TTHM. Follow-up actions: St Compliance Meeting conducted (JUL-16-2007), St Violation/Reminder Notice (OCT-03-2007), St Public Notif requested (OCT-03-2007), St Compliance achieved (OCT-11-2007), St Public Notif received (OCT-30-2007)
- 15 other older health violations
- 165 regular monitoring violations
Past health violations:CAMERON COMMUNITY WATER SYSTEM (Population served: 554, Groundwater):Past monitoring violations:
- MCL, Average - Between JAN-2012 and MAR-2012, Contaminant: Total Haloacetic Acids (HAA5). Follow-up actions: St Compliance achieved (APR-18-2012), St Formal NOV issued (MAY-18-2012), St Public Notif requested (MAY-18-2012), St Public Notif received (MAY-25-2012), St AO (w/o penalty) issued (JUN-21-2012)
- MCL, Average - Between OCT-2011 and DEC-2011, Contaminant: Total Haloacetic Acids (HAA5). Follow-up actions: St Formal NOV issued (MAR-08-2012), St Public Notif requested (MAR-08-2012), St Public Notif received (MAR-21-2012), St AO (w/o penalty) issued (JUN-21-2012)
- MCL, Average - Between OCT-2009 and DEC-2009, Contaminant: Total Haloacetic Acids (HAA5). Follow-up actions: St Formal NOV issued (MAR-03-2010), St Public Notif requested (MAR-03-2010), St Compliance achieved (MAR-04-2010), St Public Notif received (APR-05-2010)
- MCL, Average - Between OCT-2007 and DEC-2007, Contaminant: Total Haloacetic Acids (HAA5). Follow-up actions: St Compliance achieved (JAN-30-2008), St Public Notif requested (APR-25-2008), St Violation/Reminder Notice (APR-25-2008), St Public Notif received (MAY-16-2008)
- MCL, Average - Between JUL-2007 and SEP-2007, Contaminant: Total Haloacetic Acids (HAA5). Follow-up actions: St Compliance achieved (JAN-30-2008), St Public Notif requested (APR-25-2008), St Violation/Reminder Notice (APR-25-2008), St Public Notif received (MAY-16-2008)
- Monitoring and Reporting (DBP) - Between APR-2007 and JUN-2007, Contaminant: Chlorine. Follow-up actions: St Compliance achieved (SEP-30-2007), St Formal NOV issued (JAN-29-2009), St Public Notif requested (MAR-01-2009), St Public Notif received (JUN-30-2009)
- One minor monitoring violation
- 166 regular monitoring violations
Past monitoring violations:
- Monitoring and Reporting (DBP) - Between APR-2007 and JUN-2007, Contaminant: Chlorine. Follow-up actions: St Compliance achieved (SEP-30-2007), St Formal NOV issued (JAN-29-2009), St Public Notif requested (MAR-01-2009), St Public Notif received (JUN-24-2009)
- One routine major monitoring violation
- 164 regular monitoring violations
| This city: | 2.8 people |
| Mississippi: | 2.6 people |
| This city: | 67.8% |
| Whole state: | 69.0% |
| This city: | 7.2% |
| Whole state: | 5.7% |
Likely homosexual households (counted as self-reported same-sex unmarried-partner households)
- Lesbian couples: 0.3% of all households
- Gay men: 0.2% of all households
People in group quarters in Canton in 2010:
- 336 people in local jails and other municipal confinement facilities
- 132 people in group homes intended for adults
- 121 people in nursing facilities/skilled-nursing facilities
- 93 people in correctional residential facilities
- 64 people in other noninstitutional facilities
People in group quarters in Canton in 2000:
- 265 people in local jails and other confinement facilities (including police lockups)
- 169 people in nursing homes
- 132 people in schools, hospitals, or wards for the intellectually disabled
- 75 people in state prisons
- 26 people in orthopedic wards and institutions for the physically handicapped
- 20 people in homes for the physically handicapped
Banks with branches in Canton (2011 data):
- Trustmark National Bank: East Canton Shopping Ctr Branch at 658 East Peace Street, branch established on 1971/10/12; Canton Branch at 3319 South Liberty Street, branch established on 1880/01/10. Info updated 2012/03/26: Bank assets: $9,612.1 mil, Deposits: $7,410.1 mil, headquarters in Jackson, MS, positive income, Commercial Lending Specialization, 186 total offices, Holding Company: Trustmark Corporation
- BankPlus: Canton Branch at 3366 North Liberty Street, branch established on 1977/01/03; Nissan Branch at 300 Nissan Drive, branch established on 2003/04/09. Info updated 2006/11/03: Bank assets: $2,177.0 mil, Deposits: $1,696.4 mil, headquarters in Belzoni, MS, positive income, Commercial Lending Specialization, 62 total offices, Holding Company: Bancplus Corporation
- Merchants and Farmers Bank: Canton Branch at 3330 S Liberty St, branch established on 1903/01/01. Info updated 2007/01/11: Bank assets: $1,561.3 mil, Deposits: $1,372.4 mil, headquarters in Kosciusko, MS, positive income, Commercial Lending Specialization, 39 total offices, Holding Company: First M & F Corporation
- Regions Bank: Canton Branch at 147 East Peace Street, branch established on 1934/06/01. Info updated 2011/02/24: Bank assets: $123,368.2 mil, Deposits: $98,301.3 mil, headquarters in Birmingham, AL, positive income, Commercial Lending Specialization, 1778 total offices, Holding Company: Regions Financial Corporation
For population 15 years and over in Canton:
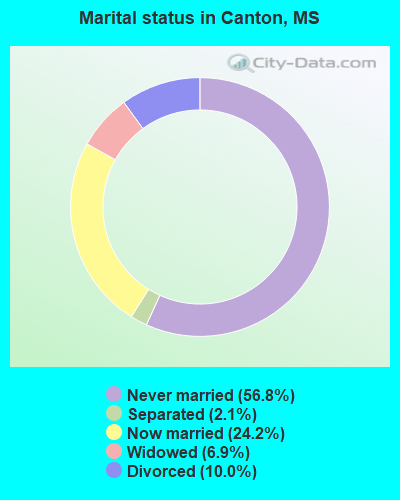
- Never married: 56.8%
- Now married: 24.2%
- Separated: 2.1%
- Widowed: 6.9%
- Divorced: 10.0%
For population 25 years and over in Canton:
- High school or higher: 77.7%
- Bachelor's degree or higher: 21.1%
- Graduate or professional degree: 12.2%
- Unemployed: 13.3%
- Mean travel time to work (commute): 21.3 minutes
| Here: | 13.6 |
| Mississippi average: | 11.8 |
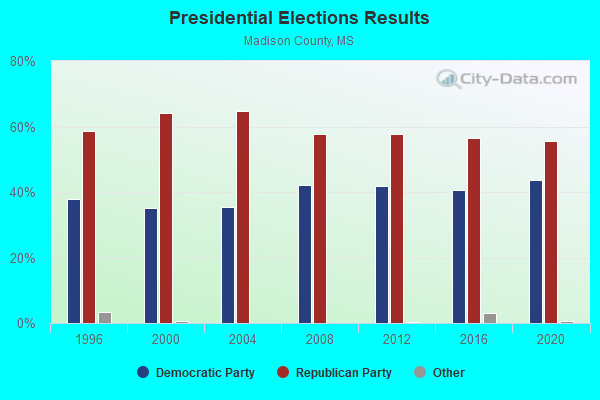
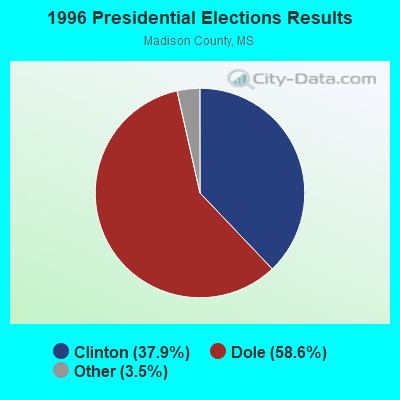
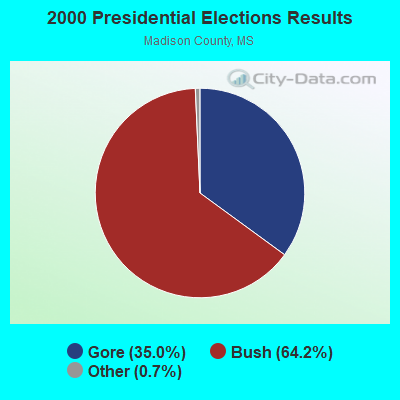
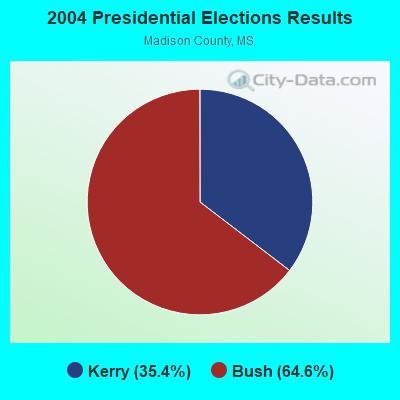
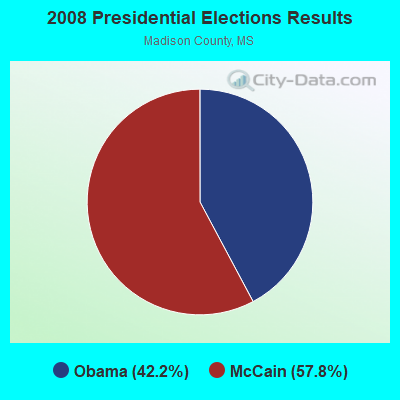
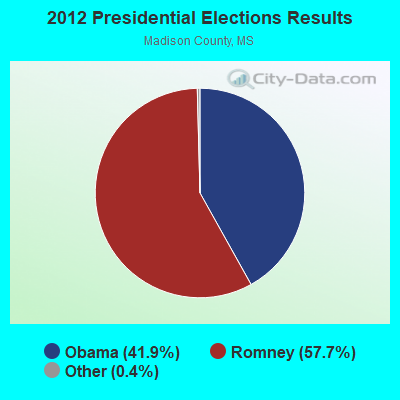
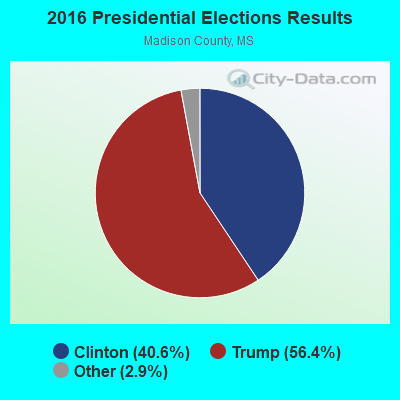
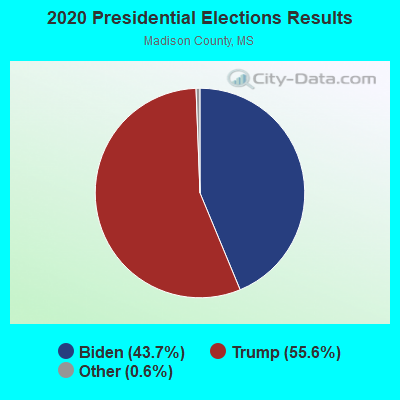
Graphs represent county-level data. Detailed 2008 Election Results
Religion statistics for Canton, MS (based on Madison County data)
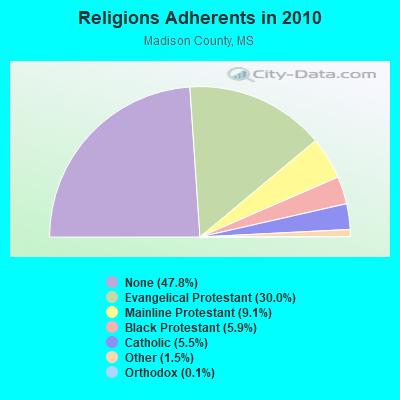
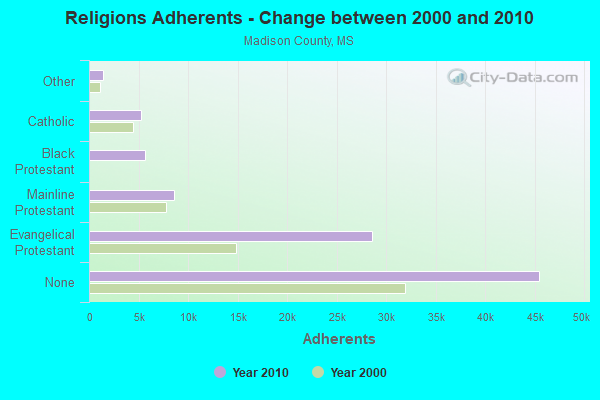
| Religion | Adherents | Congregations |
|---|---|---|
| Evangelical Protestant | 28,607 | 54 |
| Mainline Protestant | 8,631 | 20 |
| Black Protestant | 5,650 | 31 |
| Catholic | 5,242 | 5 |
| Other | 1,445 | 5 |
| Orthodox | 135 | 1 |
| None | 45,493 | - |
Food Environment Statistics:
| Madison County: | 1.34 / 10,000 pop. |
| Mississippi: | 2.08 / 10,000 pop. |
| Here: | 0.11 / 10,000 pop. |
| Mississippi: | 0.24 / 10,000 pop. |
| This county: | 0.45 / 10,000 pop. |
| Mississippi: | 0.80 / 10,000 pop. |
| Madison County: | 5.26 / 10,000 pop. |
| Mississippi: | 6.36 / 10,000 pop. |
| Here: | 7.28 / 10,000 pop. |
| Mississippi: | 5.03 / 10,000 pop. |
| Madison County: | 10.4% |
| State: | 12.3% |
| Madison County: | 28.4% |
| Mississippi: | 33.1% |
| This county: | 10.2% |
| State: | 14.4% |
Health and Nutrition:
| This city: | 48.0% |
| Mississippi: | 48.6% |
| This city: | 44.6% |
| Mississippi: | 45.3% |
| Canton: | 30.0 |
| Mississippi: | 29.2 |
| This city: | 19.9% |
| Mississippi: | 20.5% |
| Canton: | 13.3% |
| Mississippi: | 11.6% |
| Canton: | 6.7 |
| Mississippi: | 6.7 |
| This city: | 36.1% |
| State: | 34.8% |
| Canton: | 52.9% |
| Mississippi: | 54.9% |
| Here: | 82.1% |
| Mississippi: | 79.9% |
More about Health and Nutrition of Canton, MS Residents
| Local government employment and payroll (March 2022) | |||||
| Function | Full-time employees | Monthly full-time payroll | Average yearly full-time wage | Part-time employees | Monthly part-time payroll |
|---|---|---|---|---|---|
| Firefighters | 37 | $106,336 | $34,487 | 0 | $0 |
| Police Protection - Officers | 22 | $75,248 | $41,044 | 2 | $8,490 |
| Streets and Highways | 19 | $46,144 | $29,144 | 0 | $0 |
| Other Government Administration | 9 | $26,968 | $35,957 | 0 | $0 |
| Police - Other | 9 | $23,478 | $31,304 | 1 | $1,058 |
| Solid Waste Management | 9 | $30,739 | $40,985 | 0 | $0 |
| Judicial and Legal | 7 | $16,036 | $27,490 | 1 | $1,382 |
| Parks and Recreation | 7 | $18,558 | $31,814 | 0 | $0 |
| Financial Administration | 3 | $9,070 | $36,280 | 0 | $0 |
| Other and Unallocable | 3 | $11,514 | $46,056 | 1 | $2,081 |
| Housing and Community Development (Local) | 1 | $4,030 | $48,360 | 1 | $1,155 |
| Fire - Other | 1 | $5,350 | $64,200 | 0 | $0 |
| Totals for Government | 127 | $373,470 | $35,289 | 6 | $14,166 |
Canton government finances - Expenditure in 2021 (per resident):
- Construction - Regular Highways: $1,105,000 ($102.85)
Electric Utilities: $270,000 ($25.13)
Parks and Recreation: $187,000 ($17.41)
Natural Resources - Other: $41,000 ($3.82)
- Current Operations - Electric Utilities: $6,021,000 ($560.41)
Police Protection: $2,407,000 ($224.03)
Local Fire Protection: $2,189,000 ($203.74)
Sewerage: $1,807,000 ($168.19)
Parks and Recreation: $1,781,000 ($165.77)
Gas Utilities: $1,779,000 ($165.58)
Solid Waste Management: $1,651,000 ($153.67)
Water Utilities: $1,506,000 ($140.17)
General - Other: $1,295,000 ($120.53)
Regular Highways: $1,038,000 ($96.61)
Judicial and Legal Services: $872,000 ($81.16)
Central Staff Services: $872,000 ($81.16)
General Public Buildings: $872,000 ($81.16)
Financial Administration: $872,000 ($81.16)
Housing and Community Development: $566,000 ($52.68)
- General - Interest on Debt: $19,000 ($1.77)
- Other Capital Outlay - General - Other: $462,000 ($43.00)
Solid Waste Management: $75,000 ($6.98)
Housing and Community Development: $1,000 ($0.09)
Canton government finances - Revenue in 2021 (per resident):
- Charges - Solid Waste Management: $2,106,000 ($196.02)
Sewerage: $1,998,000 ($185.96)
Other: $359,000 ($33.41)
Parks and Recreation: $175,000 ($16.29)
Housing and Community Development: $18,000 ($1.68)
- Federal Intergovernmental - Housing and Community Development: $584,000 ($54.36)
- Local Intergovernmental - Sewerage: $1,275,000 ($118.67)
- Miscellaneous - Fines and Forfeits: $629,000 ($58.54)
General Revenue - Other: $464,000 ($43.19)
Special Assessments: $216,000 ($20.10)
Interest Earnings: $212,000 ($19.73)
Rents: $55,000 ($5.12)
Donations From Private Sources: $24,000 ($2.23)
- Revenue - Electric Utilities: $6,862,000 ($638.68)
Gas Utilities: $2,137,000 ($198.90)
Water Utilities: $1,840,000 ($171.26)
- State Intergovernmental - General Local Government Support: $4,193,000 ($390.26)
Highways: $906,000 ($84.33)
Other: $203,000 ($18.89)
- Tax - Property: $5,529,000 ($514.61)
Other Selective Sales: $716,000 ($66.64)
Other License: $390,000 ($36.30)
Public Utilities Sales: $183,000 ($17.03)
Other: $8,000 ($0.74)
Canton government finances - Cash and Securities in 2021 (per resident):
- Other Funds - Cash and Securities: $18,554,000 ($1726.92)
- Sinking Funds - Cash and Securities: $534,000 ($49.70)
| Businesses in Canton, MS | ||||
| Name | Count | Name | Count | |
|---|---|---|---|---|
| Arby's | 1 | Nike | 2 | |
| AutoZone | 1 | Penske | 1 | |
| Baskin-Robbins | 2 | Pizza Hut | 1 | |
| Best Western | 1 | Popeyes | 1 | |
| Chevrolet | 1 | Quality | 1 | |
| Days Inn | 1 | RadioShack | 1 | |
| Domino's Pizza | 1 | SONIC Drive-In | 1 | |
| FedEx | 4 | Subway | 2 | |
| H&R Block | 1 | True Value | 1 | |
| Hilton | 1 | U-Haul | 3 | |
| Holiday Inn | 1 | UPS | 1 | |
| KFC | 1 | Waffle House | 1 | |
| La Quinta | 1 | Wendy's | 1 | |
| McDonald's | 1 | |||
Strongest AM radio stations in Canton:
- WMGO (1370 AM; 1 kW; CANTON, MS; Owner: WMGO BROADCASTING CORP., INC.)
- WJNT (1180 AM; 50 kW; PEARL, MS; Owner: BUCHANAN BROADCASTING CO., INC.)
- WIIN (780 AM; daytime; 5 kW; RIDGELAND, MS; Owner: NEW SOUTH RADIO, INC)
- WJDX (620 AM; 5 kW; JACKSON, MS; Owner: CAPSTAR TX LIMITED PARTNERSHIP)
- WSJC (810 AM; 50 kW; MAGEE, MS; Owner: FAMILY TALK RADIO)
- WSLI (930 AM; 5 kW; JACKSON, MS; Owner: SPORTSRAD, INC.)
- WONG (1150 AM; 0 kW; CANTON, MS; Owner: MARION R. WILLIAMS)
- WWDF (720 AM; daytime; 5 kW; RICHLAND, MS; Owner: WILLIS BROADCASTING CORPORATION)
- WOAD (1300 AM; 5 kW; JACKSON, MS; Owner: URBAN RADIO OF MISSISSIPPI, L.L.C.)
- WTWZ (1120 AM; daytime; 8 kW; CLINTON, MS; Owner: WOOD BROADCASTING CO.)
- WZRX (1590 AM; 5 kW; JACKSON, MS; Owner: CAPSTAR TX LIMITED PARTNERSHIP)
- WQST (850 AM; daytime; 10 kW; FOREST, MS; Owner: ACE BROADCASTING, INC.)
- WCPC (940 AM; 50 kW; HOUSTON, MS; Owner: WCPC BROADCASTING CO., INC.)
Strongest FM radio stations in Canton:
- WYJS (105.9 FM; PICKENS, MS; Owner: URBAN RADIO OF MISSISSIPPI, LLC)
- WDBT (95.5 FM; JACKSON, MS; Owner: CAPSTAR TX LIMITED PARTNERSHIP)
- WMSI-FM (102.9 FM; JACKSON, MS; Owner: CAPSTAR TX LIMITED PARTNERSHIP)
- WSTZ-FM (106.7 FM; VICKSBURG, MS; Owner: CAPSTAR TX LIMITED PARTNERSHIP)
- WTYX (94.7 FM; JACKSON, MS; Owner: BACKYARD BROADCASTING MISSISSIPPI, LLC)
- WJMI (99.7 FM; JACKSON, MS; Owner: URBAN RADIO OF MISSISSIPPI, L.L.C.)
- WMPN-FM (91.3 FM; JACKSON, MS; Owner: MISSISSIPPI AUTHORITY FOR EDUCATIONAL TV)
- WUSJ (96.3 FM; JACKSON, MS; Owner: NEW SOUTH COMMUNICATIONS, INC.)
- WKXI-FM (107.5 FM; MAGEE, MS; Owner: URBAN RADIO OF MISSISSIPPI, L.L.C.)
- WQST-FM (92.5 FM; FOREST, MS; Owner: AMERICAN FAMILY ASSOCIATION, INC.)
- WYOY (101.7 FM; GLUCKSTADT, MS; Owner: NEW SOUTH RADIO, INC)
- WJKK (98.7 FM; VICKSBURG, MS; Owner: NEW SOUTH RADIO, INC.)
- WQJQ (105.1 FM; KOSCIUSKO, MS; Owner: CAPSTAR TX LIMITED PARTNERSHIP)
- WYAB (93.1 FM; YAZOO CITY, MS; Owner: SSR COMMUNICATIONS, INC.)
- WFMN (97.3 FM; FLORA, MS; Owner: WFMN RADIO, INC.)
- WZKR (103.3 FM; DECATUR, MS; Owner: PONYTAIL BROADCASTING, LLC)
- WRXW (93.9 FM; PEARL, MS; Owner: BACKYARD BROADCASTING MISSISSIPPI, LLC)
- WMPR (90.1 FM; JACKSON, MS; Owner: J.C. MAXWELL BROADCASTING GROUP, INC)
- WJNS-FM (92.1 FM; YAZOO CITY, MS; Owner: WILLIS BROADCASTING CORPORATION)
TV broadcast stations around Canton:
- WLBT (Channel 3; JACKSON, MS; Owner: CIVCO, INC.)
- WJTV (Channel 12; JACKSON, MS; Owner: MEDIA GENERAL COMMUNICATIONS, INC.)
- WDBD (Channel 40; JACKSON, MS; Owner: WDBD LICENSE CORP.)
- W46CW (Channel 46; JACKSON/BRANDON, MS; Owner: MISSISSIPPI TELEVISION, LLC)
- WMPN-TV (Channel 29; JACKSON, MS; Owner: MISSISSIPPI AUTHORITY FOR EDUCATIONAL TV)
- WJKO-LP (Channel 64; JACKSON, MS; Owner: WORD OF GOD FELLOWSHIP, INC.)
- WJMF-LP (Channel 53; JACKSON, MS; Owner: EQUITY BROADCASTING CORPORATION)
- WJXF-LP (Channel 49; JACKSON, MS; Owner: EQUITY BROADCASTING CORPORATION)
- WAPT (Channel 16; JACKSON, MS; Owner: WAPT HEARST-ARGYLE TV, INC. (CA CORP.))
- WBXK-CA (Channel 8; JACKSON, ETC., MS; Owner: THE BOX WORLDWIDE LLC)
- WBMS-CA (Channel 10; JACKSON, MS; Owner: GENE A. BLAILOCK)
- WABG-TV (Channel 6; GREENWOOD, MS; Owner: MISSISSIPPI BROADCASTING PARTNERS)
- National Bridge Inventory (NBI) Statistics
- 135Number of bridges
- 1,624ft / 495mTotal length
- $8,749,542,000Total costs
- 952,435Total average daily traffic
- 118,917Total average daily truck traffic
- New bridges - historical statistics
- 31920-1929
- 11930-1939
- 51950-1959
- 281960-1969
- 121970-1979
- 221980-1989
- 131990-1999
- 342000-2009
- 172010-2019
FCC Registered Antenna Towers: 244 (See the full list of FCC Registered Antenna Towers)
FCC Registered Commercial Land Mobile Towers: 1 (See the full list of FCC Registered Commercial Land Mobile Towers in Canton, MS)
FCC Registered Private Land Mobile Towers: 4 (See the full list of FCC Registered Private Land Mobile Towers)
FCC Registered Broadcast Land Mobile Towers: 34 (See the full list of FCC Registered Broadcast Land Mobile Towers)
FCC Registered Microwave Towers: 24 (See the full list of FCC Registered Microwave Towers in this town)
FCC Registered Paging Towers: 1 (See the full list of FCC Registered Paging Towers)
FCC Registered Amateur Radio Licenses: 41 (See the full list of FCC Registered Amateur Radio Licenses in Canton)
FAA Registered Aircraft: 11 (See the full list of FAA Registered Aircraft in Canton)
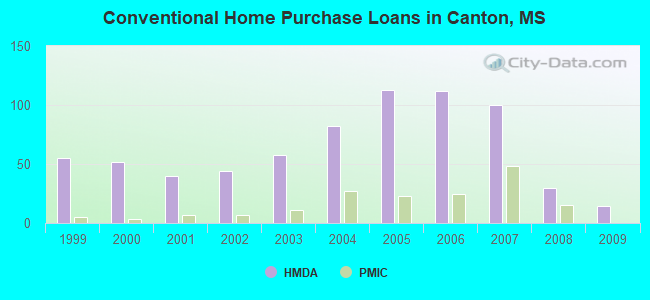
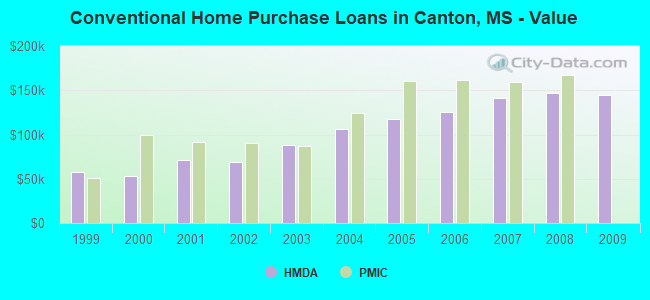
| Home Mortgage Disclosure Act Aggregated Statistics For Year 2009 (Based on 2 full and 2 partial tracts) | ||||||||||||
| A) FHA, FSA/RHS & VA Home Purchase Loans | B) Conventional Home Purchase Loans | C) Refinancings | D) Home Improvement Loans | F) Non-occupant Loans on < 5 Family Dwellings (A B C & D) | G) Loans On Manufactured Home Dwelling (A B C & D) | |||||||
|---|---|---|---|---|---|---|---|---|---|---|---|---|
| Number | Average Value | Number | Average Value | Number | Average Value | Number | Average Value | Number | Average Value | Number | Average Value | |
| LOANS ORIGINATED | 16 | $163,589 | 14 | $145,158 | 77 | $141,278 | 13 | $27,001 | 14 | $63,708 | 1 | $52,790 |
| APPLICATIONS APPROVED, NOT ACCEPTED | 0 | $0 | 2 | $96,100 | 7 | $123,871 | 1 | $27,880 | 0 | $0 | 0 | $0 |
| APPLICATIONS DENIED | 5 | $105,362 | 5 | $54,540 | 50 | $118,748 | 8 | $37,590 | 4 | $40,832 | 2 | $70,590 |
| APPLICATIONS WITHDRAWN | 4 | $179,500 | 1 | $20,000 | 20 | $134,885 | 0 | $0 | 2 | $40,845 | 0 | $0 |
| FILES CLOSED FOR INCOMPLETENESS | 0 | $0 | 0 | $0 | 4 | $60,195 | 1 | $37,000 | 0 | $0 | 0 | $0 |
Detailed HMDA statistics for the following Tracts: 0305.00 , 0306.00, 0307.00, 0308.00
| Private Mortgage Insurance Companies Aggregated Statistics For Year 2009 (Based on 2 full and 2 partial tracts) | ||||
| A) Conventional Home Purchase Loans | B) Refinancings | |||
|---|---|---|---|---|
| Number | Average Value | Number | Average Value | |
| LOANS ORIGINATED | 0 | $0 | 6 | $236,388 |
| APPLICATIONS APPROVED, NOT ACCEPTED | 1 | $115,000 | 0 | $0 |
| APPLICATIONS DENIED | 0 | $0 | 2 | $170,780 |
| APPLICATIONS WITHDRAWN | 0 | $0 | 1 | $87,790 |
| FILES CLOSED FOR INCOMPLETENESS | 0 | $0 | 0 | $0 |
Detailed PMIC statistics for the following Tracts: 0305.00 , 0306.00, 0307.00, 0308.00
2003 - 2018 National Fire Incident Reporting System (NFIRS) incidents
- Fire incident types reported to NFIRS in Canton, MS
- 1,51444.3%Outside Fires
- 1,17334.3%Structure Fires
- 60417.7%Mobile Property/Vehicle Fires
- 1303.8%Other
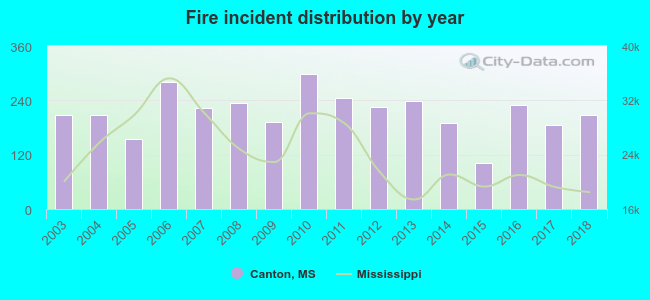 According to the data from the years 2003 - 2018 the average number of fire incidents per year is 214. The highest number of fires - 299 took place in 2010, and the least - 101 in 2015. The data has a decreasing trend.
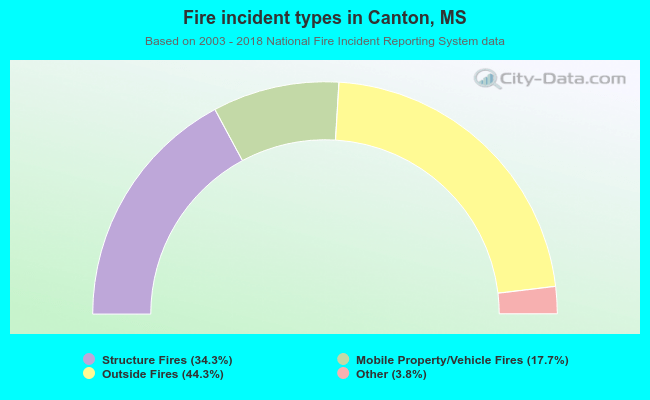 When looking into fire subcategories, the most incidents belonged to: Outside Fires (44.3%), and Structure Fires (34.3%).
Fire-safe hotels and motels in Canton, Mississippi:
- Brentwood Inn & Suites, 145 Soldiers Colony Rd, Canton, Mississippi 39046 , Phone: (601) 859-7575, Fax: (601) 859-6411
- Days Inn Of Canton, MS, 123 Sidney Runnels Dr, Canton, Mississippi 39046 , Phone: (601) 859-0760, Fax: (601) 859-0760
- La Quinta Inn & Suites, 152 Soldiers Colony Rd, Canton, Mississippi 39046 , Phone: (601) 855-2121, Fax: (601) 855-2121
- Hampton Inn, 133 Soldier Colony Rd, Canton, Mississippi 39046 , Phone: (601) 859-8700, Fax: (601) 407-1665
- Best Western Canton Inn, 137 Soldier Colony Rd, Canton, Mississippi 39046 , Phone: (601) 859-8600, Fax: (601) 859-4455
- Americas Best Value Inn, 119 Soldier Colony Rd, Canton, Mississippi 39046 , Phone: (601) 859-2643, Fax: (601) 859-2643
| Most common first names in Canton, MS among deceased individuals | ||
| Name | Count | Lived (average) |
|---|---|---|
| Mary | 189 | 76.7 years |
| James | 161 | 69.8 years |
| John | 143 | 73.9 years |
| Willie | 136 | 70.5 years |
| Robert | 118 | 70.9 years |
| Annie | 111 | 76.3 years |
| William | 111 | 72.3 years |
| George | 64 | 73.0 years |
| Jessie | 64 | 71.9 years |
| Henry | 56 | 71.3 years |
| Most common last names in Canton, MS among deceased individuals | ||
| Last name | Count | Lived (average) |
|---|---|---|
| Smith | 167 | 72.1 years |
| Williams | 158 | 71.1 years |
| Johnson | 146 | 75.1 years |
| Jones | 132 | 71.6 years |
| Brown | 125 | 71.5 years |
| Jackson | 120 | 73.1 years |
| Luckett | 87 | 70.5 years |
| Davis | 80 | 72.0 years |
| Harris | 69 | 71.8 years |
| Taylor | 57 | 73.6 years |
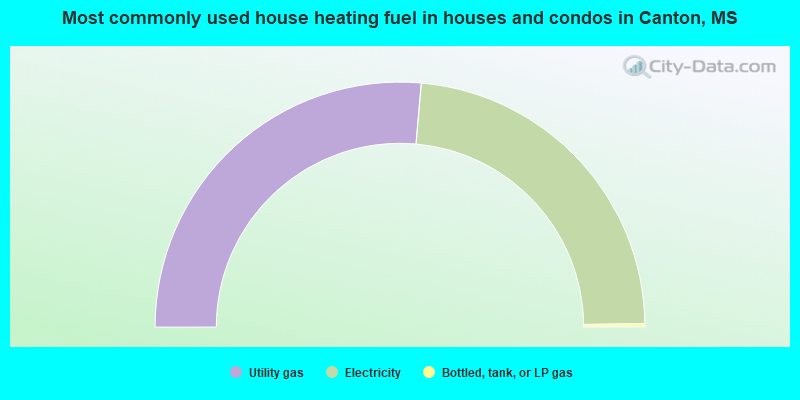
- 52.8%Utility gas
- 46.8%Electricity
- 0.4%Bottled, tank, or LP gas
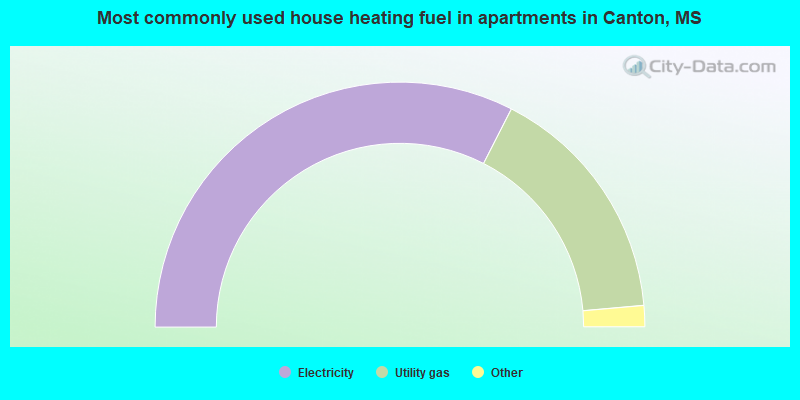
- 65.1%Electricity
- 32.2%Utility gas
- 2.1%Bottled, tank, or LP gas
- 0.6%Fuel oil, kerosene, etc.
Canton compared to Mississippi state average:
- Median household income below state average.
- Hispanic race population percentage above state average.
- Renting percentage above state average.
- Length of stay since moving in significantly above state average.
- House age above state average.
- Institutionalized population percentage above state average.
- Number of college students below state average.
Canton on our top lists:
- #54 on the list of "Top 101 cities with the highest number of burglaries per 100,000 residents, excludes tourist destinations and others with a lot of outsiders visiting based on city industries data (population 5,000+)"
- #60 on the list of "Top 101 cities with largest percentage of females in industries: administrative and support and waste management services (population 5,000+)"
- #61 on the list of "Top 101 cities with the largest percentage of people in schools, hospitals, or wards for the mentally retarded (population 1,000+)"
- #77 on the list of "Top 101 cities with the largest household incomes disparities (population 5,000+)"
- #80 on the list of "Top 101 cities with the largest percentage of people in orthopedic wards and institutions for the physically handicapped (population 1,000+)"
- #89 (39110) on the list of "Top 101 zip codes with the largest percentage of English first ancestries (pop 5,000+)"
- #41 on the list of "Top 101 counties with the largest decrease in the number of deaths per 1000 residents 2000-2006 to 2007-2013 (pop. 50,000+)"
- #69 on the list of "Top 101 counties with the largest number of people moving in compared to moving out (pop. 50,000+)"
- #91 on the list of "Top 101 counties with the highest percentage of residents relocating from other counties between 2010 and 2011 (pop. 50,000+)"
- #96 on the list of "Top 101 counties with the lowest percentage of residents relocating to foreign countries in 2011"

|
Total of 5 patent applications in 2008-2024.