Zephyrhills, FL (Florida) Houses and Residents
| Zephyrhills: | $207,307 |
| Florida: | $354,100 |
Total population: 14,381 (Urban population: 10,575, Rural population: 115 (all nonfarm))
Houses: 9,494 (7,929 occupied: 5,409 owner occupied, 2,730 renter occupied)
| % of renters here: | 34% |
| State: | 33% |
Housing density: 1,515 houses/condos per square mile
Median price asked for vacant for-sale houses and condos in 2022: $144,996.
Median contract rent in 2022: $925 (lower quartile is $660, upper quartile is $1,167)
Median rent asked for vacant for-rent units in 2022: $1,065
Median gross rent in Zephyrhills, FL in 2022: $1,086
Housing units in Zephyrhills with a mortgage: 2,250 (73 second mortgage, 12 home equity loan, 36 both second mortgage and home equity loan)
Houses without a mortgage: 37
Median household income for houses/condos with a mortgage: $68,451
Median household income for apartments without a mortgage: $46,243
Median monthly housing costs: $874
Compare current foreclosures in Zephyrhills, FL:
| Photo | Address | Area | Beds / Baths | Price | Details |
|---|---|---|---|---|---|

|
#1
20th St
Zephyrhills, FL 33542
|
1,068 sq. feet
|
2 baths 2 beds |
show details | |

|
#2
Meadowood Loop
Zephyrhills, FL 33542
|
884 sq. feet
|
2 baths 2 beds |
show details | |

|
#3
Mccoy Ct
Zephyrhills, FL 33542
|
1,508 sq. feet
|
1 baths 3 beds |
show details | |

|
#4
5th St
Zephyrhills, FL 33542
|
1,452 sq. feet
|
2 baths 3 beds |
show details | |

|
#5
Chambers Dr
Zephyrhills, FL 33541
|
1,368 sq. feet
|
1 baths 2 beds |
show details | |

|
#6
8th Ave
Zephyrhills, FL 33542
|
1,476 sq. feet
|
2 baths 2 beds |
show details | |

|
#7
9th Ave
Zephyrhills, FL 33542
|
944 sq. feet
|
1 baths 2 beds |
show details | |

|
#8
Fort King Rd
Zephyrhills, FL 33541
|
1,480 sq. feet
|
2 baths 3 beds |
show details | |

|
#9
Beech St
Zephyrhills, FL 33542
|
1,176 sq. feet
|
2 baths 2 beds |
show details | |

|
#10
North Ave
Zephyrhills, FL 33542
|
1,594 sq. feet
|
2 baths 3 beds |
show details |
| Photo | Address | Area | Beds / Baths | Price | Details |
|---|---|---|---|---|---|

|
#11
Beech St
Zephyrhills, FL 33542
|
1,252 sq. feet
|
2 baths - beds |
show details | |

|
#12
Garside Dr
Zephyrhills, FL 33540
|
624 sq. feet
|
6 baths 2 beds |
show details | |

|
#13
Tangerine Dr
Zephyrhills, FL 33542
|
1,110 sq. feet
|
1 baths - beds |
show details | |

|
#14
Tanda Cir
Zephyrhills, FL 33541
|
1,456 sq. feet
|
2 baths - beds |
show details | |

|
#15
Autumn Palm Dr
Zephyrhills, FL 33542
|
1,728 sq. feet
|
2 baths - beds |
show details | |

|
#16
Genevieve Cir
Zephyrhills, FL 33542
|
1,002 sq. feet
|
1 baths - beds |
show details | |

|
#17
Court St
Zephyrhills, FL 33542
|
1,620 sq. feet
|
2 baths - beds |
show details | |

|
#18
Boxer Round Pl
Zephyrhills, FL 33541
|
1,846 sq. feet
|
2 baths - beds |
show details | |

|
#19
Tucker Rd
Zephyrhills, FL 33542
|
1,344 sq. feet
|
2 baths 2 beds |
show details | |

|
#20
Moulden Hollow Dr
Zephyrhills, FL 33540
|
1,540 sq. feet
|
2 baths - beds |
show details |
| Photo | Address | Area | Beds / Baths | Price | Details |
|---|---|---|---|---|---|

|
#21
Meadowood Loop
Zephyrhills, FL 33542
|
962 sq. feet
|
2 baths - beds |
show details | |

|
#22
Kresterbrooke Ln
Zephyrhills, FL 33540
|
1,810 sq. feet
|
2 baths - beds |
show details | |

|
#23
Laguna Hills Cir
Zephyrhills, FL 33541
|
1,448 sq. feet
|
2 baths - beds |
show details | |

|
#24
Moulden Hollow Dr
Zephyrhills, FL 33540
|
1,918 sq. feet
|
2 baths - beds |
show details | |

|
#25
Abbywood Ln
Zephyrhills, FL 33541
|
1,468 sq. feet
|
2 baths - beds |
show details | |

|
#26
B Ave
Zephyrhills, FL 33542
|
1,088 sq. feet
|
1 baths 2 beds |
show details | |

|
#27
Judee Dr
Zephyrhills, FL 33541
|
1,176 sq. feet
|
4 baths 3 beds |
show details | |

|
#28
Wisteria Dr
Zephyrhills, FL 33542
|
1,446 sq. feet
|
1 baths 2 beds |
show details | |

|
#29
Heights Ave
Zephyrhills, FL 33542
|
1,092 sq. feet
|
1 baths 2 beds |
show details | |

|
#30
Craig Ln
Zephyrhills, FL 33542
|
1,139 sq. feet
|
2 baths 3 beds |
show details |
| Photo | Address | Area | Beds / Baths | Price | Details |
|---|---|---|---|---|---|

|
#31
Nubbin Ridge Ln
Zephyrhills, FL 33540
|
1,918 sq. feet
|
2 baths - beds |
show details | |

|
#32
Hillcrest Dr
Zephyrhills, FL 33542
|
768 sq. feet
|
2 baths 3 beds |
show details | |

|
#33
Seaberg Rd
Zephyrhills, FL 33541
|
2,280 sq. feet
|
2 baths - beds |
show details | |

|
#34
Jerry Rd
Zephyrhills, FL 33540
|
1,599 sq. feet
|
1 baths 3 beds |
show details | |

|
#35
Telluride Ln
Zephyrhills, FL 33541
|
1,682 sq. feet
|
2 baths - beds |
show details | |

|
#36
Steer Blade Dr
Zephyrhills, FL 33541
|
2,828 sq. feet
|
4 baths - beds |
show details | |

|
#37
Midland St
Zephyrhills, FL 33542
|
624 sq. feet
|
1 baths 2 beds |
show details | |

|
#38
Pinto Ln
Zephyrhills, FL 33541
|
2,280 sq. feet
|
2 baths 3 beds |
show details | |

|
#39
Commercial Pl
Zephyrhills, FL 33540
|
696 sq. feet
|
2 baths - beds |
show details | |

|
#40
12th St
Zephyrhills, FL 33542
|
848 sq. feet
|
1 baths 2 beds |
show details |
| Photo | Address | Area | Beds / Baths | Price | Details |
|---|---|---|---|---|---|

|
#41
Fresno Pl
Zephyrhills, FL 33541
|
1,964 sq. feet
|
3 baths - beds |
show details | |

|
#42
Merchantville Cir
Zephyrhills, FL 33540
|
1,420 sq. feet
|
2 baths - beds |
show details | |

|
#43
7th Ave
Zephyrhills, FL 33542
|
2,240 sq. feet
|
3 baths 4 beds |
show details | |

|
#44
17th St
Zephyrhills, FL 33542
|
1,454 sq. feet
|
2 baths - beds |
show details | |

|
#45
Broad Pointe Dr
Zephyrhills, FL 33540
|
1,690 sq. feet
|
2 baths - beds |
show details | |

|
#46
Shannon Ln
Zephyrhills, FL 33540
|
720 sq. feet
|
1 baths - beds |
show details | |

|
#47
Beech St
Zephyrhills, FL 33542
|
1,428 sq. feet
|
2 baths - beds |
show details | |

|
#48
Stewart Rd
Zephyrhills, FL 33540
|
1,512 sq. feet
|
2 baths 1 beds |
show details | |

|
#49
Sail Clover Ln
Zephyrhills, FL 33540
|
2,357 sq. feet
|
3 baths - beds |
show details | |

|
Check over 1 million property listings on Foreclosure.com!
|
browse all offers | |||

Latest news about housing in Zephyrhills, FL collected exclusively by city-data.com from local newspapers, TV, and radio stations

 | Considering buying a townhouse or condo (11 replies) |
| Wiregrass Mall phase II with luxury apartments (47 replies) |
| Avalon Park Wesley Chapel (About to build home) (26 replies) |
| Hurricane and evacuations (127 replies) |
| newer homes? (14 replies) |
| Where to live? Job doing home visits Pasco/hillsborough counties (31 replies) |

Median year apartment built: 1987
Household type by relationship:
Households: 18,797- Male householders: 3,327 (960 living alone), Female householders: 4,749 (2,099 living alone)
3,298 spouses (3,289 opposite-sex spouses), 490 unmarried partners, (452 opposite-sex unmarried partners), 4,626 children (4,099 natural, 154 adopted, 373 stepchildren), 467 grandchildren, 266 brothers or sisters, 443 parents, 0 foster children, 262 other relatives, 240 non-relatives
- In group quarters: 623
Size of family households: 2,791 2-persons, 679 3-persons, 847 4-persons, 289 5-persons, 86 6-persons, 39 7-or-more-persons.
Size of nonfamily households: 3,029 1-person, 383 2-persons, 8 3-persons.
1,792 married couples with children.
1,458 single-parent households (163 men, 1,295 women).
82.5% of residents of Zephyrhills speak English at home.
14.9% of residents speak Spanish at home (64% speak English very well, 13% speak English well, 18% speak English not well, 5% don't speak English at all).
2.1% of residents speak other Indo-European language at home (72% speak English very well, 8% speak English well, 17% speak English not well, 3% don't speak English at all).
0.9% of residents speak Asian or Pacific Island language at home (41% speak English very well, 37% speak English well, 23% speak English not well).
0.1% of residents speak other language at home (100% speak English very well).
Foreign born population: 1,691 (9.0%)
(51.7% of them are naturalized citizens)
| Here: | 5.3 |
| State: | 5.9 |
| Here: | 4.4 |
| State: | 4.2 |

- Bedrooms in owner-occupied houses and condos in Zephyrhills, Florida
- 0no bedroom
- 5341 bedroom
- 2,2142 bedrooms
- 2,2293 bedrooms
- 3984 bedrooms
- 365+ bedrooms

- Bedrooms in renter-occupied apartments in Zephyrhills, Florida
- 154no bedroom
- 7041 bedroom
- 1,1222 bedrooms
- 5953 bedrooms
- 1124 bedrooms
- 435+ bedrooms

- Cars and other vehicles available in Zephyrhills in owner-occupied houses/condos
- 163no vehicle
- 2,8611 vehicle
- 1,8422 vehicles
- 4493 vehicles
- 654 vehicles
- 305+ vehicles

- Cars and other vehicles available in Zephyrhills in renter-occupied apartments
- 528no vehicle
- 1,3451 vehicle
- 6072 vehicles
- 2043 vehicles
- 464 vehicles
- 05+ vehicles

- Rooms in owner-occupied houses in Zephyrhills, Florida
- 01 room
- 1582 rooms
- 5313 rooms
- 9124 rooms
- 1,4575 rooms
- 1,3786 rooms
- 4887 rooms
- 3248 rooms
- 1619+ rooms

- Rooms in renter-occupied apartments in Zephyrhills, Florida
- 1541 room
- 1972 rooms
- 4933 rooms
- 7614 rooms
- 6225 rooms
- 3366 rooms
- 857 rooms
- 258 rooms
- 579+ rooms


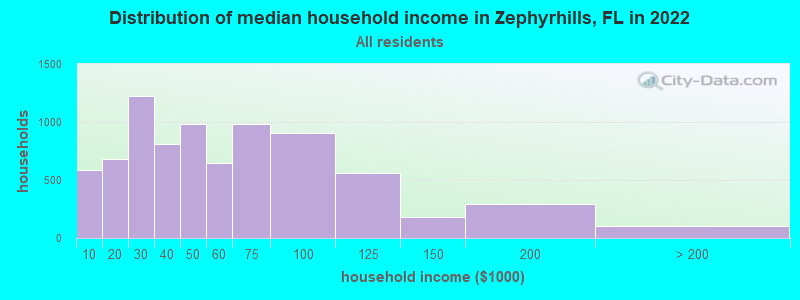
Zephyrhills, FL household income distribution

- 586Less than $10,000
- 677$10,000 to $19,999
- 1,223$20,000 to $29,999
- 814$30,000 to $39,999
- 986$40,000 to $49,999
- 648$50,000 to $59,999
- 980$60,000 to $74,999
- 904$75,000 to $99,999
- 562$100,000 to $124,999
- 180$125,000 to $149,999
- 290$150,000 to $199,999
- 105$200,000 or more
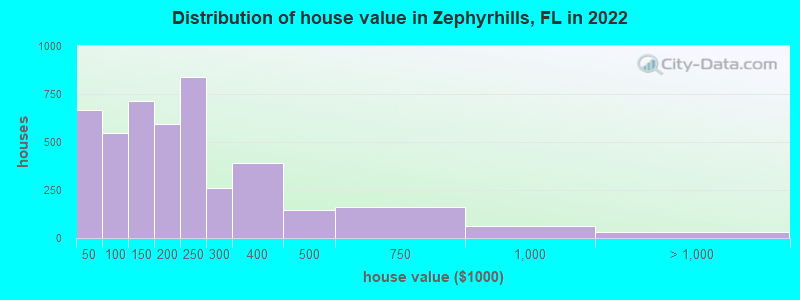
Home value of owner - occupied houses in 2022 in Zephyrhills, FL
-
- 209Less than $10,000
- 147$10,000 to $14,999
- 47$15,000 to $19,999
- 68$20,000 to $24,999
- 44$25,000 to $29,999
- 19$30,000 to $34,999
- 43$35,000 to $39,999
- 85$40,000 to $49,999
- 131$50,000 to $59,999
- 35$60,000 to $69,999
- 81$70,000 to $79,999
- 164$80,000 to $89,999
- 50$90,000 to $99,999
- 397$100,000 to $124,999
- 315$125,000 to $149,999
- 313$150,000 to $174,999
- 281$175,000 to $199,999
- 840$200,000 to $249,999
- 260$250,000 to $299,999
- 389$300,000 to $399,999
- 145$400,000 to $499,999
- 160$500,000 to $749,999
- 63$750,000 to $999,999
- 28$1,000,000 to $1,499,999
Rent paid by renters in 2022 in Zephyrhills, FL
-
- 35Less than $100
- 59$100 to $149
- 17$150 to $199
- 21$250 to $299
- 10$300 to $349
- 4$350 to $399
- 47$400 to $449
- 27$450 to $499
- 117$500 to $549
- 40$550 to $599
- 289$600 to $649
- 119$650 to $699
- 102$700 to $749
- 228$750 to $799
- 362$800 to $899
- 267$900 to $999
- 390$1,000 to $1,249
- 206$1,250 to $1,499
- 136$1,500 to $1,999
- 5$3,500 or more
- 29No cash rent


Percentage of workers working in this county: 72.3%
Number of people working at home: 963 (14.5% of all workers)
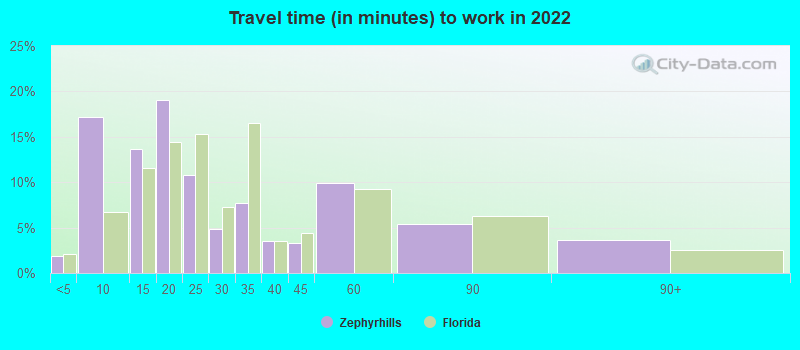
Travel time to work (commute)
- Less than 5 minutes: 194
- 5 to 9 minutes: 849
- 10 to 14 minutes: 670
- 15 to 19 minutes: 591
- 20 to 24 minutes: 600
- 25 to 29 minutes: 384
- 30 to 34 minutes: 486
- 35 to 39 minutes: 234
- 40 to 44 minutes: 258
- 45 to 59 minutes: 791
- 60 to 89 minutes: 402
- 90 or more minutes: 99
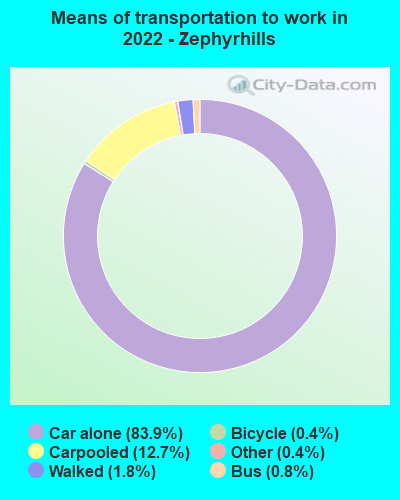
Means of transportation to work:
- Drove a car alone: 8,514 (72.1%)
- Carpooled: 1,150 (9.7%)
- Bus: 60 (0.5%)
- Taxi: 36 (0.3%)
- Bicycle: 67 (0.6%)
- Walked: 185 (1.6%)
- Worked at home: 963 (8.2%)

- Unemployment by race in 2022
- Unemployment rate for White non-Hispanic residents
- 1.1%Males
- 3.0%Females
- Unemployment rate for Black residents
- 5.3%Females
- Unemployment rate for other race residents
- 7.0%Males
- 23.2%Females
- Unemployment rate for two or more race residents
- 4.5%Males
- Unemployment rate for Hispanic or Latino residents
- 4.0%Males
- 17.7%Females

- Year of entry for the foreign-born population in Zephyrhills, Florida
- 5842010 or later
- 3792000 to 2009
- 2121990 to 1999
- 461980 to 1989
- 1181970 to 1979
- 242Before 1970
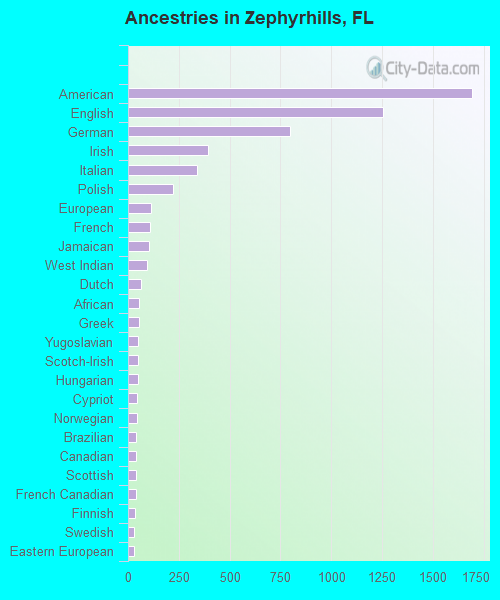
First ancestries reported:
- American: 1,692 (18.7%)
- English: 1,254 (13.9%)
- German: 797 (8.8%)
- Irish: 396 (4.4%)
- Italian: 341 (3.8%)
- Polish: 221 (2.4%)
- European: 115 (1.3%)
- French: 108 (1.2%)
- Jamaican: 105 (1.2%)
- West Indian: 94 (1.0%)
- Dutch: 63 (0.7%)
- African: 56 (0.6%)
- Greek: 55 (0.6%)
- Yugoslavian: 48 (0.5%)
- Scotch-Irish: 48 (0.5%)
- Hungarian: 48 (0.5%)
- Cypriot: 46 (0.5%)
- Norwegian: 44 (0.5%)
- Brazilian: 41 (0.5%)
- Canadian: 38 (0.4%)
- Scottish: 38 (0.4%)
- French Canadian: 38 (0.4%)
- Finnish: 32 (0.4%)
- Swedish: 30 (0.3%)
- Eastern European: 29 (0.3%)
- Haitian: 27 (0.3%)
- Welsh: 17 (0.2%)
- Slavic: 16 (0.2%)
- Swiss: 16 (0.2%)
- British: 15 (0.2%)
- British West Indian: 14 (0.2%)
- Austrian: 12 (0.1%)
- Danish: 12 (0.1%)
- Maltese: 10 (0.1%)
- Czechoslovakian: 9 (0.10%)
- Northern European: 9 (0.10%)
- Latvian: 8 (0.09%)
- Czech: 8 (0.09%)
- Lithuanian: 6 (0.07%)
- Slovak: 5 (0.06%)
- Pennsylvania German: 3 (0.03%)
Most common places of birth for foreign-born residents (%):
| Zephyrhills: | 13.5% (200) |
| Florida: | 2.4% (109,132) |
| Zephyrhills: | 12.2% (181) |
| Florida: | 5.6% (257,152) |
| Zephyrhills: | 8.8% (131) |
| Florida: | 5.7% (262,042) |
| Zephyrhills: | 8.2% (121) |
| Florida: | 6.5% (298,669) |
| Zephyrhills: | 7.5% (111) |
| Florida: | 5.0% (227,319) |
| Zephyrhills: | 6.4% (95) |
| Florida: | 22.0% (1,006,576) |
| Zephyrhills: | 5.2% (77) |
| Florida: | 0.2% (8,695) |
| Zephyrhills: | 5.1% (75) |
| Florida: | 1.8% (84,403) |
| Zephyrhills: | 3.5% (52) |
| Florida: | 1.2% (54,272) |
| Zephyrhills: | 2.4% (36) |
| Florida: | 0.8% (37,723) |
| Zephyrhills: | 2.4% (35) |
| Florida: | 0.4% (16,570) |
| Zephyrhills: | 1.9% (28) |
| Florida: | 0.6% (25,219) |
| Zephyrhills: | 1.6% (23) |
| Florida: | 7.5% (342,375) |
Place of birth for U.S.-born residents:
- This state: 6,324
- Other state: 9,677
- Northeast: 4,402
- Midwest: 3,405
- South: 1,400
- West: 515
83.5% of Zephyrhills residents lived in the same house 1 years ago.
Out of people who lived in different houses, 24.6% lived in this county.
Out of people who lived in different counties, 46.0% lived in Florida.
| Zephyrhills: | 83.5% |
| State average: | 86.3% |
Education attainment for males 25 years and older:
- No schooling: 134
- Nursery to 4th grade: 36
- 5th and 6th grade: 23
- 7th and 8th grade: 47
- 9th grade: 91
- 10th grade: 80
- 11th grade: 101
- 12th grade, no diploma: 106
- High school graduate (or equivalency): 2,218
- Less than 1 year of college: 484
- Some college more than 1 year, no degree: 1,085
- Associate degree: 730
- Bachelor's degree: 699
- Master's degree: 72
- Professional school degree: 24
- Doctorate degree: 22

Education attainment for females 25 years and older:
- No schooling: 94
- Nursery to 4th grade: 24
- 5th and 6th grade: 0
- 7th and 8th grade: 49
- 9th grade: 87
- 10th grade: 96
- 11th grade: 147
- 12th grade, no diploma: 143
- High school graduate (or equivalency): 2,907
- Less than 1 year of college: 733
- Some college more than 1 year, no degree: 1,035
- Associate degree: 932
- Bachelor's degree: 980
- Master's degree: 596
- Professional school degree: 49
- Doctorate degree: 68


Housing units in structures:
- One, detached: 4,384
- One, attached: 574
- Two: 439
- 3 or 4: 220
- 5 to 9: 224
- 10 to 19: 227
- 20 to 49: 163
- 50 or more: 470
- Mobile homes: 2,618
- Boats, RVs, vans, etc.: 170
Median worth of mobile homes: $54,821
Housing units lacking complete kitchen facilities in 2022: 0.8%
House/condo owner moved in on average 6 years ago
Renter moved in on average 6 years ago

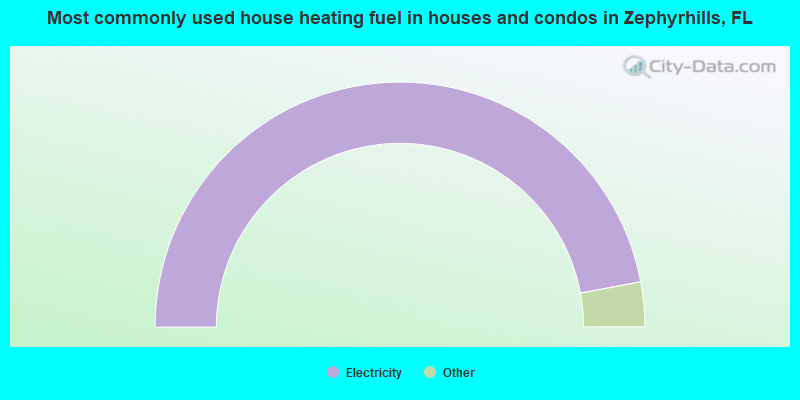
- 94.1%Electricity
- 2.6%Bottled, tank, or LP gas
- 1.4%No fuel used
- 1.3%Utility gas
- 0.5%Solar energy
- 0.2%Other fuel
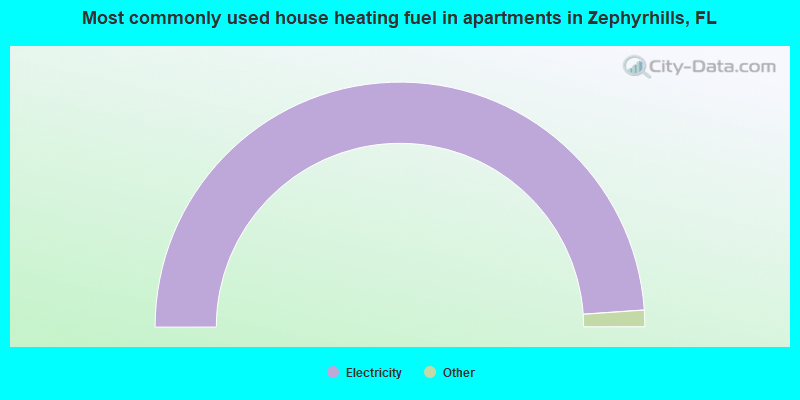
- 97.8%Electricity
- 2.0%No fuel used
- 0.2%Utility gas
Private vs. public school enrollment:
| Here: | 8.9% |
| Florida: | 15.8% |
| Here: | 36.1% |
| Florida: | 12.9% |
| Here: | 11.4% |
| Florida: | 23.6% |


