Races in Zephyrhills, Florida (FL) Detailed Stats
Data:
Races - White alone (%)
Races - White alone (% change since 2000)
Races - Black alone (%)
Races - Black alone (% change since 2000)
Races - American Indian alone (%)
Races - American Indian alone (% change since 2000)
Races - Asian alone (%)
Races - Asian alone (% change since 2000)
Races - Hispanic (%)
Races - Hispanic (% change since 2000)
Races - Native Hawaiian and Other Pacific Islander alone (%)
Races - Native Hawaiian and Other Pacific Islander alone (% change since 2000)
Races - Two or more races(%)
Races - Two or more races(% change since 2000)
Races - Other race alone (%)
Races - Other race alone (% change since 2000)
Racial diversity
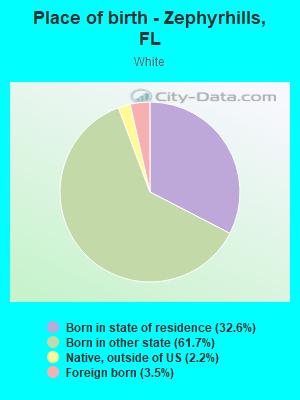
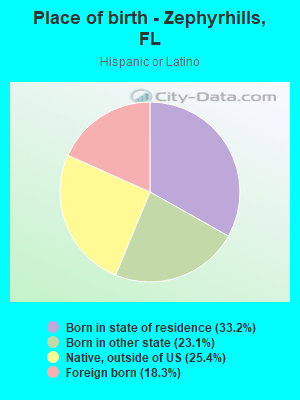
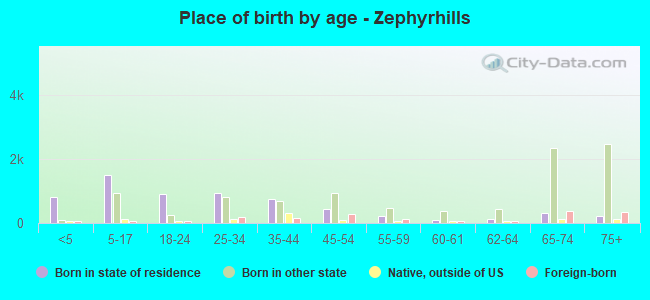
Place of birth - Born in state of residence (%)
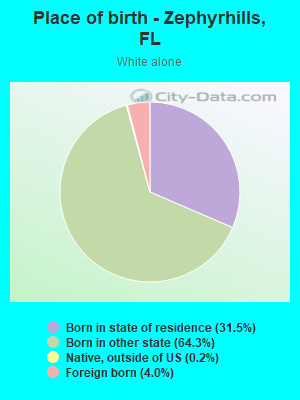
Place of birth - Born in state of residence (%) - White
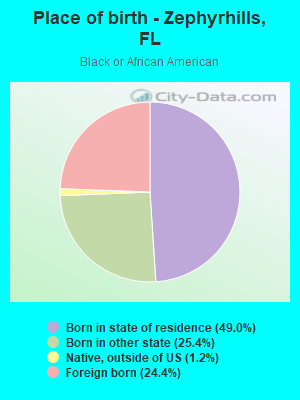
Place of birth - Born in state of residence (%) - Black or African American
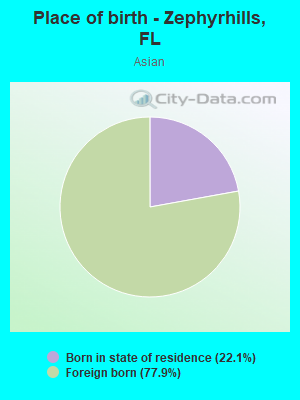
Place of birth - Born in state of residence (%) - Asian
Place of birth - Born in state of residence (%) - Hispanic or Latino
Place of birth - Born in state of residence (%) - American Indian and Alaska Native
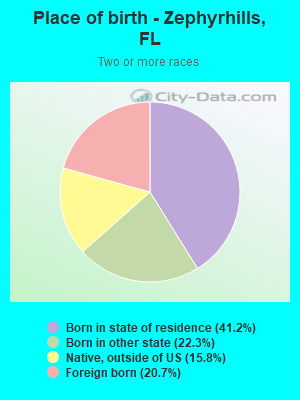
Place of birth - Born in state of residence (%) - Multirace
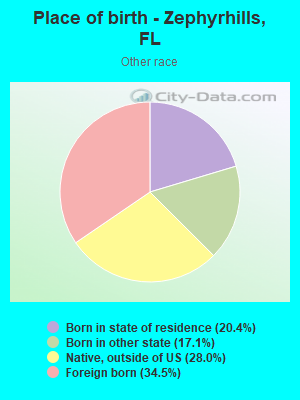
Place of birth - Born in state of residence (%) - Other Race
Place of birth - Born in other state (%)
Place of birth - Born in other state (%) - White
Place of birth - Born in other state (%) - Black or African American
Place of birth - Born in other state (%) - Asian
Place of birth - Born in other state (%) - Hispanic or Latino
Place of birth - Born in other state (%) - American Indian and Alaska Native
Place of birth - Born in other state (%) - Multirace
Place of birth - Born in other state (%) - Other Race
Place of birth - Native, outside of US (%)
Place of birth - Native, outside of US (%) - White
Place of birth - Native, outside of US (%) - Black or African American
Place of birth - Native, outside of US (%) - Asian
Place of birth - Native, outside of US (%) - Hispanic or Latino
Place of birth - Native, outside of US (%) - American Indian and Alaska Native
Place of birth - Native, outside of US (%) - Multirace
Place of birth - Native, outside of US (%) - Other Race
Place of birth - Foreign born (%)
Place of birth - Foreign born (%) - White
Place of birth - Foreign born (%) - Black or African American
Place of birth - Foreign born (%) - Asian
Place of birth - Foreign born (%) - Hispanic or Latino
Place of birth - Foreign born (%) - American Indian and Alaska Native
Place of birth - Foreign born (%) - Multirace
Place of birth - Foreign born (%) - Other Race
Residents speaking English at home (%)
Residents speaking English at home - Born in the United States (%)
Residents speaking English at home - Native, born elsewhere (%)
Residents speaking English at home - Foreign born (%)
Residents speaking Spanish at home (%)
Residents speaking Spanish at home - Born in the United States (%)
Residents speaking Spanish at home - Native, born elsewhere (%)
Residents speaking Spanish at home - Foreign born (%)
Residents speaking other language at home (%)
Residents speaking other language at home - Born in the United States (%)
Residents speaking other language at home - Native, born elsewhere (%)
Residents speaking other language at home - Foreign born (%)
Marital status - Never married (%)
Marital status - Now married (%)
Marital status - Separated (%)
Marital status - Widowed (%)
Marital status - Divorced (%)
Ancestries Reported - Arab (%)
Ancestries Reported - Czech (%)
Ancestries Reported - Danish (%)
Ancestries Reported - Dutch (%)
Ancestries Reported - English (%)
Ancestries Reported - French (%)
Ancestries Reported - French Canadian (%)
Ancestries Reported - German (%)
Ancestries Reported - Greek (%)
Ancestries Reported - Hungarian (%)
Ancestries Reported - Irish (%)
Ancestries Reported - Italian (%)
Ancestries Reported - Lithuanian (%)
Ancestries Reported - Norwegian (%)
Ancestries Reported - Polish (%)
Ancestries Reported - Portuguese (%)
Ancestries Reported - Russian (%)
Ancestries Reported - Scotch-Irish (%)
Ancestries Reported - Scottish (%)
Ancestries Reported - Slovak (%)
Ancestries Reported - Subsaharan African (%)
Ancestries Reported - Swedish (%)
Ancestries Reported - Swiss (%)
Ancestries Reported - Ukrainian (%)
Ancestries Reported - United States (%)
Ancestries Reported - Welsh (%)
Ancestries Reported - West Indian (%)
Ancestries Reported - Other (%)
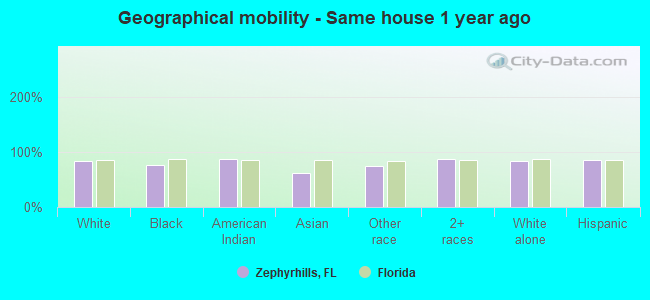
Geographical mobility - Same house 1 year ago (%)
Geographical mobility - Same house 1 year ago (%) - White
Geographical mobility - Same house 1 year ago (%) - Black or African American
Geographical mobility - Same house 1 year ago (%) - Asian
Geographical mobility - Same house 1 year ago (%) - Hispanic or Latino
Geographical mobility - Same house 1 year ago (%) - American Indian and Alaska Native
Geographical mobility - Same house 1 year ago (%) - Multirace
Geographical mobility - Same house 1 year ago (%) - Other Race
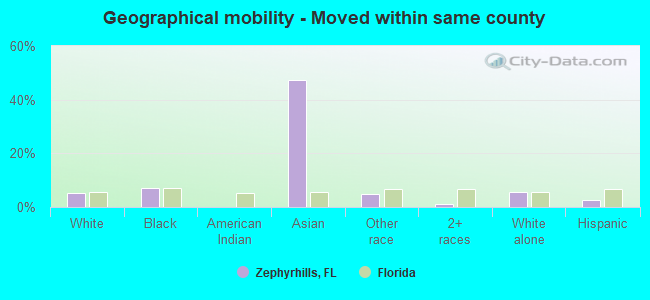
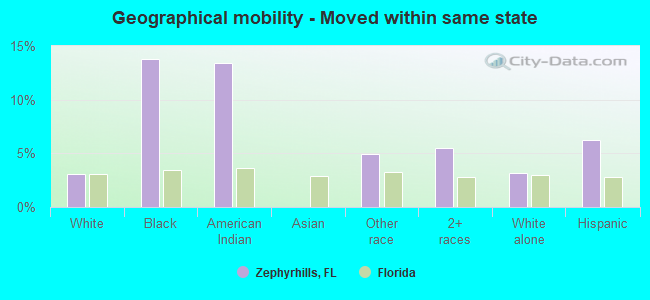
Geographical mobility - Moved within same county (%)
Geographical mobility - Moved within same county (%) - White
Geographical mobility - Moved within same county (%) - Black or African American
Geographical mobility - Moved within same county (%) - Asian
Geographical mobility - Moved within same county (%) - Hispanic or Latino
Geographical mobility - Moved within same county (%) - American Indian and Alaska Native
Geographical mobility - Moved within same county (%) - Multirace
Geographical mobility - Moved within same county (%) - Other Race
Geographical mobility - Moved from different county within same state (%)
Geographical mobility - Moved from different county within same state (%) - White
Geographical mobility - Moved from different county within same state (%) - Black or African American
Geographical mobility - Moved from different county within same state (%) - Asian
Geographical mobility - Moved from different county within same state (%) - Hispanic or Latino
Geographical mobility - Moved from different county within same state (%) - American Indian and Alaska Native
Geographical mobility - Moved from different county within same state (%) - Multirace
Geographical mobility - Moved from different county within same state (%) - Other Race
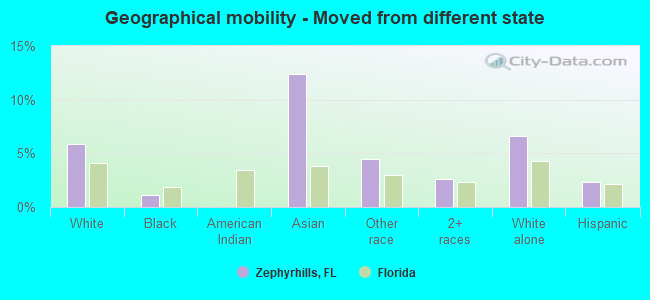
Geographical mobility - Moved from different state (%)
Geographical mobility - Moved from different state (%) - White
Geographical mobility - Moved from different state (%) - Black or African American
Geographical mobility - Moved from different state (%) - Asian
Geographical mobility - Moved from different state (%) - Hispanic or Latino
Geographical mobility - Moved from different state (%) - American Indian and Alaska Native
Geographical mobility - Moved from different state (%) - Multirace
Geographical mobility - Moved from different state (%) - Other Race
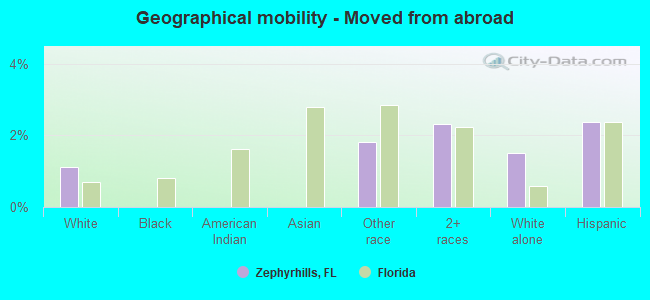
Geographical mobility - Moved from abroad (%)
Geographical mobility - Moved from abroad (%) - White
Geographical mobility - Moved from abroad (%) - Black or African American
Geographical mobility - Moved from abroad (%) - Asian
Geographical mobility - Moved from abroad (%) - Hispanic or Latino
Geographical mobility - Moved from abroad (%) - American Indian and Alaska Native
Geographical mobility - Moved from abroad (%) - Multirace
Geographical mobility - Moved from abroad (%) - Other Race
Place of birth for the foreign-born population - Ireland (%)
Place of birth for the foreign-born population - Denmark (%)
Place of birth for the foreign-born population - Norway (%)
Place of birth for the foreign-born population - Sweden (%)
Place of birth for the foreign-born population - United Kingdom (%)
Place of birth for the foreign-born population - England (%)
Place of birth for the foreign-born population - Scotland (%)
Place of birth for the foreign-born population - Other Northern Europe (%)
Place of birth for the foreign-born population - Austria (%)
Place of birth for the foreign-born population - Belgium (%)
Place of birth for the foreign-born population - France (%)
Place of birth for the foreign-born population - Germany (%)
Place of birth for the foreign-born population - Netherlands (%)
Place of birth for the foreign-born population - Switzerland (%)
Place of birth for the foreign-born population - Other Western Europe (%)
Place of birth for the foreign-born population - Greece (%)
Place of birth for the foreign-born population - Italy (%)
Place of birth for the foreign-born population - Portugal (%)
Place of birth for the foreign-born population - Spain (%)
Place of birth for the foreign-born population - Other Southern Europe (%)
Place of birth for the foreign-born population - Albania (%)
Place of birth for the foreign-born population - Belarus (%)
Place of birth for the foreign-born population - Bosnia and Herzegovina (%)
Place of birth for the foreign-born population - Bulgaria (%)
Place of birth for the foreign-born population - Croatia (%)
Place of birth for the foreign-born population - Czechoslovakia (%)
Place of birth for the foreign-born population - Hungary (%)
Place of birth for the foreign-born population - Latvia (%)
Place of birth for the foreign-born population - Lithuania (%)
Place of birth for the foreign-born population - North Macedonia (Macedonia) (%)
Place of birth for the foreign-born population - Moldova (%)
Place of birth for the foreign-born population - Poland (%)
Place of birth for the foreign-born population - Romania (%)
Place of birth for the foreign-born population - Russia (%)
Place of birth for the foreign-born population - Serbia (%)
Place of birth for the foreign-born population - Ukraine (%)
Place of birth for the foreign-born population - Other Eastern Europe (%)
Place of birth for the foreign-born population - China (%)
Place of birth for the foreign-born population - Hong Kong (%)
Place of birth for the foreign-born population - Taiwan (%)
Place of birth for the foreign-born population - Japan (%)
Place of birth for the foreign-born population - Korea (%)
Place of birth for the foreign-born population - Other Eastern Asia (%)
Place of birth for the foreign-born population - Afghanistan (%)
Place of birth for the foreign-born population - Bangladesh (%)
Place of birth for the foreign-born population - India (%)
Place of birth for the foreign-born population - Iran (%)
Place of birth for the foreign-born population - Kazakhstan (%)
Place of birth for the foreign-born population - Nepal (%)
Place of birth for the foreign-born population - Pakistan (%)
Place of birth for the foreign-born population - Sri Lanka (%)
Place of birth for the foreign-born population - Uzbekistan (%)
Place of birth for the foreign-born population - Other South Central Asia (%)
Place of birth for the foreign-born population - Burma (%)
Place of birth for the foreign-born population - Cambodia (%)
Place of birth for the foreign-born population - Indonesia (%)
Place of birth for the foreign-born population - Laos (%)
Place of birth for the foreign-born population - Malaysia (%)
Place of birth for the foreign-born population - Philippines (%)
Place of birth for the foreign-born population - Singapore (%)
Place of birth for the foreign-born population - Thailand (%)
Place of birth for the foreign-born population - Vietnam (%)
Place of birth for the foreign-born population - Other South Eastern Asia (%)
Place of birth for the foreign-born population - Armenia (%)
Place of birth for the foreign-born population - Iraq (%)
Place of birth for the foreign-born population - Israel (%)
Place of birth for the foreign-born population - Jordan (%)
Place of birth for the foreign-born population - Kuwait (%)
Place of birth for the foreign-born population - Lebanon (%)
Place of birth for the foreign-born population - Saudi Arabia (%)
Place of birth for the foreign-born population - Syria (%)
Place of birth for the foreign-born population - Turkey (%)
Place of birth for the foreign-born population - Yemen (%)
Place of birth for the foreign-born population - Other Western Asia (%)
Place of birth for the foreign-born population - Eritrea (%)
Place of birth for the foreign-born population - Ethiopia (%)
Place of birth for the foreign-born population - Kenya (%)
Place of birth for the foreign-born population - Somalia (%)
Place of birth for the foreign-born population - Uganda (%)
Place of birth for the foreign-born population - Zimbabwe (%)
Place of birth for the foreign-born population - Other Eastern Africa (%)
Place of birth for the foreign-born population - Cameroon (%)
Place of birth for the foreign-born population - Congo (%)
Place of birth for the foreign-born population - Democratic Republic of Congo (Zaire) (%)
Place of birth for the foreign-born population - Other Middle Africa (%)
Place of birth for the foreign-born population - Egypt (%)
Place of birth for the foreign-born population - Morocco (%)
Place of birth for the foreign-born population - Sudan (%)
Place of birth for the foreign-born population - Other Northern Africa (%)
Place of birth for the foreign-born population - South Africa (%)
Place of birth for the foreign-born population - Other Southern Africa (%)
Place of birth for the foreign-born population - Cabo Verde (%)
Place of birth for the foreign-born population - Ghana (%)
Place of birth for the foreign-born population - Liberia (%)
Place of birth for the foreign-born population - Nigeria (%)
Place of birth for the foreign-born population - Senegal (%)
Place of birth for the foreign-born population - Sierra Leone (%)
Place of birth for the foreign-born population - Other Western Africa (%)
Place of birth for the foreign-born population - Australia (%)
Place of birth for the foreign-born population - New Zealand (%)
Place of birth for the foreign-born population - Fiji (%)
Place of birth for the foreign-born population - Micronesia (%)
Place of birth for the foreign-born population - Bahamas (%)
Place of birth for the foreign-born population - Barbados (%)
Place of birth for the foreign-born population - Cuba (%)
Place of birth for the foreign-born population - Dominica (%)
Place of birth for the foreign-born population - Dominican Republic (%)
Place of birth for the foreign-born population - Grenada (%)
Place of birth for the foreign-born population - Haiti (%)
Place of birth for the foreign-born population - Jamaica (%)
Place of birth for the foreign-born population - St. Vincent and the Grenadines (%)
Place of birth for the foreign-born population - Trinidad and Tobago (%)
Place of birth for the foreign-born population - West Indies (%)
Place of birth for the foreign-born population - Other Caribbean (%)
Place of birth for the foreign-born population - Belize (%)
Place of birth for the foreign-born population - Costa Rica (%)
Place of birth for the foreign-born population - El Salvador (%)
Place of birth for the foreign-born population - Guatemala (%)
Place of birth for the foreign-born population - Honduras (%)
Place of birth for the foreign-born population - Mexico (%)
Place of birth for the foreign-born population - Nicaragua (%)
Place of birth for the foreign-born population - Panama (%)
Place of birth for the foreign-born population - Other Central America (%)
Place of birth for the foreign-born population - Argentina (%)
Place of birth for the foreign-born population - Bolivia (%)
Place of birth for the foreign-born population - Brazil (%)
Place of birth for the foreign-born population - Chile (%)
Place of birth for the foreign-born population - Colombia (%)
Place of birth for the foreign-born population - Ecuador (%)
Place of birth for the foreign-born population - Guyana (%)
Place of birth for the foreign-born population - Peru (%)
Place of birth for the foreign-born population - Uruguay (%)
Place of birth for the foreign-born population - Venezuela (%)
Place of birth for the foreign-born population - Other South America (%)
Place of birth for the foreign-born population - Canada (%)
Place of birth for the foreign-born population - Other Northern America (%)
Place of birth for the foreign-born population - Other (%)
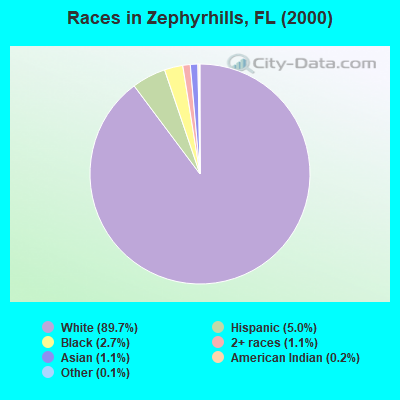
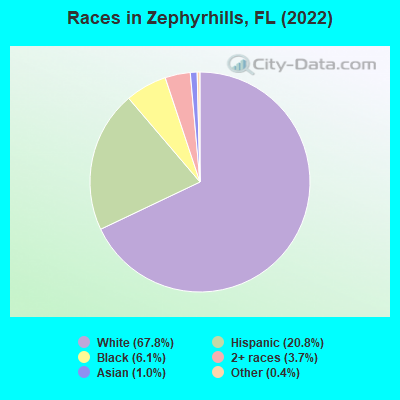
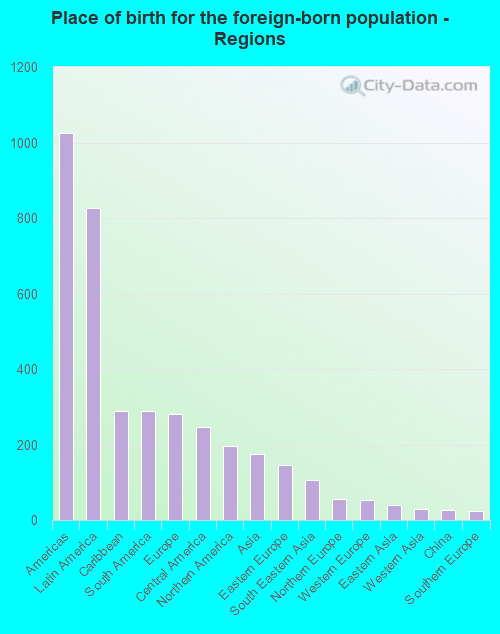
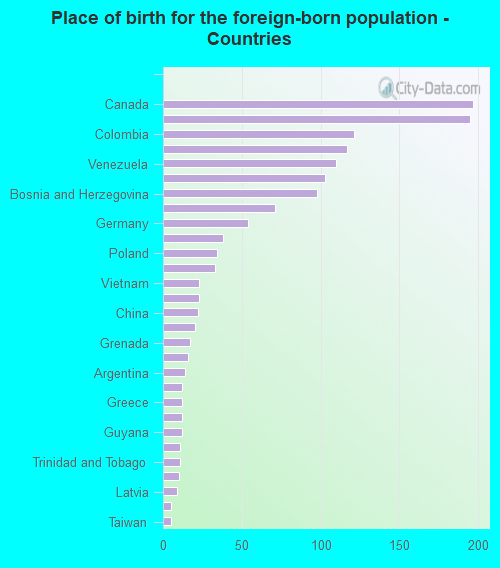
According to 2022 data, the most numerous races in Zephyrhills, FL are White alone (12,742 residents), Hispanic (3,911 residents), and Black alone (1,152 residents). 82.5% of Zephyrhills residents speak English at home. 7.9% of Zephyrhills, FL residents are foreign-born (4.5% born in Latin America, 1.5% born in Europe, 1.1% born in North America, 0.9% born in Asia), which is 166.5% less than the foreign-born rate of 21.0% across the entire state of Florida.
Race distribution in Zephyrhills
2000 2022
10,458,509 65.4% White alone 2,682,715 16.8% Hispanic 2,264,268 14.2% Black alone 261,693 1.6% Asian alone 236,954 1.5% Two or more races 42,358 0.3% American Indian alone 28,994 0.2% Other race alone 6,887 0.04% Native Hawaiian and Other
11,309,403 50.8% White alone 6,025,039 27.1% Hispanic 3,241,015 14.6% Black alone 861,630 3.9% Two or more races 623,692 2.8% Asian alone 152,054 0.7% Other race alone 22,504 0.1% American Indian alone 9,486 0.04% Native Hawaiian and Other
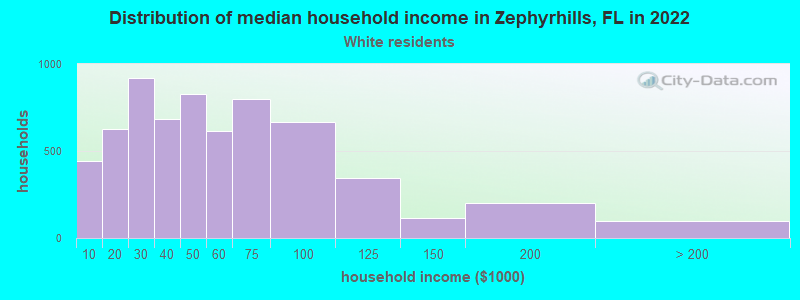
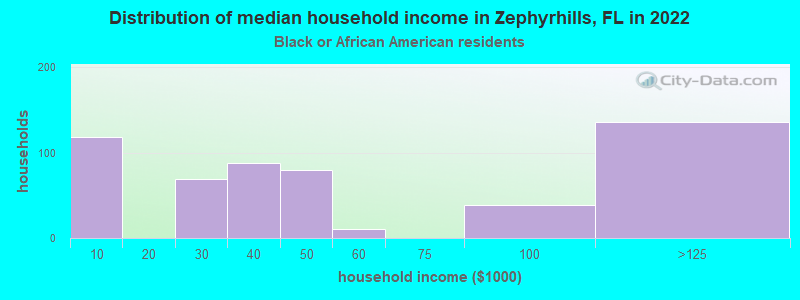
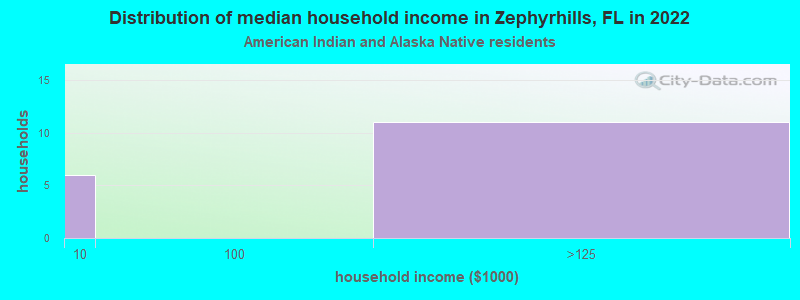
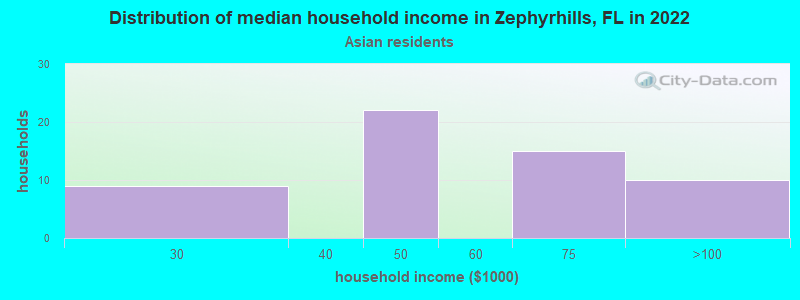
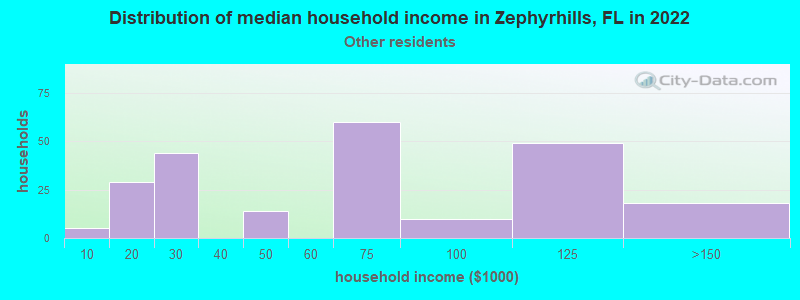
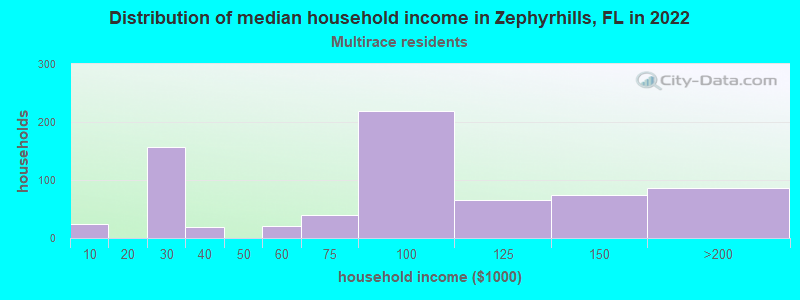
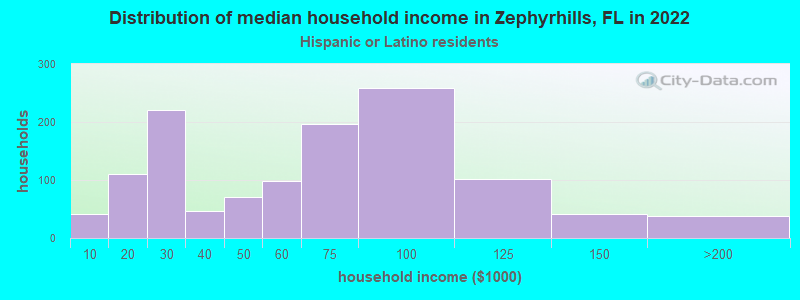
Income and house value in Zephyrhills Median household income in 2022 $46,846 White non-Hispanic householders$40,471 Black householders$50,182 Asian householders$90,591 Two or more races householders$60,982 Hispanic or Latino race householdersMedian 2022 house value $230,227 White Non-Hispanic householders$67,049 Black or African American householders $42,761 Asian householders$191,571 Some other race householders$167,282 Two or more races householders$184,729 Hispanic or Latino householders
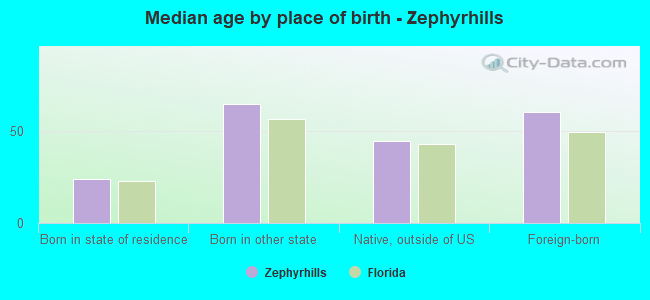
Median age by race in Zephyrhills
55.0 Median age for White residents51.4 58.1 45.6 Median age for Black or African American residents31.0 56.8 55.9 Median age for American Indian / Alaska Native residents-769,874,476.2 54.4 64.6 Median age for Asian residents61.0 64.2 -835,555,554.7 Median age for Native Hawaiian / Pacific Islander residents-858,307,848.3 -444,051,825.2 38.8 Median age for Other race residents35.2 44.3 31.6 Median age for Two or more races residents30.4 28.9 58.9 Median age for White alone residents54.8 60.7 34.7 Median age for Hispanic or Latino residents31.6 38.4
Owner/renter occupied households by race in Zephyrhills
House owners and renters - White residents 4,407 67.8% Owner occupied2,095 32.2% Renter occupiedHouse owners and renters - Black or African American residents 171 35.8% Owner occupied306 64.2% Renter occupiedHouse owners and renters - American Indian / Alaska Native residents 15 100.0% Owner occupiedHouse owners and renters - Asian residents 50 77.6% Owner occupied14 22.4% Renter occupiedHouse owners and renters - Other race residents 97 29.0% Owner occupied237 71.0% Renter occupiedHouse owners and renters - Two or more races residents 530 79.3% Owner occupied138 20.7% Renter occupiedHouse owners and renters - White alone residents 4,237 69.4% Owner occupied1,865 30.6% Renter occupiedHouse owners and renters - Hispanic or Latino residents 679 55.0% Owner occupied555 45.0% Renter occupied
Language usage in Zephyrhills
English speakers - Total 82.5% of residents of Zephyrhills speak English at home.
14.7% of residents speak Spanish at home 1,692 64.4% Speak English very well936 35.6% Speak English less than very well2.9% of residents speak other language at home 364 69.3% Speak English very well161 30.7% Speak English less than very well
English speakers - Born in the United States 93.4% of residents of Zephyrhills speak English at home.
5.3% of residents speak Spanish at home 402 79.4% Speak English very well104 20.6% Speak English less than very well1.3% of residents speak other language at home 108 89.3% Speak English very well13 10.7% Speak English less than very well
English speakers - Native, born elsewhere 9.6% of residents of Zephyrhills speak English at home.
95.9% of residents speak Spanish at home 661 69.2% Speak English very well294 30.8% Speak English less than very well
English speakers - Foreign-born 32.2% of residents of Zephyrhills speak English at home.
43.3% of residents speak Spanish at home 281 38.5% Speak English very well448 61.5% Speak English less than very well23.9% of residents speak other language at home 251 62.3% Speak English very well152 37.7% Speak English less than very well
White (Caucasian) - Speak only English Native:
94.1% (12,165)Foreign-born:
48.2% (233)
White (Caucasian) - Speak another language Native:
5.5% (705)Foreign-born:
51.9% (250)
Black or African American - Speak only English Native:
94.8% (822)Foreign-born:
89.7% (266)
Black or African American - Speak another language Native:
4.8% (42)Foreign-born:
13.2% (39)
Asian - Speak only English Native:
68.8% (28)Foreign-born:
20.7% (31)
Asian - Speak another language Native:
31.6% (13)Foreign-born:
78.8% (120)
Other race - Speak another language Native:
83.7% (491)Foreign-born:
99.9% (331)
Two or more races - Speak only English Native:
58.6% (908)Foreign-born:
3.3% (17)
Two or more races - Speak another language Native:
42.3% (656)Foreign-born:
99.1% (520)
White alone - Speak only English Native:
99.0% (11,704)Foreign-born:
53.0% (269)
White alone - Speak another language Native:
1.0% (121)Foreign-born:
44.3% (225)
Hispanic or Latino - Speak another language Native:
64.6% (1,816)Foreign-born:
100.0% (710)
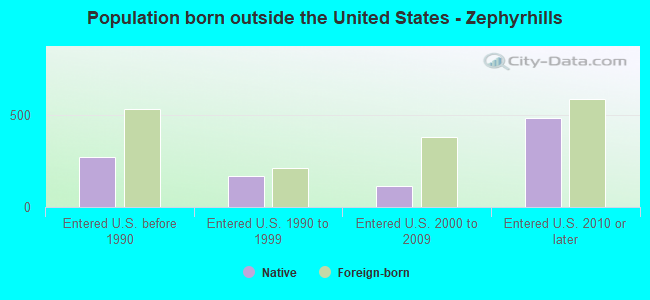
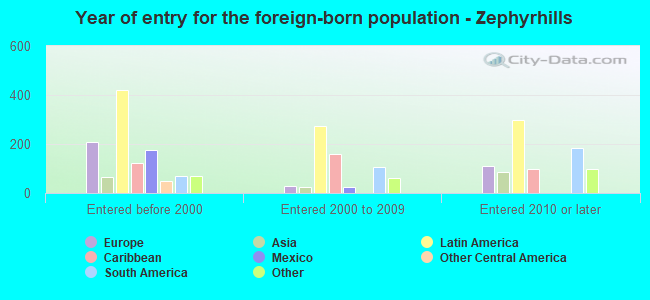
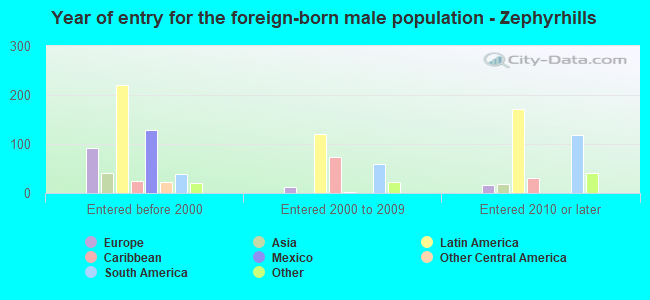
Foreign-born residents in Zephyrhills 1,481 residents are foreign born (4.5% Latin America , 1.5% Europe , 1.1% North America , 0.9% Asia ).
This city:
7.9%Florida:
21.1%
Marital status for residents in Zephyrhills Marital status - White (Caucasian) population 15 years and over
Males 27.4% Never married53.4% Now married2.4% Separated4.4% Widowed12.5% DivorcedFemales 20.9% Never married38.8% Now married2.4% Separated15.7% Widowed22.4% DivorcedWomen who gave birth in the past 12 months Now married:
95.0% (108)Unmarried:
5.0% (6)
Women who did not give birth in the past 12 months Now married:
38.0% (867)Unmarried:
62.0% (1,412)
Marital status - Black or African American population 15 years and over
Males 56.6% Never married25.3% Now married1.1% Separated1.8% Widowed15.2% DivorcedFemales 38.9% Never married23.8% Now married0.0% Separated9.7% Widowed27.6% DivorcedWomen who did not give birth in the past 12 months Now married:
25.4% (50)Unmarried:
74.6% (147)
Marital status - American Indian / Alaska Native population 15 years and over
Males 0.0% Never married0.0% Now married0.0% Separated100.0% Widowed0.0% DivorcedFemales 0.0% Never married19.2% Now married0.0% Separated50.0% Widowed30.8% DivorcedWomen who did not give birth in the past 12 months Now married:
0.0% (0)Unmarried:
100.0% (13)
Marital status - Asian population 15 years and over
Males 31.5% Never married68.5% Now married0.0% Separated0.0% Widowed0.0% DivorcedFemales 19.3% Never married62.2% Now married10.9% Separated7.6% Widowed0.0% DivorcedWomen who gave birth in the past 12 months Now married:
100.0% (9)Unmarried:
0.0% (0)
Women who did not give birth in the past 12 months Now married:
57.1% (17)Unmarried:
42.9% (12)
Marital status - Other race population 15 years and over
Males 26.2% Never married59.4% Now married13.4% Separated0.0% Widowed1.0% DivorcedFemales 12.4% Never married51.4% Now married8.4% Separated14.3% Widowed13.5% DivorcedWomen who gave birth in the past 12 months Now married:
0.0% (0)Unmarried:
100.0% (7)
Women who did not give birth in the past 12 months Now married:
81.5% (172)Unmarried:
18.5% (39)
Marital status - Two or more races population 15 years and over
Males 39.4% Never married41.0% Now married0.0% Separated7.7% Widowed11.8% DivorcedFemales 32.2% Never married39.6% Now married1.5% Separated3.6% Widowed23.1% DivorcedWomen who gave birth in the past 12 months Now married:
100.0% (25)Unmarried:
0.0% (0)
Women who did not give birth in the past 12 months Now married:
28.6% (146)Unmarried:
71.4% (365)
Marital status - White alone, not Hispanic / Latino population 15 years and over
Males 26.8% Never married53.7% Now married2.7% Separated3.9% Widowed12.9% DivorcedFemales 19.9% Never married38.1% Now married2.1% Separated17.0% Widowed22.9% DivorcedWomen who gave birth in the past 12 months Now married:
93.3% (83)Unmarried:
6.7% (6)
Women who did not give birth in the past 12 months Now married:
35.6% (707)Unmarried:
64.4% (1,277)
Marital status - Hispanic or Latino population 15 years and over
Males 32.0% Never married49.6% Now married2.1% Separated7.5% Widowed8.7% DivorcedFemales 20.6% Never married48.8% Now married5.1% Separated5.6% Widowed19.9% DivorcedWomen who gave birth in the past 12 months Now married:
92.2% (55)Unmarried:
7.8% (5)
Women who did not give birth in the past 12 months Now married:
56.3% (454)Unmarried:
43.7% (353)
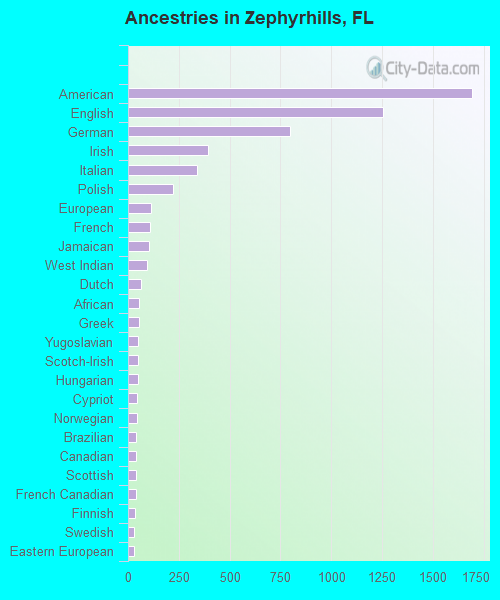
Ancestries in Zephyrhills
1,692 18.7% American1,254 13.9% English797 8.8% German396 4.4% Irish341 3.8% Italian221 2.4% Polish115 1.3% European108 1.2% French105 1.2% Jamaican94 1.0% West Indian63 0.7% Dutch56 0.6% African55 0.6% Greek48 0.5% Yugoslavian48 0.5% Scotch-Irish48 0.5% Hungarian46 0.5% Cypriot44 0.5% Norwegian41 0.5% Brazilian38 0.4% Canadian38 0.4% Scottish38 0.4% French Canadian32 0.4% Finnish30 0.3% Swedish29 0.3% Eastern European27 0.3% Haitian17 0.2% Welsh16 0.2% Slavic16 0.2% Swiss15 0.2% British14 0.2% British West Indian12 0.1% Austrian12 0.1% Danish10 0.1% Maltese9 0.10% Czechoslovakian9 0.10% Northern European8 0.09% Latvian8 0.09% Czech6 0.07% Lithuanian5 0.06% Slovak3 0.03% Pennsylvania German
Children Nativity (place of birth) in Zephyrhills
Children under 6 years - Living with two parents Both parents native 620 100.0% NativeBoth parents foreign-born 72 100.0% NativeOne native, one foreign-born parent 43 100.0% NativeChildren under 6 years - Living with one parent Native parent 351 100.0% NativeForeign-born parent 7 100.0% NativeChildren 6 to 17 years - Living with two parents Both parents native 763 99.5% Native4 0.5% Foreign-bornBoth parents foreign-born 117 73.9% Native41 26.1% Foreign-bornOne native, one foreign-born parent 109 100.0% NativeChildren 6 to 17 years - Living with one parent Native parent 1,327 100.0% NativeForeign-born parent 2 45.6% Native2 54.4% Foreign-born
Grandparents responsible for own grandchildren in Zephyrhills
Grandparents (30 to 59 years) White / Caucasian 31 100.0% Not responsible for grandchildrenBlack or African American 42 100.0% Not responsible for grandchildrenOther race 23 100.0% Not responsible for grandchildrenWhite alone, not Hispanic / Latino 27 100.0% Not responsible for grandchildrenHispanic or Latino 17 100.0% Not responsible for grandchildrenGrandparents (60 years and over) White / Caucasian 12 12.5% Responsible for grandchildren84 87.5% Not responsible for grandchildrenOther race 22 100.0% Not responsible for grandchildrenWhite alone, not Hispanic / Latino 13 15.0% Responsible for grandchildren72 85.0% Not responsible for grandchildrenHispanic or Latino 45 100.0% Not responsible for grandchildren