Whitehall, PA (Pennsylvania) Houses and Residents
| Whitehall: | $238,089 |
| Pennsylvania: | $245,500 |
Mean price in 2022:
Detached houses: $226,842
Here: $226,842 State: $317,202 Townhouses or other attached units: $253,133
Here: $253,133 State: $254,369
Total population: 13,896 (All urban)
Houses: 7,178 (6,880 occupied: 5,012 owner occupied, 1,746 renter occupied)
| % of renters here: | 26% |
| State: | 31% |
Housing density: 2,186 houses/condos per square mile
Median price asked for vacant for-sale houses and condos in 2022 in this county: $195,117.
Median contract rent in 2022: $796 (lower quartile is $670, upper quartile is $1,106)
Median rent asked for vacant for-rent units in 2022: $1,113
Median gross rent in Whitehall, PA in 2022: $888
Housing units in Whitehall with a mortgage: 2,906 (407 second mortgage, 0 home equity loan, 349 both second mortgage and home equity loan)
Houses without a mortgage: 154
Median household income for houses/condos with a mortgage: $106,926
Median household income for apartments without a mortgage: $81,963
Median monthly housing costs: $1,056
Compare current foreclosures in Whitehall, PA:
| Photo | Address | Area | Beds / Baths | Price | Details |
|---|---|---|---|---|---|

|
#1
Rising Hill Rd
Whitehall, PA 18052
|
- sq. feet
|
2 baths 3 beds |
show details | |

|
#2
Oak St
Whitehall, PA 18052
|
1,652 sq. feet
|
2 baths 3 beds |
show details | |

|
#3
Foxdale Dr
Whitehall, PA 18052
|
1,729 sq. feet
|
2 baths 3 beds |
show details | |

|
#4
7th St
Whitehall, PA 18052
|
1,752 sq. feet
|
2 baths 4 beds |
show details | |

|
#5
Eisenhower Cir
Whitehall, PA 18052
|
1,360 sq. feet
|
1 baths 3 beds |
show details | |

|
#6
Beech St
Whitehall, PA 18052
|
2,062 sq. feet
|
2 baths 4 beds |
show details | |

|
#7
Fairview St
Whitehall, PA 18052
|
1,797 sq. feet
|
1 baths 3 beds |
show details | |

|
#8
N 1st Ave
Whitehall, PA 18052
|
1,620 sq. feet
|
2 baths 5 beds |
show details | |

|
#9
Jefferson St
Whitehall, PA 18052
|
1,520 sq. feet
|
1 baths 2 beds |
show details | |

|
#10
Foxdale Dr
Whitehall, PA 18052
|
1,729 sq. feet
|
1 baths 3 beds |
show details |
| Photo | Address | Area | Beds / Baths | Price | Details |
|---|---|---|---|---|---|

|
#11
Brynwood Dr
Whitehall, PA 18052
|
1,985 sq. feet
|
2 baths 3 beds |
show details | |

|
#12
Forest Rd
Whitehall, PA 18052
|
1,800 sq. feet
|
2 baths 3 beds |
show details | |

|
#13
Beech St
Whitehall, PA 18052
|
2,062 sq. feet
|
2 baths 4 beds |
show details | |

|
#14
Crest Dr
Whitehall, PA 18052
|
1,097 sq. feet
|
1 baths 3 beds |
show details | |

|
#15
N Lehigh Ave
Whitehall, PA 18052
|
1,632 sq. feet
|
1 baths 4 beds |
show details | |

|
#16
Ruch St
Whitehall, PA 18052
|
1,404 sq. feet
|
2 baths 4 beds |
show details | |

|
#17
Delphi Dr
Whitehall, PA 18052
|
1,676 sq. feet
|
2 baths 3 beds |
show details | |

|
#18
Washington St
Whitehall, PA 18052
|
2,208 sq. feet
|
2 baths 4 beds |
show details | |

|
#19
Suncrest Cir
Whitehall, PA 18052
|
2,115 sq. feet
|
3 baths 4 beds |
show details | |

|
#20
Forest Rd
Whitehall, PA 18052
|
1,800 sq. feet
|
2 baths 3 beds |
show details |
| Photo | Address | Area | Beds / Baths | Price | Details |
|---|---|---|---|---|---|

|
#21
Peachtree Cir
Whitehall, PA 18052
|
1,848 sq. feet
|
2 baths 3 beds |
show details | |

|
#22
Chestnut St
Whitehall, PA 18052
|
1,684 sq. feet
|
1 baths 3 beds |
show details | |

|
#23
Creekside Rd
Whitehall, PA 18052
|
2,009 sq. feet
|
3 baths 3 beds |
show details | |

|
#24
Foxrun Ln
Whitehall, PA 18052
|
2,256 sq. feet
|
2 baths 4 beds |
show details | |

|
#25
Brynwood Dr
Whitehall, PA 18052
|
1,985 sq. feet
|
2 baths 3 beds |
show details | |

|
#26
W Tyler St
Whitehall, PA 18052
|
1,248 sq. feet
|
1 baths 3 beds |
show details | |

|
#27
Linden Ln
Whitehall, PA 18052
|
1,982 sq. feet
|
2 baths 3 beds |
show details | |

|
#28
Fernhill Ln
Whitehall, PA 18052
|
1,220 sq. feet
|
1 baths 3 beds |
show details | |

|
#29
Redbud Dr E
Whitehall, PA 18052
|
2,970 sq. feet
|
2 baths 4 beds |
show details | |

|
#30
Barklay Rd
Whitehall, PA 18052
|
1,686 sq. feet
|
1 baths 3 beds |
show details |
| Photo | Address | Area | Beds / Baths | Price | Details |
|---|---|---|---|---|---|

|
#31
Pine St
Whitehall, PA 18052
|
1,772 sq. feet
|
2 baths 3 beds |
show details | |

|
#32
Overlook Rd
Whitehall, PA 18052
|
2,237 sq. feet
|
2 baths 4 beds |
show details | |

|
#33
S 2nd St
Whitehall, PA 18052
|
3,044 sq. feet
|
2 baths 6 beds |
show details | |

|
#34
Halleck Dr
Whitehall, PA 18052
|
2,332 sq. feet
|
2 baths 4 beds |
show details | |

|
#35
Redbud Dr E
Whitehall, PA 18052
|
2,826 sq. feet
|
2 baths 4 beds |
show details | |

|
#36
7th St
Whitehall, PA 18052
|
1,752 sq. feet
|
2 baths 4 beds |
show details | |

|
#37
Harding Cir
Whitehall, PA 18052
|
1,792 sq. feet
|
2 baths 3 beds |
show details | |

|
#38
Linden Ln
Whitehall, PA 18052
|
1,982 sq. feet
|
2 baths 3 beds |
show details | |

|
#39
N 1st Ave # 2
Whitehall, PA 18052
|
- sq. feet
|
- baths - beds |
show details | |

|
#40
Main St Apt 5
Whitehall, PA 18052
|
- sq. feet
|
- baths - beds |
show details |
| Photo | Address | Area | Beds / Baths | Price | Details |
|---|---|---|---|---|---|

|
#41
Knossos Dr Apt 3
Whitehall, PA 18052
|
- sq. feet
|
- baths - beds |
show details | |

|
#42
N 14th St Apt U11
Whitehall, PA 18052
|
- sq. feet
|
- baths - beds |
show details | |

|
#43
Maryland Cir Apt 205
Whitehall, PA 18052
|
- sq. feet
|
- baths - beds |
show details | |

|
#44
Elmhurst Dr
Whitehall, PA 18052
|
- sq. feet
|
- baths - beds |
show details | |

|
#45
Carbon St Apt 88
Whitehall, PA 18052
|
- sq. feet
|
- baths - beds |
show details | |

|
#46
N 13th St Apt P24
Whitehall, PA 18052
|
- sq. feet
|
- baths - beds |
show details | |

|
#47
N 14th St, Apt S
Whitehall, PA 18052
|
- sq. feet
|
- baths - beds |
show details | |

|
#48
Stone Terrace Dr
Whitehall, PA 18052
|
- sq. feet
|
- baths - beds |
show details | |

|
#49
St E Condo
Whitehall, PA 18052
|
- sq. feet
|
- baths - beds |
show details | |

|
Check over 1 million property listings on Foreclosure.com!
|
browse all offers | |||

Latest news about housing in Whitehall, PA collected exclusively by city-data.com from local newspapers, TV, and radio stations


Median year apartment built: 1964
Household type by relationship:
Households: 14,764- Male householders: 3,799 (1,152 living alone), Female householders: 2,975 (1,382 living alone)
3,117 spouses (3,071 opposite-sex spouses), 182 unmarried partners, (161 opposite-sex unmarried partners), 3,564 children (3,385 natural, 9 adopted, 168 stepchildren), 89 grandchildren, 167 brothers or sisters, 304 parents, 0 foster children, 144 other relatives, 185 non-relatives
- In group quarters: 234
Size of family households: 2,073 2-persons, 933 3-persons, 626 4-persons, 159 5-persons, 128 6-persons, 5 7-or-more-persons.
Size of nonfamily households: 2,601 1-person, 168 2-persons, 35 3-persons.
1,894 married couples with children.
531 single-parent households (160 men, 371 women).
84.5% of residents of Whitehall speak English at home.
0.7% of residents speak Spanish at home (92% speak English very well, 8% speak English not well).
13.8% of residents speak other Indo-European language at home (26% speak English very well, 35% speak English well, 29% speak English not well, 10% don't speak English at all).
1.4% of residents speak Asian or Pacific Island language at home (30% speak English very well, 60% speak English well, 10% speak English not well).
1.6% of residents speak other language at home (32% speak English very well, 14% speak English well, 54% speak English not well).
Foreign born population: 1,758 (11.9%)
(57.6% of them are naturalized citizens)
| Here: | 6.7 |
| State: | 6.8 |
| Here: | 3.4 |
| State: | 4.3 |

- Bedrooms in owner-occupied houses and condos in Whitehall, Pennsylvania
- 17no bedroom
- 81 bedroom
- 6812 bedrooms
- 3,2843 bedrooms
- 9124 bedrooms
- 1125+ bedrooms

- Bedrooms in renter-occupied apartments in Whitehall, Pennsylvania
- 170no bedroom
- 7621 bedroom
- 6852 bedrooms
- 1013 bedrooms
- 304 bedrooms
- 05+ bedrooms

- Cars and other vehicles available in Whitehall in owner-occupied houses/condos
- 164no vehicle
- 1,5861 vehicle
- 2,7052 vehicles
- 3753 vehicles
- 1234 vehicles
- 585+ vehicles

- Cars and other vehicles available in Whitehall in renter-occupied apartments
- 551no vehicle
- 1,1021 vehicle
- 582 vehicles
- 353 vehicles
- 04 vehicles
- 05+ vehicles

- Rooms in owner-occupied houses in Whitehall, Pennsylvania
- 171 room
- 02 rooms
- 333 rooms
- 2744 rooms
- 6165 rooms
- 1,3436 rooms
- 1,2757 rooms
- 7768 rooms
- 6789+ rooms

- Rooms in renter-occupied apartments in Whitehall, Pennsylvania
- 1471 room
- 2872 rooms
- 4653 rooms
- 5414 rooms
- 1325 rooms
- 1176 rooms
- 307 rooms
- 178 rooms
- 109+ rooms


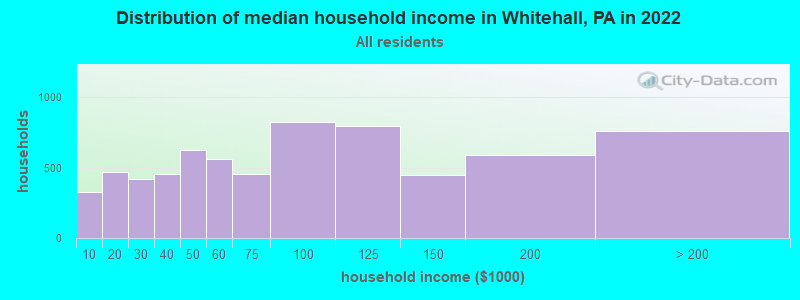
Whitehall, PA household income distribution

- 330Less than $10,000
- 468$10,000 to $19,999
- 419$20,000 to $29,999
- 454$30,000 to $39,999
- 623$40,000 to $49,999
- 561$50,000 to $59,999
- 452$60,000 to $74,999
- 825$75,000 to $99,999
- 796$100,000 to $124,999
- 449$125,000 to $149,999
- 588$150,000 to $199,999
- 764$200,000 or more
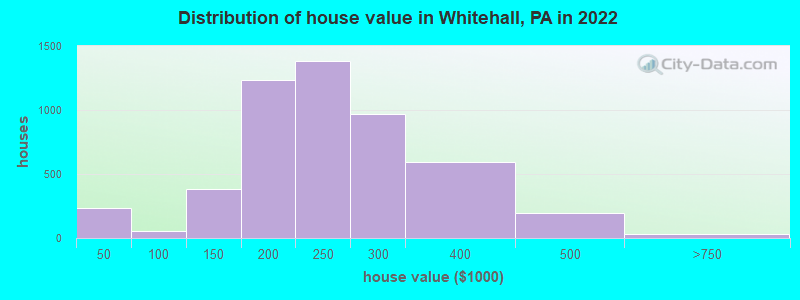
Home value of owner - occupied houses in 2022 in Whitehall, PA
-
- 109Less than $10,000
- 12$10,000 to $14,999
- 39$15,000 to $19,999
- 22$20,000 to $24,999
- 52$30,000 to $34,999
- 6$50,000 to $59,999
- 17$70,000 to $79,999
- 11$80,000 to $89,999
- 20$90,000 to $99,999
- 172$100,000 to $124,999
- 212$125,000 to $149,999
- 567$150,000 to $174,999
- 663$175,000 to $199,999
- 1,380$200,000 to $249,999
- 965$250,000 to $299,999
- 593$300,000 to $399,999
- 194$400,000 to $499,999
- 19$500,000 to $749,999
- 11$2,000,000 or more
Rent paid by renters in 2022 in Whitehall, PA
-
- 45$450 to $499
- 65$500 to $549
- 46$550 to $599
- 82$600 to $649
- 434$650 to $699
- 85$700 to $749
- 149$750 to $799
- 212$800 to $899
- 131$900 to $999
- 110$1,000 to $1,249
- 227$1,250 to $1,499
- 124$1,500 to $1,999
- 14$2,000 to $2,499
- 24No cash rent


Percentage of workers working in this county: 94.6%
Number of people working at home: 1,094 (15.5% of all workers)
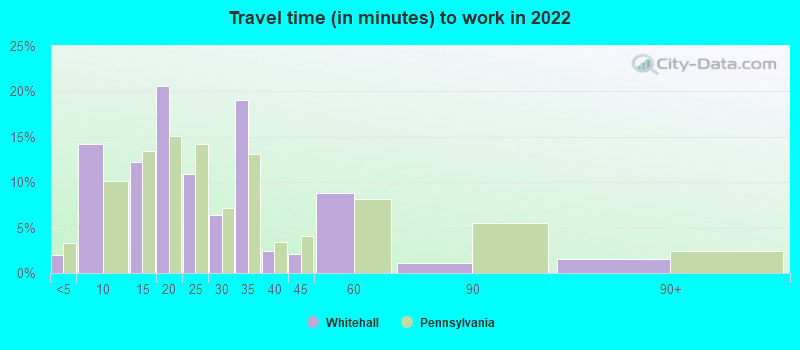
Travel time to work (commute)
- Less than 5 minutes: 118
- 5 to 9 minutes: 341
- 10 to 14 minutes: 451
- 15 to 19 minutes: 549
- 20 to 24 minutes: 1,285
- 25 to 29 minutes: 368
- 30 to 34 minutes: 1,121
- 35 to 39 minutes: 89
- 40 to 44 minutes: 207
- 45 to 59 minutes: 699
- 60 to 89 minutes: 383
- 90 or more minutes: 122
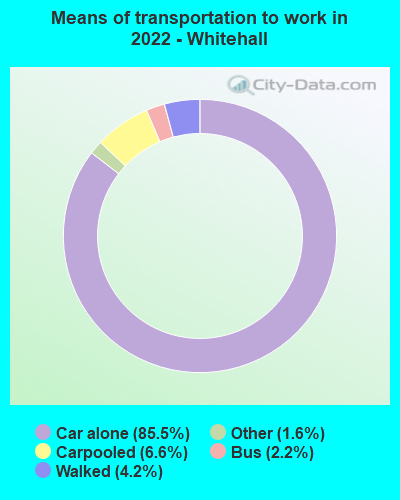
Means of transportation to work:
- Drove a car alone: 2,307 (63.5%)
- Carpooled: 171 (4.7%)
- Bus: 42 (1.2%)
- Taxi: 51 (1.4%)
- Walked: 121 (3.3%)
- Worked at home: 1,094 (30.1%)

- Unemployment by race in 2022
- Unemployment rate for White non-Hispanic residents
- 6.6%Males
- 3.3%Females

- Year of entry for the foreign-born population in Whitehall, Pennsylvania
- 1,1702010 or later
- 2272000 to 2009
- 1091990 to 1999
- 531980 to 1989
- 721970 to 1979
- 167Before 1970

First ancestries reported:
- Italian: 857 (13.9%)
- German: 846 (13.7%)
- Irish: 432 (7.0%)
- English: 342 (5.6%)
- American: 328 (5.3%)
- Polish: 302 (4.9%)
- Turkish: 143 (2.3%)
- Slovak: 107 (1.7%)
- Serbian: 105 (1.7%)
- Hungarian: 89 (1.4%)
- European: 86 (1.4%)
- French Canadian: 54 (0.9%)
- Scotch-Irish: 50 (0.8%)
- Scottish: 43 (0.7%)
- Nigerian: 35 (0.6%)
- Ukrainian: 33 (0.5%)
- Croatian: 32 (0.5%)
- African: 32 (0.5%)
- Jamaican: 30 (0.5%)
- Norwegian: 29 (0.5%)
- Greek: 23 (0.4%)
- Syrian: 21 (0.3%)
- Palestinian: 18 (0.3%)
- Lithuanian: 13 (0.2%)
- Russian: 12 (0.2%)
- Canadian: 11 (0.2%)
- Finnish: 11 (0.2%)
- Slavic: 11 (0.2%)
- Austrian: 10 (0.2%)
- Swiss: 10 (0.2%)
- Czech: 7 (0.1%)
- Eastern European: 7 (0.1%)
- Welsh: 6 (0.10%)
Most common places of birth for foreign-born residents (%):
| Whitehall: | 35.4% (698) |
| Pennsylvania: | 0.8% (7,882) |
| Whitehall: | 27.1% (534) |
| Pennsylvania: | 0.7% (6,855) |
| Whitehall: | 7.6% (150) |
| Pennsylvania: | 10.7% (100,596) |
| Whitehall: | 4.3% (85) |
| Pennsylvania: | 0.5% (5,121) |
| Whitehall: | 3.2% (64) |
| Pennsylvania: | 0.6% (6,097) |
| Whitehall: | 3.1% (61) |
| Pennsylvania: | 2.2% (21,039) |
| Whitehall: | 2.6% (51) |
| Pennsylvania: | 0.1% (731) |
| Whitehall: | 2.5% (49) |
| Pennsylvania: | 0.5% (4,491) |
| Whitehall: | 2.4% (47) |
| Pennsylvania: | 1.1% (10,709) |
| Whitehall: | 2.3% (45) |
| Pennsylvania: | 2.4% (22,612) |
| Whitehall: | 2.0% (40) |
| Pennsylvania: | 1.8% (17,032) |
| Whitehall: | 1.9% (37) |
| Pennsylvania: | 1.8% (16,884) |
| Whitehall: | 1.7% (34) |
| Pennsylvania: | 3.3% (31,542) |
| Whitehall: | 1.7% (34) |
| Pennsylvania: | 0.1% (707) |
Place of birth for U.S.-born residents:
- This state: 11,572
- Other state: 1,307
- Northeast: 359
- Midwest: 427
- South: 326
- West: 191
95.2% of Whitehall residents lived in the same house 1 years ago.
Out of people who lived in different houses, 47.4% lived in this county.
Out of people who lived in different counties, 4.5% lived in Pennsylvania.
| Whitehall: | 95.2% |
| State average: | 89.3% |
Education attainment for males 25 years and older:
- No schooling: 83
- Nursery to 4th grade: 0
- 5th and 6th grade: 0
- 7th and 8th grade: 0
- 9th grade: 32
- 10th grade: 27
- 11th grade: 116
- 12th grade, no diploma: 87
- High school graduate (or equivalency): 1,411
- Less than 1 year of college: 268
- Some college more than 1 year, no degree: 492
- Associate degree: 471
- Bachelor's degree: 1,366
- Master's degree: 645
- Professional school degree: 281
- Doctorate degree: 86

Education attainment for females 25 years and older:
- No schooling: 232
- Nursery to 4th grade: 0
- 5th and 6th grade: 22
- 7th and 8th grade: 19
- 9th grade: 20
- 10th grade: 22
- 11th grade: 7
- 12th grade, no diploma: 140
- High school graduate (or equivalency): 1,556
- Less than 1 year of college: 429
- Some college more than 1 year, no degree: 648
- Associate degree: 672
- Bachelor's degree: 1,682
- Master's degree: 432
- Professional school degree: 67
- Doctorate degree: 113


Housing units in structures:
- One, detached: 4,555
- One, attached: 778
- Two: 128
- 3 or 4: 202
- 5 to 9: 69
- 10 to 19: 331
- 20 to 49: 269
- 50 or more: 833
- Mobile homes: 9
Housing units lacking complete kitchen facilities in 2022: 3.5%
House/condo owner moved in on average 13 years ago
Renter moved in on average 5 years ago

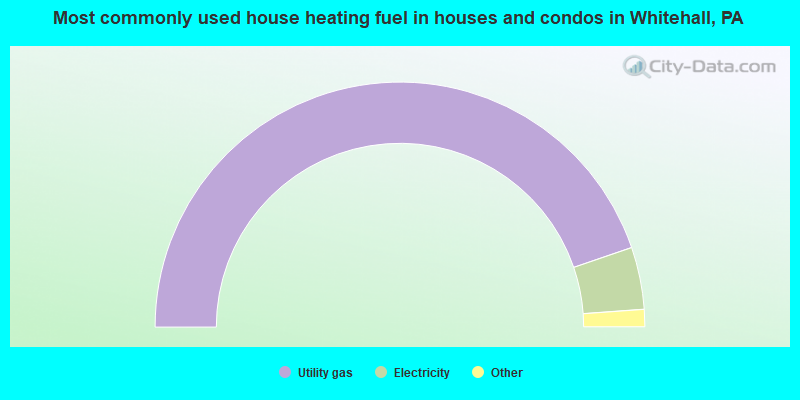
- 89.6%Utility gas
- 8.2%Electricity
- 1.9%Bottled, tank, or LP gas
- 0.4%Fuel oil, kerosene, etc.
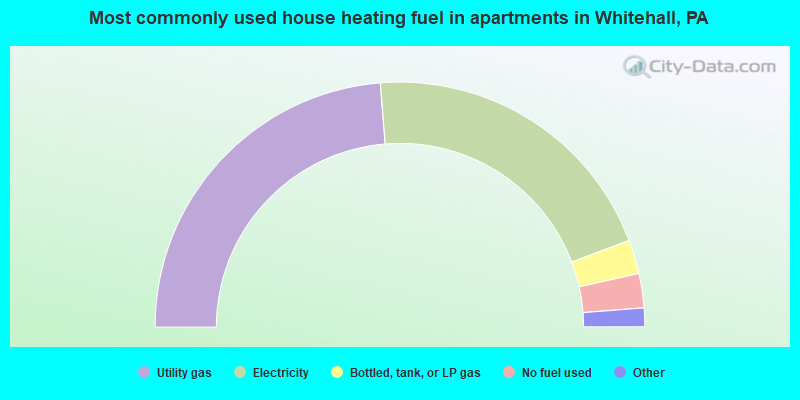
- 47.5%Utility gas
- 41.1%Electricity
- 4.5%Bottled, tank, or LP gas
- 4.5%No fuel used
- 1.4%Fuel oil, kerosene, etc.
- 1.1%Other fuel
Private vs. public school enrollment:
| Here: | 10.2% |
| Pennsylvania: | 15.7% |
| Here: | 3.2% |
| Pennsylvania: | 13.4% |
| Here: | 26.6% |
| Pennsylvania: | 39.8% |


