Races in Whitehall, Pennsylvania (PA) Detailed Stats
Data:
Races - White alone (%)
Races - White alone (% change since 2000)
Races - Black alone (%)
Races - Black alone (% change since 2000)
Races - American Indian alone (%)
Races - American Indian alone (% change since 2000)
Races - Asian alone (%)
Races - Asian alone (% change since 2000)
Races - Hispanic (%)
Races - Hispanic (% change since 2000)
Races - Native Hawaiian and Other Pacific Islander alone (%)
Races - Native Hawaiian and Other Pacific Islander alone (% change since 2000)
Races - Two or more races(%)
Races - Two or more races(% change since 2000)
Races - Other race alone (%)
Races - Other race alone (% change since 2000)
Racial diversity
Place of birth - Born in state of residence (%)
Place of birth - Born in state of residence (%) - White
Place of birth - Born in state of residence (%) - Black or African American
Place of birth - Born in state of residence (%) - Asian
Place of birth - Born in state of residence (%) - Hispanic or Latino
Place of birth - Born in state of residence (%) - American Indian and Alaska Native
Place of birth - Born in state of residence (%) - Multirace
Place of birth - Born in state of residence (%) - Other Race
Place of birth - Born in other state (%)
Place of birth - Born in other state (%) - White
Place of birth - Born in other state (%) - Black or African American
Place of birth - Born in other state (%) - Asian
Place of birth - Born in other state (%) - Hispanic or Latino
Place of birth - Born in other state (%) - American Indian and Alaska Native
Place of birth - Born in other state (%) - Multirace
Place of birth - Born in other state (%) - Other Race
Place of birth - Native, outside of US (%)
Place of birth - Native, outside of US (%) - White
Place of birth - Native, outside of US (%) - Black or African American
Place of birth - Native, outside of US (%) - Asian
Place of birth - Native, outside of US (%) - Hispanic or Latino
Place of birth - Native, outside of US (%) - American Indian and Alaska Native
Place of birth - Native, outside of US (%) - Multirace
Place of birth - Native, outside of US (%) - Other Race
Place of birth - Foreign born (%)
Place of birth - Foreign born (%) - White
Place of birth - Foreign born (%) - Black or African American
Place of birth - Foreign born (%) - Asian
Place of birth - Foreign born (%) - Hispanic or Latino
Place of birth - Foreign born (%) - American Indian and Alaska Native
Place of birth - Foreign born (%) - Multirace
Place of birth - Foreign born (%) - Other Race
Residents speaking English at home (%)
Residents speaking English at home - Born in the United States (%)
Residents speaking English at home - Native, born elsewhere (%)
Residents speaking English at home - Foreign born (%)
Residents speaking Spanish at home (%)
Residents speaking Spanish at home - Born in the United States (%)
Residents speaking Spanish at home - Native, born elsewhere (%)
Residents speaking Spanish at home - Foreign born (%)
Residents speaking other language at home (%)
Residents speaking other language at home - Born in the United States (%)
Residents speaking other language at home - Native, born elsewhere (%)
Residents speaking other language at home - Foreign born (%)
Marital status - Never married (%)
Marital status - Now married (%)
Marital status - Separated (%)
Marital status - Widowed (%)
Marital status - Divorced (%)
Ancestries Reported - Arab (%)
Ancestries Reported - Czech (%)
Ancestries Reported - Danish (%)
Ancestries Reported - Dutch (%)
Ancestries Reported - English (%)
Ancestries Reported - French (%)
Ancestries Reported - French Canadian (%)
Ancestries Reported - German (%)
Ancestries Reported - Greek (%)
Ancestries Reported - Hungarian (%)
Ancestries Reported - Irish (%)
Ancestries Reported - Italian (%)
Ancestries Reported - Lithuanian (%)
Ancestries Reported - Norwegian (%)
Ancestries Reported - Polish (%)
Ancestries Reported - Portuguese (%)
Ancestries Reported - Russian (%)
Ancestries Reported - Scotch-Irish (%)
Ancestries Reported - Scottish (%)
Ancestries Reported - Slovak (%)
Ancestries Reported - Subsaharan African (%)
Ancestries Reported - Swedish (%)
Ancestries Reported - Swiss (%)
Ancestries Reported - Ukrainian (%)
Ancestries Reported - United States (%)
Ancestries Reported - Welsh (%)
Ancestries Reported - West Indian (%)
Ancestries Reported - Other (%)
Geographical mobility - Same house 1 year ago (%)
Geographical mobility - Same house 1 year ago (%) - White
Geographical mobility - Same house 1 year ago (%) - Black or African American
Geographical mobility - Same house 1 year ago (%) - Asian
Geographical mobility - Same house 1 year ago (%) - Hispanic or Latino
Geographical mobility - Same house 1 year ago (%) - American Indian and Alaska Native
Geographical mobility - Same house 1 year ago (%) - Multirace
Geographical mobility - Same house 1 year ago (%) - Other Race
Geographical mobility - Moved within same county (%)
Geographical mobility - Moved within same county (%) - White
Geographical mobility - Moved within same county (%) - Black or African American
Geographical mobility - Moved within same county (%) - Asian
Geographical mobility - Moved within same county (%) - Hispanic or Latino
Geographical mobility - Moved within same county (%) - American Indian and Alaska Native
Geographical mobility - Moved within same county (%) - Multirace
Geographical mobility - Moved within same county (%) - Other Race
Geographical mobility - Moved from different county within same state (%)
Geographical mobility - Moved from different county within same state (%) - White
Geographical mobility - Moved from different county within same state (%) - Black or African American
Geographical mobility - Moved from different county within same state (%) - Asian
Geographical mobility - Moved from different county within same state (%) - Hispanic or Latino
Geographical mobility - Moved from different county within same state (%) - American Indian and Alaska Native
Geographical mobility - Moved from different county within same state (%) - Multirace
Geographical mobility - Moved from different county within same state (%) - Other Race
Geographical mobility - Moved from different state (%)
Geographical mobility - Moved from different state (%) - White
Geographical mobility - Moved from different state (%) - Black or African American
Geographical mobility - Moved from different state (%) - Asian
Geographical mobility - Moved from different state (%) - Hispanic or Latino
Geographical mobility - Moved from different state (%) - American Indian and Alaska Native
Geographical mobility - Moved from different state (%) - Multirace
Geographical mobility - Moved from different state (%) - Other Race
Geographical mobility - Moved from abroad (%)
Geographical mobility - Moved from abroad (%) - White
Geographical mobility - Moved from abroad (%) - Black or African American
Geographical mobility - Moved from abroad (%) - Asian
Geographical mobility - Moved from abroad (%) - Hispanic or Latino
Geographical mobility - Moved from abroad (%) - American Indian and Alaska Native
Geographical mobility - Moved from abroad (%) - Multirace
Geographical mobility - Moved from abroad (%) - Other Race
Place of birth for the foreign-born population - Ireland (%)
Place of birth for the foreign-born population - Denmark (%)
Place of birth for the foreign-born population - Norway (%)
Place of birth for the foreign-born population - Sweden (%)
Place of birth for the foreign-born population - United Kingdom (%)
Place of birth for the foreign-born population - England (%)
Place of birth for the foreign-born population - Scotland (%)
Place of birth for the foreign-born population - Other Northern Europe (%)
Place of birth for the foreign-born population - Austria (%)
Place of birth for the foreign-born population - Belgium (%)
Place of birth for the foreign-born population - France (%)
Place of birth for the foreign-born population - Germany (%)
Place of birth for the foreign-born population - Netherlands (%)
Place of birth for the foreign-born population - Switzerland (%)
Place of birth for the foreign-born population - Other Western Europe (%)
Place of birth for the foreign-born population - Greece (%)
Place of birth for the foreign-born population - Italy (%)
Place of birth for the foreign-born population - Portugal (%)
Place of birth for the foreign-born population - Spain (%)
Place of birth for the foreign-born population - Other Southern Europe (%)
Place of birth for the foreign-born population - Albania (%)
Place of birth for the foreign-born population - Belarus (%)
Place of birth for the foreign-born population - Bosnia and Herzegovina (%)
Place of birth for the foreign-born population - Bulgaria (%)
Place of birth for the foreign-born population - Croatia (%)
Place of birth for the foreign-born population - Czechoslovakia (%)
Place of birth for the foreign-born population - Hungary (%)
Place of birth for the foreign-born population - Latvia (%)
Place of birth for the foreign-born population - Lithuania (%)
Place of birth for the foreign-born population - North Macedonia (Macedonia) (%)
Place of birth for the foreign-born population - Moldova (%)
Place of birth for the foreign-born population - Poland (%)
Place of birth for the foreign-born population - Romania (%)
Place of birth for the foreign-born population - Russia (%)
Place of birth for the foreign-born population - Serbia (%)
Place of birth for the foreign-born population - Ukraine (%)
Place of birth for the foreign-born population - Other Eastern Europe (%)
Place of birth for the foreign-born population - China (%)
Place of birth for the foreign-born population - Hong Kong (%)
Place of birth for the foreign-born population - Taiwan (%)
Place of birth for the foreign-born population - Japan (%)
Place of birth for the foreign-born population - Korea (%)
Place of birth for the foreign-born population - Other Eastern Asia (%)
Place of birth for the foreign-born population - Afghanistan (%)
Place of birth for the foreign-born population - Bangladesh (%)
Place of birth for the foreign-born population - India (%)
Place of birth for the foreign-born population - Iran (%)
Place of birth for the foreign-born population - Kazakhstan (%)
Place of birth for the foreign-born population - Nepal (%)
Place of birth for the foreign-born population - Pakistan (%)
Place of birth for the foreign-born population - Sri Lanka (%)
Place of birth for the foreign-born population - Uzbekistan (%)
Place of birth for the foreign-born population - Other South Central Asia (%)
Place of birth for the foreign-born population - Burma (%)
Place of birth for the foreign-born population - Cambodia (%)
Place of birth for the foreign-born population - Indonesia (%)
Place of birth for the foreign-born population - Laos (%)
Place of birth for the foreign-born population - Malaysia (%)
Place of birth for the foreign-born population - Philippines (%)
Place of birth for the foreign-born population - Singapore (%)
Place of birth for the foreign-born population - Thailand (%)
Place of birth for the foreign-born population - Vietnam (%)
Place of birth for the foreign-born population - Other South Eastern Asia (%)
Place of birth for the foreign-born population - Armenia (%)
Place of birth for the foreign-born population - Iraq (%)
Place of birth for the foreign-born population - Israel (%)
Place of birth for the foreign-born population - Jordan (%)
Place of birth for the foreign-born population - Kuwait (%)
Place of birth for the foreign-born population - Lebanon (%)
Place of birth for the foreign-born population - Saudi Arabia (%)
Place of birth for the foreign-born population - Syria (%)
Place of birth for the foreign-born population - Turkey (%)
Place of birth for the foreign-born population - Yemen (%)
Place of birth for the foreign-born population - Other Western Asia (%)
Place of birth for the foreign-born population - Eritrea (%)
Place of birth for the foreign-born population - Ethiopia (%)
Place of birth for the foreign-born population - Kenya (%)
Place of birth for the foreign-born population - Somalia (%)
Place of birth for the foreign-born population - Uganda (%)
Place of birth for the foreign-born population - Zimbabwe (%)
Place of birth for the foreign-born population - Other Eastern Africa (%)
Place of birth for the foreign-born population - Cameroon (%)
Place of birth for the foreign-born population - Congo (%)
Place of birth for the foreign-born population - Democratic Republic of Congo (Zaire) (%)
Place of birth for the foreign-born population - Other Middle Africa (%)
Place of birth for the foreign-born population - Egypt (%)
Place of birth for the foreign-born population - Morocco (%)
Place of birth for the foreign-born population - Sudan (%)
Place of birth for the foreign-born population - Other Northern Africa (%)
Place of birth for the foreign-born population - South Africa (%)
Place of birth for the foreign-born population - Other Southern Africa (%)
Place of birth for the foreign-born population - Cabo Verde (%)
Place of birth for the foreign-born population - Ghana (%)
Place of birth for the foreign-born population - Liberia (%)
Place of birth for the foreign-born population - Nigeria (%)
Place of birth for the foreign-born population - Senegal (%)
Place of birth for the foreign-born population - Sierra Leone (%)
Place of birth for the foreign-born population - Other Western Africa (%)
Place of birth for the foreign-born population - Australia (%)
Place of birth for the foreign-born population - New Zealand (%)
Place of birth for the foreign-born population - Fiji (%)
Place of birth for the foreign-born population - Micronesia (%)
Place of birth for the foreign-born population - Bahamas (%)
Place of birth for the foreign-born population - Barbados (%)
Place of birth for the foreign-born population - Cuba (%)
Place of birth for the foreign-born population - Dominica (%)
Place of birth for the foreign-born population - Dominican Republic (%)
Place of birth for the foreign-born population - Grenada (%)
Place of birth for the foreign-born population - Haiti (%)
Place of birth for the foreign-born population - Jamaica (%)
Place of birth for the foreign-born population - St. Vincent and the Grenadines (%)
Place of birth for the foreign-born population - Trinidad and Tobago (%)
Place of birth for the foreign-born population - West Indies (%)
Place of birth for the foreign-born population - Other Caribbean (%)
Place of birth for the foreign-born population - Belize (%)
Place of birth for the foreign-born population - Costa Rica (%)
Place of birth for the foreign-born population - El Salvador (%)
Place of birth for the foreign-born population - Guatemala (%)
Place of birth for the foreign-born population - Honduras (%)
Place of birth for the foreign-born population - Mexico (%)
Place of birth for the foreign-born population - Nicaragua (%)
Place of birth for the foreign-born population - Panama (%)
Place of birth for the foreign-born population - Other Central America (%)
Place of birth for the foreign-born population - Argentina (%)
Place of birth for the foreign-born population - Bolivia (%)
Place of birth for the foreign-born population - Brazil (%)
Place of birth for the foreign-born population - Chile (%)
Place of birth for the foreign-born population - Colombia (%)
Place of birth for the foreign-born population - Ecuador (%)
Place of birth for the foreign-born population - Guyana (%)
Place of birth for the foreign-born population - Peru (%)
Place of birth for the foreign-born population - Uruguay (%)
Place of birth for the foreign-born population - Venezuela (%)
Place of birth for the foreign-born population - Other South America (%)
Place of birth for the foreign-born population - Canada (%)
Place of birth for the foreign-born population - Other Northern America (%)
Place of birth for the foreign-born population - Other (%)
Latest news about races in Whitehall, PA collected exclusively by city-data.com from local newspapers, TV, and radio stations
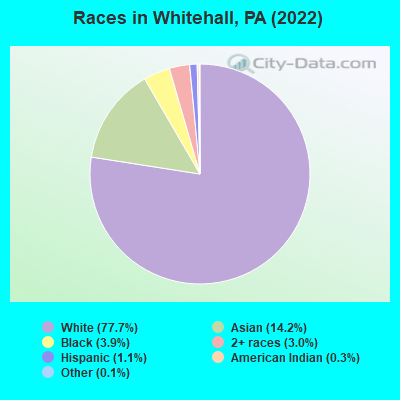
According to 2022 data, the most numerous races in Whitehall, PA are White alone (11,474 residents), Black alone (580 residents), and Hispanic (158 residents). 84.2% of Whitehall residents speak English at home. 13.4% of Whitehall, PA residents are foreign-born (10.8% born in Asia), which is 47.6% greater than the foreign-born rate of 7.0% across the entire state of Pennsylvania.
Race distribution in Whitehall
2000 2022
10,322,455 84.1% White alone 1,202,437 9.8% Black alone 394,088 3.2% Hispanic 218,296 1.8% Asian alone 113,097 0.9% Two or more races 13,086 0.1% Other race alone 14,904 0.1% American Indian alone 2,691 0.02% Native Hawaiian and Other
9,487,228 73.1% White alone 1,311,581 10.1% Black alone 1,115,997 8.6% Hispanic 493,942 3.8% Two or more races 487,124 3.8% Asian alone 63,582 0.5% Other race alone 10,130 0.08% American Indian alone 2,424 0.02% Native Hawaiian and Other
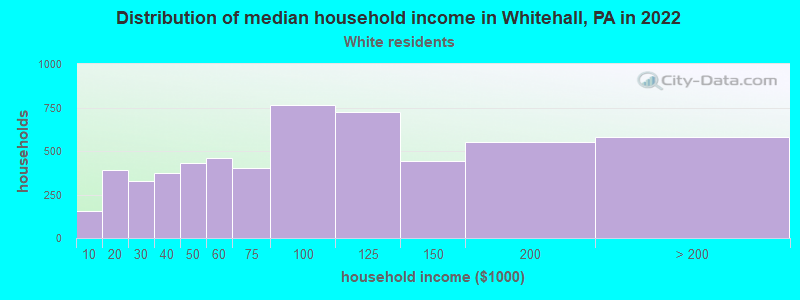
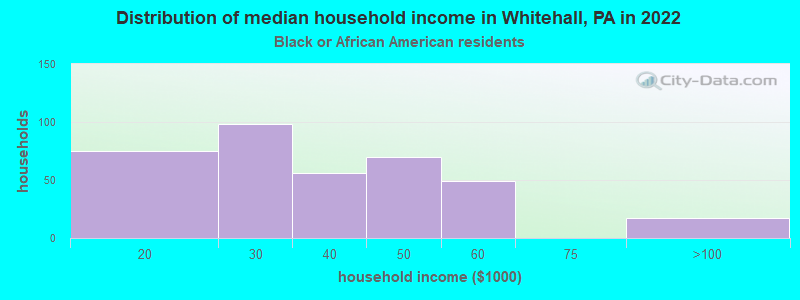
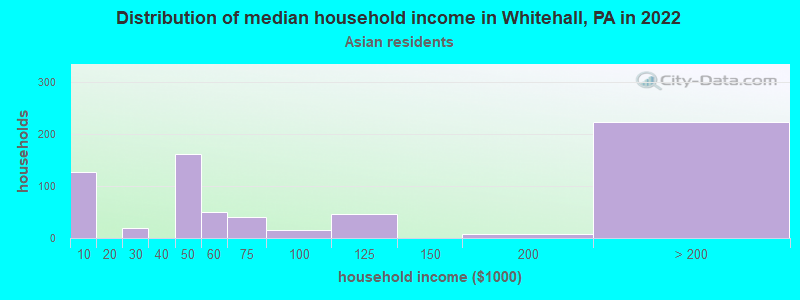
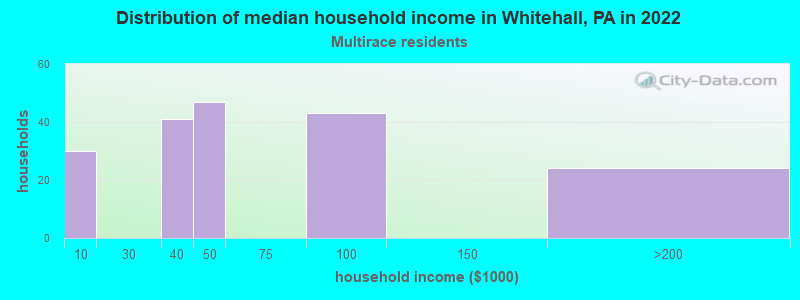
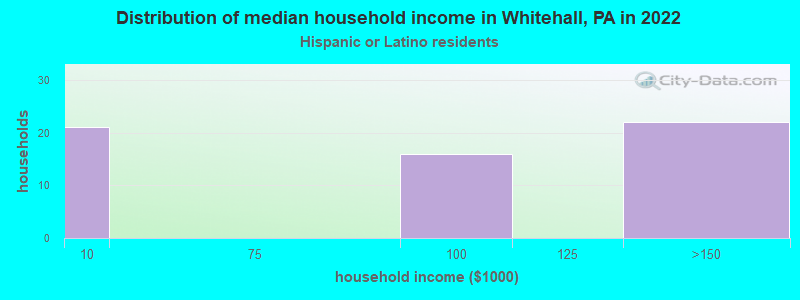
Income and house value in Whitehall Median household income in 2022 $83,439 White non-Hispanic householders$35,828 Black householdersMedian 2022 house value $238,553 White Non-Hispanic householders $811,405 Asian householders$104,323 Two or more races householders
Median age by race in Whitehall
53.3 Median age for White residents50.3 56.3 35.2 Median age for Black or African American residents26.6 59.3 -642,857,142.2 Median age for American Indian / Alaska Native residents-714,583,332.6 -577,519,379.3 33.0 Median age for Asian residents33.9 33.4 -656,534,953.8 Median age for Native Hawaiian / Pacific Islander residents-919,148,935.3 -747,474,746.7 -700,529,099.8 Median age for Other race residents-689,440,993.1 -681,623,930.9 17.5 Median age for Two or more races residents18.4 19.0 53.1 Median age for White alone residents49.8 56.2 50.1 Median age for Hispanic or Latino residents49.9 44.2
Owner/renter occupied households by race in Whitehall
House owners and renters - White residents 4,577 81.9% Owner occupied1,010 18.1% Renter occupiedHouse owners and renters - Black or African American residents 52 13.6% Owner occupied334 86.4% Renter occupiedHouse owners and renters - Asian residents 306 51.7% Owner occupied286 48.3% Renter occupiedHouse owners and renters - Two or more races residents 92 53.3% Owner occupied81 46.7% Renter occupiedHouse owners and renters - White alone residents 4,541 81.7% Owner occupied1,014 18.3% Renter occupiedHouse owners and renters - Hispanic or Latino residents 47 65.7% Owner occupied24 34.3% Renter occupied
Language usage in Whitehall
English speakers - Total 84.2% of residents of Whitehall speak English at home.
0.7% of residents speak Spanish at home 89 90.8% Speak English very well9 9.2% Speak English less than very well16.1% of residents speak other language at home 651 29.3% Speak English very well1,574 70.7% Speak English less than very well
English speakers - Born in the United States 93.0% of residents of Whitehall speak English at home.
0.9% of residents speak Spanish at home 5 41.7% Speak English very well7 58.3% Speak English less than very well5.0% of residents speak other language at home 24 37.5% Speak English very well40 62.5% Speak English less than very well
English speakers - Native, born elsewhere 0.0% of residents of Whitehall speak English at home.
144.4% of residents speak Spanish at home 13 100.0% Speak English very well
English speakers - Foreign-born 8.6% of residents of Whitehall speak English at home.
0.4% of residents speak Spanish at home 7 100.0% Speak English very well92.3% of residents speak other language at home 498 30.7% Speak English very well1,124 69.3% Speak English less than very well
White (Caucasian) - Speak only English Native:
98.7% (10,623)Foreign-born:
19.2% (39)
White (Caucasian) - Speak another language Native:
1.3% (139)Foreign-born:
79.5% (163)
Black or African American - Speak only English Native:
100.0% (380)Foreign-born:
37.2% (46)
Asian - Speak another language Native:
100.0% (377)Foreign-born:
95.1% (1,344)
Two or more races - Speak another language Native:
8.9% (39)Foreign-born:
100.0% (9)
White alone - Speak only English Native:
98.7% (10,578)Foreign-born:
18.2% (40)
White alone - Speak another language Native:
1.2% (131)Foreign-born:
82.0% (181)
Hispanic or Latino - Speak another language Native:
30.2% (45)Foreign-born:
100.0% (7)
Foreign-born residents in Whitehall 1,974 residents are foreign born (10.8% Asia ).
This city:
13.4%Pennsylvania:
7.3%
Marital status for residents in Whitehall Marital status - White (Caucasian) population 15 years and over
Males 28.7% Never married54.8% Now married1.4% Separated5.6% Widowed9.4% DivorcedFemales 22.0% Never married50.6% Now married0.8% Separated15.8% Widowed10.8% DivorcedWomen who gave birth in the past 12 months Now married:
100.0% (208)Unmarried:
0.0% (0)
Women who did not give birth in the past 12 months Now married:
49.6% (864)Unmarried:
50.4% (877)
Marital status - Black or African American population 15 years and over
Males 74.4% Never married11.9% Now married0.0% Separated0.0% Widowed13.7% DivorcedFemales 43.7% Never married20.4% Now married0.0% Separated4.8% Widowed31.1% DivorcedWomen who did not give birth in the past 12 months Now married:
63.0% (31)Unmarried:
37.0% (18)
Marital status - Asian population 15 years and over
Males 10.5% Never married78.9% Now married0.0% Separated0.0% Widowed10.6% DivorcedFemales 9.4% Never married66.2% Now married0.0% Separated11.1% Widowed13.3% DivorcedWomen who gave birth in the past 12 months Now married:
100.0% (77)Unmarried:
0.0% (0)
Women who did not give birth in the past 12 months Now married:
63.3% (252)Unmarried:
36.7% (146)
Marital status - Two or more races population 15 years and over
Males 3.9% Never married55.3% Now married0.0% Separated21.4% Widowed19.4% DivorcedFemales 2.1% Never married97.9% Now married0.0% Separated0.0% Widowed0.0% DivorcedWomen who gave birth in the past 12 months Now married:
100.0% (15)Unmarried:
0.0% (0)
Women who did not give birth in the past 12 months Now married:
97.1% (93)Unmarried:
2.9% (3)
Marital status - White alone, not Hispanic / Latino population 15 years and over
Males 28.4% Never married55.0% Now married1.4% Separated5.6% Widowed9.5% DivorcedFemales 21.5% Never married50.9% Now married0.8% Separated15.9% Widowed10.9% DivorcedWomen who gave birth in the past 12 months Now married:
100.0% (209)Unmarried:
0.0% (0)
Women who did not give birth in the past 12 months Now married:
50.0% (860)Unmarried:
50.0% (861)
Marital status - Hispanic or Latino population 15 years and over
Males 37.5% Never married31.9% Now married0.0% Separated30.6% Widowed0.0% DivorcedFemales 75.0% Never married25.0% Now married0.0% Separated0.0% Widowed0.0% DivorcedWomen who did not give birth in the past 12 months Now married:
26.9% (7)Unmarried:
73.1% (20)
Ancestries in Whitehall
857 13.9% Italian846 13.7% German432 7.0% Irish342 5.6% English328 5.3% American302 4.9% Polish143 2.3% Turkish107 1.7% Slovak105 1.7% Serbian89 1.4% Hungarian86 1.4% European54 0.9% French Canadian50 0.8% Scotch-Irish43 0.7% Scottish35 0.6% Nigerian33 0.5% Ukrainian32 0.5% Croatian32 0.5% African30 0.5% Jamaican29 0.5% Norwegian23 0.4% Greek21 0.3% Syrian18 0.3% Palestinian13 0.2% Lithuanian12 0.2% Russian11 0.2% Canadian11 0.2% Finnish11 0.2% Slavic10 0.2% Austrian10 0.2% Swiss7 0.1% Czech7 0.1% Eastern European6 0.10% Welsh
Children Nativity (place of birth) in Whitehall
Children under 6 years - Living with two parents Both parents native 712 100.0% NativeBoth parents foreign-born 165 100.0% NativeOne native, one foreign-born parent 28 100.0% NativeChildren under 6 years - Living with one parent Native parent 77 100.0% NativeForeign-born parent 194 100.0% NativeChildren 6 to 17 years - Living with two parents Both parents native 473 99.3% Native3 0.7% Foreign-bornBoth parents foreign-born 334 71.1% Native135 28.9% Foreign-bornChildren 6 to 17 years - Living with one parent Native parent 176 71.9% Native69 28.1% Foreign-bornForeign-born parent 54 94.0% Native3 6.0% Foreign-born
Grandparents responsible for own grandchildren in Whitehall
Grandparents (30 to 59 years) White / Caucasian 6 100.0% Not responsible for grandchildrenWhite alone, not Hispanic / Latino 6 100.0% Not responsible for grandchildrenGrandparents (60 years and over) White / Caucasian 15 37.4% Responsible for grandchildren25 62.6% Not responsible for grandchildrenWhite alone, not Hispanic / Latino 15 37.3% Responsible for grandchildren25 62.7% Not responsible for grandchildren