West Pensacola, FL (Florida) Houses and Residents
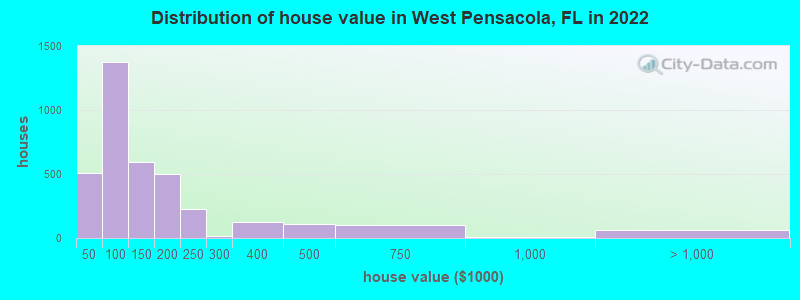
Estimated median house or condo value in 2022: $116,694 (it was $46,000 in 2000 )
West Pensacola:
$116,694Florida:
$354,100
Lower value quartile - upper value quartile: $76,869 - $187,843Total population: 21,339 (All urban)
Houses: 10,424 (8,885 occupied: 4,468 owner occupied, 4,715 renter occupied )
% of renters here:
51%State:
33%
Housing density: 1,415 houses/condos per square mile
Median price asked for vacant for-sale houses and condos in 2022: $565,169.
Median contract rent in 2022: $829 (lower quartile is $659, upper quartile is $1,125)
Median rent asked for vacant for-rent units in 2022: $877
Median gross rent in West Pensacola, FL in 2022: $1,091
Housing units in West Pensacola with a mortgage: 2,304 (105 second mortgage, 0 home equity loan, 104 both second mortgage and home equity loan )Houses without a mortgage: 23
Median household income for houses/condos with a mortgage: $57,341
Median household income for apartments without a mortgage: $35,370
Median monthly housing costs: $950
Data:
Median house or condo value ($)
Median house or condo value ($ change since 2000)
Median house or condo value ($) - White
Median house or condo value ($) - Black or African American
Median house or condo value ($) - Asian
Median house or condo value ($) - Hispanic or Latino
Median house or condo value ($) - American Indian and Alaska Native
Median house or condo value ($) - Multirace
Median house or condo value ($) - Other Race
Median price asked for mobile homes ($)
Household density (households per square mile)
Mean house or condo value by units in structure - 1, detached ($)
Mean house or condo value by units in structure - 1, attached ($)
Mean house or condo value by units in structure - 2 ($)
Mean house or condo value by units in structure by units in structure - 3 or 4 ($)
Mean house or condo value by units in structure - 5 or more ($)
Mean house or condo value by units in structure - Boat, RV, van, etc. ($)
Mean house or condo value by units in structure - Mobile home ($)
Median contract rent ($)
Median contract rent - Lower quartile ($)
Median contract rent - Upper quartile ($)
Median gross rent ($)
Urban houses (%)
Rural houses (%)
Houses occupied (%)
Houses occupied (% change since 2000)
Houses owner occupied (%)
Houses owner occupied (% change since 2000)
Houses renter occupied (%)
Houses renter occupied (% change since 2000)
Vacant housing units - For rent (%)
Vacant housing units - For rent (% change since 2000)
Vacant housing units - For sale only (%)
Vacant housing units - For sale only (% change since 2000)
Vacant housing units - Rented or sold, not occupied (%)
Vacant housing units - Rented or sold, not occupied (% change since 2000)
Vacant housing units - For seasonal, recreational, or occasional use (%)
Vacant housing units - For seasonal, recreational, or occasional use (% change since 2000)
Vacant housing units - For migrant workers (%)
Vacant housing units - For migrant workers (% change since 2000)
Vacant housing units - Other vacant (%)
Vacant housing units - Other vacant (% change since 2000)
Median monthly housing costs ($)
Median household income for houses/condos with a mortgage ($)
Median household income for houses/condos without a mortgage ($)
Median household income ($)
Median household income ($) - White
Median household income ($) - Black or African American
Median household income ($) - Asian
Median household income ($) - Hispanic or Latino
Median household income ($) - American Indian and Alaska Native
Median household income ($) - Multirace
Median household income ($) - Other Race
Mortgage status - with mortgage (%)
Mortgage status - with second mortgage (%)
Mortgage status - with home equity loan (%)
Mortgage status - with both second mortgage and home equity loan (%)
Mortgage status - without a mortgage (%)
Median year house/condo built
Median year apartment built
Household type by relationship - Male householder living alone (%)
Household type by relationship - Male householder not living alone (%)
Household type by relationship - Female householder living alone (%)
Household type by relationship - Female householder not living alone (%)
Household type by relationship - Opposite-Sex spouse (%)
Household type by relationship - Same-Sex spouse (%)
Household type by relationship - Opposite-Sex unmarried partner (%)
Household type by relationship - Same-Sex unmarried partner (%)
Household type by relationship - In group quarters (%)
Size of family households - 2-person household (%)
Size of family households - 3-person household (%)
Size of family households - 4-person household (%)
Size of family households - 5-person household (%)
Size of family households - 6-person household (%)
Size of family households - 7-or-more-person household (%)
Size of nonfamily households - 1-person household (%)
Size of nonfamily households - 2-person household (%)
Size of nonfamily households - 3-person household (%)
Size of nonfamily households - 4-person household (%)
Size of nonfamily households - 5-person household (%)
Size of nonfamily households - 6-person household (%)
Size of nonfamily households - 7-or-moreperson household (%)
Year house built - Built 2010 or later (%)
Year house built - Built 2000 to 2009 (%)
Year house built - Built 1990 to 1999 (%)
Year house built - Built 1980 to 1989 (%)
Year house built - Built 1970 to 1979 (%)
Year house built - Built 1960 to 1969 (%)
Year house built - Built 1950 to 1959 (%)
Year house built - Built 1940 to 1949 (%)
Year house built - Built 1939 or earlier (%)
Median number of rooms in houses and condos
Median number of rooms in apartments
Median number of bedrooms in owner occupied houses
Mean number of bedrooms in owner occupied houses
Median number of bedrooms in renter occupied houses
Mean number of bedrooms in renter occupied houses
Median number of vehichles in owner occupied houses
Mean number of vehichles in owner occupied houses
Median number of vehichles in renter occupied houses
Mean number of vehichles in renter occupied houses
Rooms in owner-occupied houses - 1 room (%)
Rooms in owner-occupied houses - 2 rooms (%)
Rooms in owner-occupied houses - 3 rooms (%)
Rooms in owner-occupied houses - 4 rooms (%)
Rooms in owner-occupied houses - 5 rooms (%)
Rooms in owner-occupied houses - 6 rooms (%)
Rooms in owner-occupied houses - 7 rooms (%)
Rooms in owner-occupied houses - 8 rooms (%)
Rooms in owner-occupied houses - 9+ rooms (%)
Rooms in renter-occupied houses - 1 room (%)
Rooms in renter-occupied houses - 2 rooms (%)
Rooms in renter-occupied houses - 3 rooms (%)
Rooms in renter-occupied houses - 4 rooms (%)
Rooms in renter-occupied houses - 5 rooms (%)
Rooms in renter-occupied houses - 6 rooms (%)
Rooms in renter-occupied houses - 7 rooms (%)
Rooms in renter-occupied houses - 8 rooms (%)
Rooms in renter-occupied houses - 9+ rooms (%)
Bedrooms in owner-occupied houses - no bedrooms (%)
Bedrooms in owner-occupied houses - 1 bedroom (%)
Bedrooms in owner-occupied houses - 2 bedrooms (%)
Bedrooms in owner-occupied houses - 3 bedrooms (%)
Bedrooms in owner-occupied houses - 4 bedrooms (%)
Bedrooms in owner-occupied houses - 5+ bedrooms (%)
Bedrooms in renter-occupied houses - no bedrooms (%)
Bedrooms in renter-occupied houses - 1 bedroom (%)
Bedrooms in renter-occupied houses - 2 bedrooms (%)
Bedrooms in renter-occupied houses - 3 bedrooms (%)
Bedrooms in renter-occupied houses - 4 bedrooms (%)
Bedrooms in renter-occupied houses - 5+ bedrooms (%)
Vehicles available in owner-occupied houses - no vehicle available (%)
Vehicles available in owner-occupied houses - 1 vehicle available(%)
Vehicles available in owner-occupied houses - 2 Vehicles available (%)
Vehicles available in owner-occupied houses - 3 Vehicles available (%)
Vehicles available in owner-occupied houses - 4 Vehicles available (%)
Vehicles available in owner-occupied houses - 5+ Vehicles available (%)
Vehicles available in renter-occupied houses - no vehicle available (%)
Vehicles available in renter-occupied houses - 1 vehicle available (%)
Vehicles available in renter-occupied houses - 2 Vehicles available (%)
Vehicles available in renter-occupied houses - 3 Vehicles available (%)
Vehicles available in renter-occupied houses - 4 Vehicles available (%)
Vehicles available in renter-occupied houses - 5+ Vehicles available (%)
Housing units in structures - 1, detached (%)
Housing units in structures - 1, attached (%)
Housing units in structures - 2 (%)
Housing units in structures - 3 or 4 (%)
Housing units in structures - 5 to 9 (%)
Housing units in structures - 10 to 19 (%)
Housing units in structures - 20 to 49 (%)
Housing units in structures - 50 or more (%)
Housing units in structures - Mobile home (%)
Housing units in structures - Boat, RV, van, etc. (%)
Housing units in structures - Owners - 1, detached (%)
Housing units in structures - Owners - 1, attached (%)
Housing units in structures - Owners - 2 (%)
Housing units in structures - Owners - 3 or 4 (%)
Housing units in structures - Owners - 5 to 9 (%)
Housing units in structures - Owners - 10 to 19 (%)
Housing units in structures - Owners - 20 to 49 (%)
Housing units in structures - Owners - 50 or more (%)
Housing units in structures - Owners - Mobile home (%)
Housing units in structures - Owners - Boat, RV, van, etc. (%)
Housing units in structures - Renters - 1, detached (%)
Housing units in structures - Renters - 1, attached (%)
Housing units in structures - Renters - 2 (%)
Housing units in structures - Renters - 3 or 4 (%)
Housing units in structures - Renters - 5 to 9 (%)
Housing units in structures - Renters - 10 to 19 (%)
Housing units in structures - Renters - 20 to 49 (%)
Housing units in structures - Renters - 50 or more (%)
Housing units in structures - Renters - Mobile home (%)
Housing units in structures - Renters - Boat, RV, van, etc. (%)
House/condo owner moved in on average (years ago)
Renter moved in on average (years ago)
Year householder moved into unit - Moved in 1999 to March 2000 (%)
Year householder moved into unit - Moved in 1999 to March 2000 (%) - White
Year householder moved into unit - Moved in 1999 to March 2000 (%) - Black or African American
Year householder moved into unit - Moved in 1999 to March 2000 (%) - Asian
Year householder moved into unit - Moved in 1999 to March 2000 (%) - Hispanic or Latino
Year householder moved into unit - Moved in 1999 to March 2000 (%) - American Indian and Alaska Native
Year householder moved into unit - Moved in 1999 to March 2000 (%) - Multirace
Year householder moved into unit - Moved in 1999 to March 2000 (%) - Other Race
Year householder moved into unit - Moved in 1995 to 1998 (%)
Year householder moved into unit - Moved in 1995 to 1998 (%) - White
Year householder moved into unit - Moved in 1995 to 1998 (%) - Black or African American
Year householder moved into unit - Moved in 1995 to 1998 (%) - Asian
Year householder moved into unit - Moved in 1995 to 1998 (%) - Hispanic or Latino
Year householder moved into unit - Moved in 1995 to 1998 (%) - American Indian and Alaska Native
Year householder moved into unit - Moved in 1995 to 1998 (%) - Multirace
Year householder moved into unit - Moved in 1995 to 1998 (%) - Other Race
Year householder moved into unit - Moved in 1990 to 1994 (%)
Year householder moved into unit - Moved in 1990 to 1994 (%) - White
Year householder moved into unit - Moved in 1990 to 1994 (%) - Black or African American
Year householder moved into unit - Moved in 1990 to 1994 (%) - Asian
Year householder moved into unit - Moved in 1990 to 1994 (%) - Hispanic or Latino
Year householder moved into unit - Moved in 1990 to 1994 (%) - American Indian and Alaska Native
Year householder moved into unit - Moved in 1990 to 1994 (%) - Multirace
Year householder moved into unit - Moved in 1990 to 1994 (%) - Other Race
Year householder moved into unit - Moved in 1980 to 1989 (%)
Year householder moved into unit - Moved in 1980 to 1989 (%) - White
Year householder moved into unit - Moved in 1980 to 1989 (%) - Black or African American
Year householder moved into unit - Moved in 1980 to 1989 (%) - Asian
Year householder moved into unit - Moved in 1980 to 1989 (%) - Hispanic or Latino
Year householder moved into unit - Moved in 1980 to 1989 (%) - American Indian and Alaska Native
Year householder moved into unit - Moved in 1980 to 1989 (%) - Multirace
Year householder moved into unit - Moved in 1980 to 1989 (%) - Other Race
Year householder moved into unit - Moved in 1970 to 1979 (%)
Year householder moved into unit - Moved in 1970 to 1979 (%) - White
Year householder moved into unit - Moved in 1970 to 1979 (%) - Black or African American
Year householder moved into unit - Moved in 1970 to 1979 (%) - Asian
Year householder moved into unit - Moved in 1970 to 1979 (%) - Hispanic or Latino
Year householder moved into unit - Moved in 1970 to 1979 (%) - American Indian and Alaska Native
Year householder moved into unit - Moved in 1970 to 1979 (%) - Multirace
Year householder moved into unit - Moved in 1970 to 1979 (%) - Other Race
Year householder moved into unit - Moved in 1969 or earlier (%)
Year householder moved into unit - Moved in 1969 or earlier (%) - White
Year householder moved into unit - Moved in 1969 or earlier (%) - Black or African American
Year householder moved into unit - Moved in 1969 or earlier (%) - Asian
Year householder moved into unit - Moved in 1969 or earlier (%) - Hispanic or Latino
Year householder moved into unit - Moved in 1969 or earlier (%) - American Indian and Alaska Native
Year householder moved into unit - Moved in 1969 or earlier (%) - Multirace
Year householder moved into unit - Moved in 1969 or earlier (%) - Other Race
Housing units lacking complete plumbing facilities (%)
Housing units lacking complete kitchen facilities (%)
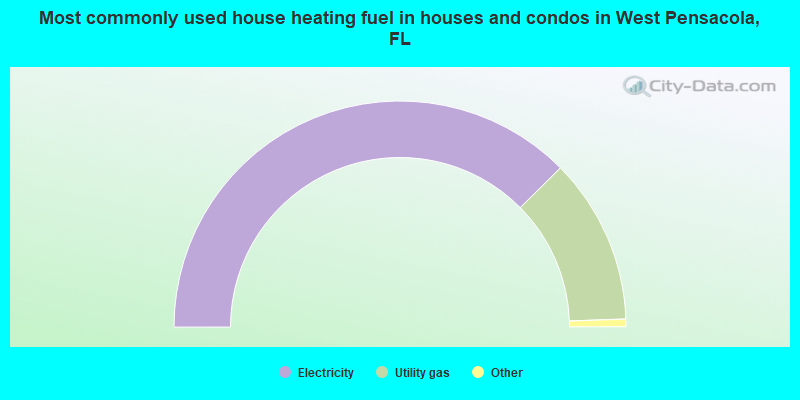
House heating fuel used in houses and condos - Utility gas (%)
House heating fuel used in houses and condos - Bottled, tank, or LP gas (%)
House heating fuel used in houses and condos - Electricity (%)
House heating fuel used in houses and condos - Fuel oil, kerosene, etc. (%)
House heating fuel used in houses and condos - Coal or coke (%)
House heating fuel used in houses and condos - Wood (%)
House heating fuel used in houses and condos - Solar energy (%)
House heating fuel used in houses and condos - Other fuel (%)
House heating fuel used in houses and condos - No fuel used (%)
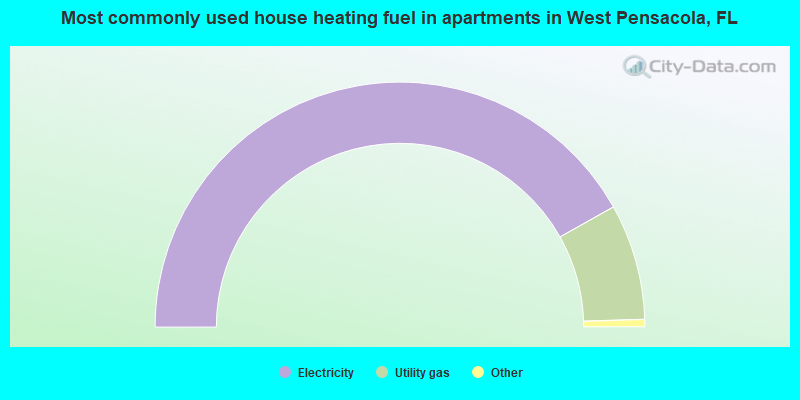
House heating fuel used in apartments - Utility gas (%)
House heating fuel used in apartments - Bottled, tank, or LP gas (%)
House heating fuel used in apartments - Electricity (%)
House heating fuel used in apartments - Fuel oil, kerosene, etc. (%)
House heating fuel used in apartments - Coal or coke (%)
House heating fuel used in apartments - Wood (%)
House heating fuel used in apartments - Solar energy (%)
House heating fuel used in apartments - Other fuel (%)
House heating fuel used in apartments - No fuel used (%)
Median year house/condo built: 1959Median year apartment built: 1974Household type by relationship:
Households: 21,482
Male householders: 3,811 (1,404 living alone ), Female householders: 4,971 (1,420 living alone )2,862 spouses (2,764 opposite-sex spouses ), 817 unmarried partners , (746 opposite-sex unmarried partners ), 6,097 children (5,604 natural , 18 adopted , 474 stepchildren ), 435 grandchildren , 393 brothers or sisters , 466 parents , 189 foster children , 383 other relatives , 881 non-relatives In group quarters: 173
Size of family households: 2,387 2-persons , 1,048 3-persons , 920 4-persons , 472 5-persons , 317 6-persons .
Size of nonfamily households: 3,140 1-person , 745 2-persons , 66 3-persons , 50 4-persons , 79 5-persons .
1,615 married couples with children. single-parent households (709 men , 1,579 women ).
90.9% of residents of West Pensacola speak English at home. of residents speak Spanish at home (43% speak English very well , 23% speak English well , 23% speak English not well , 10% don't speak English at all ).of residents speak other Indo-European language at home (78% speak English very well , 8% speak English well , 5% speak English not well , 9% don't speak English at all ).of residents speak Asian or Pacific Island language at home (69% speak English very well , 28% speak English well , 3% speak English not well ).
Foreign born population: 1,346 (6.3%)of them are naturalized citizens )
Median number of rooms in houses and condos:
Median number of rooms in apartments
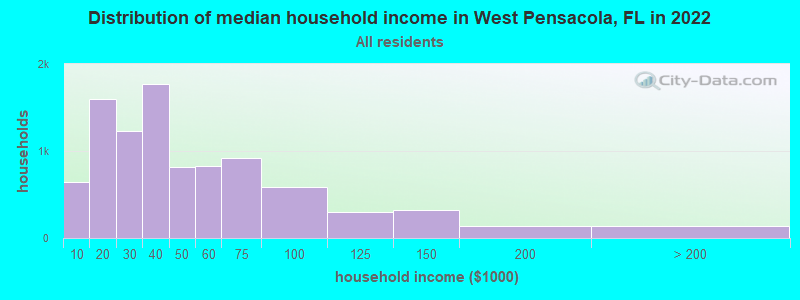
West Pensacola, FL household income distribution 643 Less than $10,0001,601 $10,000 to $19,9991,231 $20,000 to $29,9991,775 $30,000 to $39,999815 $40,000 to $49,999822 $50,000 to $59,999914 $60,000 to $74,999585 $75,000 to $99,999302 $100,000 to $124,999317 $125,000 to $149,999133 $150,000 to $199,999141 $200,000 or more
Home value of owner - occupied houses in 2022 in West Pensacola, FL 89 Less than $10,00019 $10,000 to $14,99944 $15,000 to $19,99934 $20,000 to $24,99968 $25,000 to $29,99972 $30,000 to $34,99943 $35,000 to $39,999136 $40,000 to $49,999266 $50,000 to $59,999172 $60,000 to $69,999456 $70,000 to $79,999232 $80,000 to $89,999113 $90,000 to $99,999435 $100,000 to $124,999155 $125,000 to $149,999251 $150,000 to $174,999247 $175,000 to $199,999229 $200,000 to $249,99912 $250,000 to $299,999125 $300,000 to $399,999108 $400,000 to $499,99998 $500,000 to $749,9995 $750,000 to $999,99926 $1,000,000 to $1,499,99935 $2,000,000 or moreRent paid by renters in 2022 in West Pensacola, FL 104 $100 to $14935 $150 to $199239 $200 to $24993 $300 to $34995 $350 to $39932 $400 to $44928 $450 to $499160 $500 to $549154 $550 to $599290 $600 to $649350 $650 to $699336 $700 to $749262 $750 to $799528 $800 to $899318 $900 to $999778 $1,000 to $1,249131 $1,250 to $1,499127 $1,500 to $1,999112 $3,500 or more114 No cash rent
Percentage of workers working in this county: 89.2%Number of people working at home: 787 (8.8% of all workers )
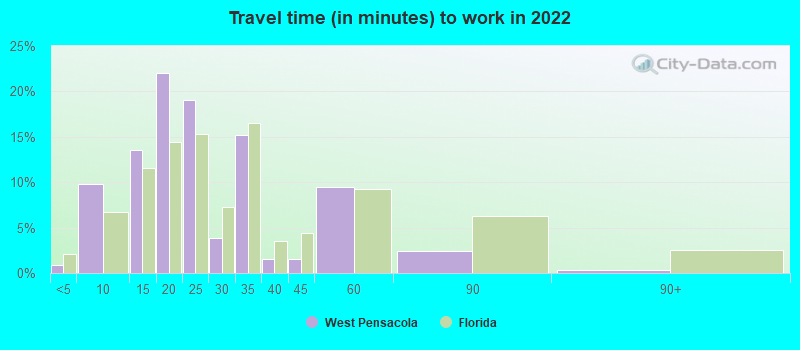
Travel time to work (commute)
Less than 5 minutes: 1375 to 9 minutes: 68510 to 14 minutes: 1,28015 to 19 minutes: 1,89620 to 24 minutes: 1,57025 to 29 minutes: 78630 to 34 minutes: 60135 to 39 minutes: 13940 to 44 minutes: 12245 to 59 minutes: 28560 to 89 minutes: 35590 or more minutes: 255
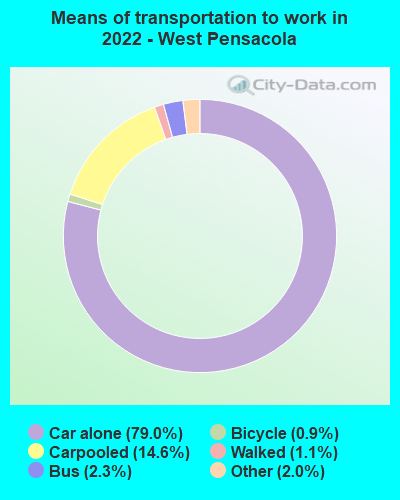
Means of transportation to work:
Drove a car alone: 3,361 (69.2%)Carpooled: 516 (10.6%)Bus : 77 (1.6%)Taxi: 80 (1.6%)Bicycle: 17 (0.4%)Walked: 29 (0.6%)Worked at home: 787 (16.2%)
Unemployment by race in 2022
Unemployment rate for White non-Hispanic residents 5.3% Males4.8% FemalesUnemployment rate for Black residents 8.1% Males3.4% FemalesUnemployment rate for other race residents 4.7% MalesUnemployment rate for two or more race residents 4.7% Males0.9% FemalesUnemployment rate for Hispanic or Latino residents 3.0% Males14.6% Females
Year of entry for the foreign-born population in West Pensacola, Florida
636 2010 or later 295 2000 to 2009 183 1990 to 1999 211 1980 to 1989 191 1970 to 1979 188 Before 1970
First ancestries reported:
American: 1,351 (11.4%)
English: 663 (5.6%)
African: 503 (4.3%)
German: 409 (3.5%)
Irish: 347 (2.9%)
European: 324 (2.7%)
Greek: 159 (1.3%)
Italian: 112 (0.9%)
Senegalese: 92 (0.8%)
Scottish: 90 (0.8%)
Haitian: 85 (0.7%)
French: 51 (0.4%)
Trinidadian and Tobagonian: 44 (0.4%)
Northern European: 37 (0.3%)
British: 36 (0.3%)
Hungarian: 35 (0.3%)
Romanian: 33 (0.3%)
Scotch-Irish: 32 (0.3%)
Jamaican: 29 (0.2%)
Norwegian: 21 (0.2%)
Brazilian: 17 (0.1%)
Polish: 15 (0.1%)
Cajun: 13 (0.1%)
Bahamian: 13 (0.1%)
Slovak: 12 (0.1%)
Ukrainian: 10 (0.08%)
Finnish: 5 (0.04%)
Nigerian: 3 (0.03%) Most common places of birth for foreign-born residents (%): Philippines West Pensacola:
18.6% (253)Florida:
1.8% (84,403)
Mexico West Pensacola:
18.5% (252)Florida:
5.6% (257,152)
Trinidad and Tobago West Pensacola:
7.0% (95)Florida:
1.0% (43,642)
Guatemala West Pensacola:
6.7% (91)Florida:
2.1% (97,632)
Moldova West Pensacola:
6.2% (85)Florida:
0.1% (4,361)
Argentina West Pensacola:
5.7% (78)Florida:
1.3% (57,263)
Honduras West Pensacola:
5.0% (68)Florida:
2.3% (107,160)
Senegal West Pensacola:
4.8% (65)Florida:
0.0% (850)
Vietnam West Pensacola:
4.7% (64)Florida:
1.3% (60,604)
Haiti West Pensacola:
3.9% (53)Florida:
7.5% (342,375)
Jamaica West Pensacola:
2.9% (40)Florida:
5.0% (227,319)
England West Pensacola:
2.5% (34)Florida:
0.8% (37,723)
Thailand West Pensacola:
1.8% (25)Florida:
0.3% (12,303)
Place of birth for U.S.-born residents:
This state: 11,016Other state: 8,673Northeast: 1,394Midwest: 1,487South: 4,998West: 789 89.5% of West Pensacola residents lived in the same house 1 years ago.
Out of people who lived in different houses, 36.6% lived in this county.
Out of people who lived in different counties, 31.0% lived in Florida.
West Pensacola:
89.5%State average:
86.3%
Education attainment for males 25 years and older:
No schooling: 152Nursery to 4th grade: 795th and 6th grade: 607th and 8th grade: 829th grade: 12510th grade: 29411th grade: 32212th grade, no diploma: 218High school graduate (or equivalency): 2,581Less than 1 year of college: 469Some college more than 1 year, no degree: 1,154Associate degree: 362Bachelor's degree: 667Master's degree: 297Professional school degree: 47Doctorate degree: 0
Education attainment for females 25 years and older:
No schooling: 105Nursery to 4th grade: 475th and 6th grade: 1287th and 8th grade: 1129th grade: 25610th grade: 15211th grade: 46312th grade, no diploma: 135High school graduate (or equivalency): 2,458Less than 1 year of college: 641Some college more than 1 year, no degree: 1,194Associate degree: 597Bachelor's degree: 656Master's degree: 399Professional school degree: 177Doctorate degree: 8
Housing units in structures:
One, detached: 7,453One, attached: 146Two: 4133 or 4: 4715 to 9: 36910 to 19: 40620 to 49: 19350 or more: 232Mobile homes: 739Median worth of mobile homes: $65,882
Housing units lacking complete plumbing facilities in 2022: 3.4%Housing units lacking complete kitchen facilities in 2022: 3.8%House/condo owner moved in on average 14 years ago
Renter moved in on average 3 years ago
Private vs. public school enrollment:
Students in private schools in grades 1 to 8 (elementary and middle school): 361 Students in private schools in grades 9 to 12 (high school): 223 Students in private undergraduate colleges: 17