Races in West Pensacola, Florida (FL) Detailed Stats
Data:
Races - White alone (%)
Races - White alone (% change since 2000)
Races - Black alone (%)
Races - Black alone (% change since 2000)
Races - American Indian alone (%)
Races - American Indian alone (% change since 2000)
Races - Asian alone (%)
Races - Asian alone (% change since 2000)
Races - Hispanic (%)
Races - Hispanic (% change since 2000)
Races - Native Hawaiian and Other Pacific Islander alone (%)
Races - Native Hawaiian and Other Pacific Islander alone (% change since 2000)
Races - Two or more races(%)
Races - Two or more races(% change since 2000)
Races - Other race alone (%)
Races - Other race alone (% change since 2000)
Racial diversity
Place of birth - Born in state of residence (%)
Place of birth - Born in state of residence (%) - White
Place of birth - Born in state of residence (%) - Black or African American
Place of birth - Born in state of residence (%) - Asian
Place of birth - Born in state of residence (%) - Hispanic or Latino
Place of birth - Born in state of residence (%) - American Indian and Alaska Native
Place of birth - Born in state of residence (%) - Multirace
Place of birth - Born in state of residence (%) - Other Race
Place of birth - Born in other state (%)
Place of birth - Born in other state (%) - White
Place of birth - Born in other state (%) - Black or African American
Place of birth - Born in other state (%) - Asian
Place of birth - Born in other state (%) - Hispanic or Latino
Place of birth - Born in other state (%) - American Indian and Alaska Native
Place of birth - Born in other state (%) - Multirace
Place of birth - Born in other state (%) - Other Race
Place of birth - Native, outside of US (%)
Place of birth - Native, outside of US (%) - White
Place of birth - Native, outside of US (%) - Black or African American
Place of birth - Native, outside of US (%) - Asian
Place of birth - Native, outside of US (%) - Hispanic or Latino
Place of birth - Native, outside of US (%) - American Indian and Alaska Native
Place of birth - Native, outside of US (%) - Multirace
Place of birth - Native, outside of US (%) - Other Race
Place of birth - Foreign born (%)
Place of birth - Foreign born (%) - White
Place of birth - Foreign born (%) - Black or African American
Place of birth - Foreign born (%) - Asian
Place of birth - Foreign born (%) - Hispanic or Latino
Place of birth - Foreign born (%) - American Indian and Alaska Native
Place of birth - Foreign born (%) - Multirace
Place of birth - Foreign born (%) - Other Race
Residents speaking English at home (%)
Residents speaking English at home - Born in the United States (%)
Residents speaking English at home - Native, born elsewhere (%)
Residents speaking English at home - Foreign born (%)
Residents speaking Spanish at home (%)
Residents speaking Spanish at home - Born in the United States (%)
Residents speaking Spanish at home - Native, born elsewhere (%)
Residents speaking Spanish at home - Foreign born (%)
Residents speaking other language at home (%)
Residents speaking other language at home - Born in the United States (%)
Residents speaking other language at home - Native, born elsewhere (%)
Residents speaking other language at home - Foreign born (%)
Marital status - Never married (%)
Marital status - Now married (%)
Marital status - Separated (%)
Marital status - Widowed (%)
Marital status - Divorced (%)
Ancestries Reported - Arab (%)
Ancestries Reported - Czech (%)
Ancestries Reported - Danish (%)
Ancestries Reported - Dutch (%)
Ancestries Reported - English (%)
Ancestries Reported - French (%)
Ancestries Reported - French Canadian (%)
Ancestries Reported - German (%)
Ancestries Reported - Greek (%)
Ancestries Reported - Hungarian (%)
Ancestries Reported - Irish (%)
Ancestries Reported - Italian (%)
Ancestries Reported - Lithuanian (%)
Ancestries Reported - Norwegian (%)
Ancestries Reported - Polish (%)
Ancestries Reported - Portuguese (%)
Ancestries Reported - Russian (%)
Ancestries Reported - Scotch-Irish (%)
Ancestries Reported - Scottish (%)
Ancestries Reported - Slovak (%)
Ancestries Reported - Subsaharan African (%)
Ancestries Reported - Swedish (%)
Ancestries Reported - Swiss (%)
Ancestries Reported - Ukrainian (%)
Ancestries Reported - United States (%)
Ancestries Reported - Welsh (%)
Ancestries Reported - West Indian (%)
Ancestries Reported - Other (%)
Geographical mobility - Same house 1 year ago (%)
Geographical mobility - Same house 1 year ago (%) - White
Geographical mobility - Same house 1 year ago (%) - Black or African American
Geographical mobility - Same house 1 year ago (%) - Asian
Geographical mobility - Same house 1 year ago (%) - Hispanic or Latino
Geographical mobility - Same house 1 year ago (%) - American Indian and Alaska Native
Geographical mobility - Same house 1 year ago (%) - Multirace
Geographical mobility - Same house 1 year ago (%) - Other Race
Geographical mobility - Moved within same county (%)
Geographical mobility - Moved within same county (%) - White
Geographical mobility - Moved within same county (%) - Black or African American
Geographical mobility - Moved within same county (%) - Asian
Geographical mobility - Moved within same county (%) - Hispanic or Latino
Geographical mobility - Moved within same county (%) - American Indian and Alaska Native
Geographical mobility - Moved within same county (%) - Multirace
Geographical mobility - Moved within same county (%) - Other Race
Geographical mobility - Moved from different county within same state (%)
Geographical mobility - Moved from different county within same state (%) - White
Geographical mobility - Moved from different county within same state (%) - Black or African American
Geographical mobility - Moved from different county within same state (%) - Asian
Geographical mobility - Moved from different county within same state (%) - Hispanic or Latino
Geographical mobility - Moved from different county within same state (%) - American Indian and Alaska Native
Geographical mobility - Moved from different county within same state (%) - Multirace
Geographical mobility - Moved from different county within same state (%) - Other Race
Geographical mobility - Moved from different state (%)
Geographical mobility - Moved from different state (%) - White
Geographical mobility - Moved from different state (%) - Black or African American
Geographical mobility - Moved from different state (%) - Asian
Geographical mobility - Moved from different state (%) - Hispanic or Latino
Geographical mobility - Moved from different state (%) - American Indian and Alaska Native
Geographical mobility - Moved from different state (%) - Multirace
Geographical mobility - Moved from different state (%) - Other Race
Geographical mobility - Moved from abroad (%)
Geographical mobility - Moved from abroad (%) - White
Geographical mobility - Moved from abroad (%) - Black or African American
Geographical mobility - Moved from abroad (%) - Asian
Geographical mobility - Moved from abroad (%) - Hispanic or Latino
Geographical mobility - Moved from abroad (%) - American Indian and Alaska Native
Geographical mobility - Moved from abroad (%) - Multirace
Geographical mobility - Moved from abroad (%) - Other Race
Place of birth for the foreign-born population - Ireland (%)
Place of birth for the foreign-born population - Denmark (%)
Place of birth for the foreign-born population - Norway (%)
Place of birth for the foreign-born population - Sweden (%)
Place of birth for the foreign-born population - United Kingdom (%)
Place of birth for the foreign-born population - England (%)
Place of birth for the foreign-born population - Scotland (%)
Place of birth for the foreign-born population - Other Northern Europe (%)
Place of birth for the foreign-born population - Austria (%)
Place of birth for the foreign-born population - Belgium (%)
Place of birth for the foreign-born population - France (%)
Place of birth for the foreign-born population - Germany (%)
Place of birth for the foreign-born population - Netherlands (%)
Place of birth for the foreign-born population - Switzerland (%)
Place of birth for the foreign-born population - Other Western Europe (%)
Place of birth for the foreign-born population - Greece (%)
Place of birth for the foreign-born population - Italy (%)
Place of birth for the foreign-born population - Portugal (%)
Place of birth for the foreign-born population - Spain (%)
Place of birth for the foreign-born population - Other Southern Europe (%)
Place of birth for the foreign-born population - Albania (%)
Place of birth for the foreign-born population - Belarus (%)
Place of birth for the foreign-born population - Bosnia and Herzegovina (%)
Place of birth for the foreign-born population - Bulgaria (%)
Place of birth for the foreign-born population - Croatia (%)
Place of birth for the foreign-born population - Czechoslovakia (%)
Place of birth for the foreign-born population - Hungary (%)
Place of birth for the foreign-born population - Latvia (%)
Place of birth for the foreign-born population - Lithuania (%)
Place of birth for the foreign-born population - North Macedonia (Macedonia) (%)
Place of birth for the foreign-born population - Moldova (%)
Place of birth for the foreign-born population - Poland (%)
Place of birth for the foreign-born population - Romania (%)
Place of birth for the foreign-born population - Russia (%)
Place of birth for the foreign-born population - Serbia (%)
Place of birth for the foreign-born population - Ukraine (%)
Place of birth for the foreign-born population - Other Eastern Europe (%)
Place of birth for the foreign-born population - China (%)
Place of birth for the foreign-born population - Hong Kong (%)
Place of birth for the foreign-born population - Taiwan (%)
Place of birth for the foreign-born population - Japan (%)
Place of birth for the foreign-born population - Korea (%)
Place of birth for the foreign-born population - Other Eastern Asia (%)
Place of birth for the foreign-born population - Afghanistan (%)
Place of birth for the foreign-born population - Bangladesh (%)
Place of birth for the foreign-born population - India (%)
Place of birth for the foreign-born population - Iran (%)
Place of birth for the foreign-born population - Kazakhstan (%)
Place of birth for the foreign-born population - Nepal (%)
Place of birth for the foreign-born population - Pakistan (%)
Place of birth for the foreign-born population - Sri Lanka (%)
Place of birth for the foreign-born population - Uzbekistan (%)
Place of birth for the foreign-born population - Other South Central Asia (%)
Place of birth for the foreign-born population - Burma (%)
Place of birth for the foreign-born population - Cambodia (%)
Place of birth for the foreign-born population - Indonesia (%)
Place of birth for the foreign-born population - Laos (%)
Place of birth for the foreign-born population - Malaysia (%)
Place of birth for the foreign-born population - Philippines (%)
Place of birth for the foreign-born population - Singapore (%)
Place of birth for the foreign-born population - Thailand (%)
Place of birth for the foreign-born population - Vietnam (%)
Place of birth for the foreign-born population - Other South Eastern Asia (%)
Place of birth for the foreign-born population - Armenia (%)
Place of birth for the foreign-born population - Iraq (%)
Place of birth for the foreign-born population - Israel (%)
Place of birth for the foreign-born population - Jordan (%)
Place of birth for the foreign-born population - Kuwait (%)
Place of birth for the foreign-born population - Lebanon (%)
Place of birth for the foreign-born population - Saudi Arabia (%)
Place of birth for the foreign-born population - Syria (%)
Place of birth for the foreign-born population - Turkey (%)
Place of birth for the foreign-born population - Yemen (%)
Place of birth for the foreign-born population - Other Western Asia (%)
Place of birth for the foreign-born population - Eritrea (%)
Place of birth for the foreign-born population - Ethiopia (%)
Place of birth for the foreign-born population - Kenya (%)
Place of birth for the foreign-born population - Somalia (%)
Place of birth for the foreign-born population - Uganda (%)
Place of birth for the foreign-born population - Zimbabwe (%)
Place of birth for the foreign-born population - Other Eastern Africa (%)
Place of birth for the foreign-born population - Cameroon (%)
Place of birth for the foreign-born population - Congo (%)
Place of birth for the foreign-born population - Democratic Republic of Congo (Zaire) (%)
Place of birth for the foreign-born population - Other Middle Africa (%)
Place of birth for the foreign-born population - Egypt (%)
Place of birth for the foreign-born population - Morocco (%)
Place of birth for the foreign-born population - Sudan (%)
Place of birth for the foreign-born population - Other Northern Africa (%)
Place of birth for the foreign-born population - South Africa (%)
Place of birth for the foreign-born population - Other Southern Africa (%)
Place of birth for the foreign-born population - Cabo Verde (%)
Place of birth for the foreign-born population - Ghana (%)
Place of birth for the foreign-born population - Liberia (%)
Place of birth for the foreign-born population - Nigeria (%)
Place of birth for the foreign-born population - Senegal (%)
Place of birth for the foreign-born population - Sierra Leone (%)
Place of birth for the foreign-born population - Other Western Africa (%)
Place of birth for the foreign-born population - Australia (%)
Place of birth for the foreign-born population - New Zealand (%)
Place of birth for the foreign-born population - Fiji (%)
Place of birth for the foreign-born population - Micronesia (%)
Place of birth for the foreign-born population - Bahamas (%)
Place of birth for the foreign-born population - Barbados (%)
Place of birth for the foreign-born population - Cuba (%)
Place of birth for the foreign-born population - Dominica (%)
Place of birth for the foreign-born population - Dominican Republic (%)
Place of birth for the foreign-born population - Grenada (%)
Place of birth for the foreign-born population - Haiti (%)
Place of birth for the foreign-born population - Jamaica (%)
Place of birth for the foreign-born population - St. Vincent and the Grenadines (%)
Place of birth for the foreign-born population - Trinidad and Tobago (%)
Place of birth for the foreign-born population - West Indies (%)
Place of birth for the foreign-born population - Other Caribbean (%)
Place of birth for the foreign-born population - Belize (%)
Place of birth for the foreign-born population - Costa Rica (%)
Place of birth for the foreign-born population - El Salvador (%)
Place of birth for the foreign-born population - Guatemala (%)
Place of birth for the foreign-born population - Honduras (%)
Place of birth for the foreign-born population - Mexico (%)
Place of birth for the foreign-born population - Nicaragua (%)
Place of birth for the foreign-born population - Panama (%)
Place of birth for the foreign-born population - Other Central America (%)
Place of birth for the foreign-born population - Argentina (%)
Place of birth for the foreign-born population - Bolivia (%)
Place of birth for the foreign-born population - Brazil (%)
Place of birth for the foreign-born population - Chile (%)
Place of birth for the foreign-born population - Colombia (%)
Place of birth for the foreign-born population - Ecuador (%)
Place of birth for the foreign-born population - Guyana (%)
Place of birth for the foreign-born population - Peru (%)
Place of birth for the foreign-born population - Uruguay (%)
Place of birth for the foreign-born population - Venezuela (%)
Place of birth for the foreign-born population - Other South America (%)
Place of birth for the foreign-born population - Canada (%)
Place of birth for the foreign-born population - Other Northern America (%)
Place of birth for the foreign-born population - Other (%)
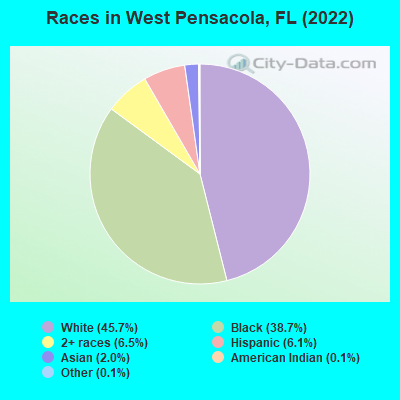
According to 2022 data, the most numerous races in West Pensacola, FL are White alone (9,820 residents), Hispanic (1,316 residents), and Black alone (8,311 residents). 91.5% of West Pensacola residents speak English at home. 6.3% of West Pensacola, FL residents are foreign-born (3.3% born in Latin America, 1.7% born in Asia, 0.7% born in Europe), which is 231.7% less than the foreign-born rate of 21.0% across the entire state of Florida.
Race distribution in West Pensacola
2000 2022
10,458,509 65.4% White alone 2,682,715 16.8% Hispanic 2,264,268 14.2% Black alone 261,693 1.6% Asian alone 236,954 1.5% Two or more races 42,358 0.3% American Indian alone 28,994 0.2% Other race alone 6,887 0.04% Native Hawaiian and Other
11,309,403 50.8% White alone 6,025,039 27.1% Hispanic 3,241,015 14.6% Black alone 861,630 3.9% Two or more races 623,692 2.8% Asian alone 152,054 0.7% Other race alone 22,504 0.1% American Indian alone 9,486 0.04% Native Hawaiian and Other
Income and house value in West Pensacola Median household income in 2022 $40,335 White non-Hispanic householders$33,452 Black householders$55,057 Asian householders$61,079 Some other race householders$43,737 Hispanic or Latino race householdersMedian 2022 house value $119,230 White Non-Hispanic householders$119,484 Black or African American householders$133,183 American Indian or Alaska Native householders $127,602 Asian householders$114,156 Native Hawaiian and other Pacific Islander householders$95,130 Some other race householders$143,076 Two or more races householders$97,160 Hispanic or Latino householders
Median age by race in West Pensacola
42.2 Median age for White residents40.2 46.6 32.1 Median age for Black or African American residents29.0 36.6 -515,555,555.0 Median age for American Indian / Alaska Native residents-624,999,999.4 -792,899,407.5 52.0 Median age for Asian residents36.1 68.2 -679,849,340.2 Median age for Native Hawaiian / Pacific Islander residents-858,307,848.3 -443,298,968.6 42.0 Median age for Other race residents47.7 37.8 30.8 Median age for Two or more races residents42.5 24.6 41.9 Median age for White alone residents40.3 46.6 31.7 Median age for Hispanic or Latino residents33.1 27.3
Owner/renter occupied households by race in West Pensacola
House owners and renters - White residents 2,870 65.0% Owner occupied1,549 35.0% Renter occupiedHouse owners and renters - Black or African American residents 1,067 29.3% Owner occupied2,574 70.7% Renter occupiedHouse owners and renters - Asian residents 125 49.6% Owner occupied127 50.4% Renter occupiedHouse owners and renters - Native Hawaiian / Pacific Islander residents 25 100.0% Owner occupiedHouse owners and renters - Other race residents 170 51.3% Owner occupied162 48.7% Renter occupiedHouse owners and renters - Two or more races residents 212 28.5% Owner occupied531 71.5% Renter occupiedHouse owners and renters - White alone residents 2,818 65.2% Owner occupied1,504 34.8% Renter occupiedHouse owners and renters - Hispanic or Latino residents 187 42.2% Owner occupied256 57.8% Renter occupied
Language usage in West Pensacola
English speakers - Total 91.5% of residents of West Pensacola speak English at home.
3.8% of residents speak Spanish at home 338 45.4% Speak English very well406 54.6% Speak English less than very well5.1% of residents speak other language at home 856 84.5% Speak English very well157 15.5% Speak English less than very well
English speakers - Born in the United States 94.9% of residents of West Pensacola speak English at home.
2.5% of residents speak Spanish at home 116 54.7% Speak English very well96 45.3% Speak English less than very well3.3% of residents speak other language at home 240 85.1% Speak English very well42 14.9% Speak English less than very well
English speakers - Native, born elsewhere 71.0% of residents of West Pensacola speak English at home.
19.1% of residents speak Spanish at home 58 89.2% Speak English very well7 10.8% Speak English less than very well10.6% of residents speak other language at home 36 100.0% Speak English less than very well
English speakers - Foreign-born 24.6% of residents of West Pensacola speak English at home.
34.3% of residents speak Spanish at home 106 24.2% Speak English very well332 75.8% Speak English less than very well42.3% of residents speak other language at home 425 78.6% Speak English very well116 21.4% Speak English less than very well
White (Caucasian) - Speak only English Native:
96.9% (8,839)Foreign-born:
37.4% (75)
White (Caucasian) - Speak another language Native:
3.1% (287)Foreign-born:
62.2% (125)
Black or African American - Speak only English Native:
100.0% (7,286)Foreign-born:
49.8% (187)
Black or African American - Speak another language Native:
0.6% (44)Foreign-born:
48.5% (182)
Asian - Speak only English Native:
23.8% (33)Foreign-born:
8.2% (23)
Asian - Speak another language Native:
78.2% (108)Foreign-born:
91.9% (257)
Other race - Speak only English Native:
22.3% (109)Foreign-born:
5.1% (28)
Other race - Speak another language Native:
58.6% (287)Foreign-born:
97.4% (539)
Two or more races - Speak only English Native:
98.3% (1,371)Foreign-born:
38.4% (42)
Two or more races - Speak another language Native:
2.1% (30)Foreign-born:
66.0% (72)
White alone - Speak only English Native:
97.0% (8,758)Foreign-born:
49.8% (58)
White alone - Speak another language Native:
3.3% (293)Foreign-born:
49.3% (57)
Hispanic or Latino - Speak only English Native:
54.0% (393)Foreign-born:
10.0% (51)
Hispanic or Latino - Speak another language Native:
44.5% (324)Foreign-born:
89.9% (457)
Foreign-born residents in West Pensacola 1,360 residents are foreign born (3.3% Latin America , 1.7% Asia , 0.7% Europe ).
This city:
6.3%Florida:
21.1%
Marital status for residents in West Pensacola Marital status - White (Caucasian) population 15 years and over
Males 36.2% Never married43.4% Now married1.3% Separated5.3% Widowed13.9% DivorcedFemales 18.8% Never married44.1% Now married4.6% Separated11.8% Widowed20.6% DivorcedWomen who gave birth in the past 12 months Now married:
39.0% (62)Unmarried:
61.0% (97)
Women who did not give birth in the past 12 months Now married:
58.7% (952)Unmarried:
41.3% (670)
Marital status - Black or African American population 15 years and over
Males 49.4% Never married32.7% Now married3.1% Separated4.0% Widowed10.8% DivorcedFemales 45.5% Never married27.9% Now married6.0% Separated3.6% Widowed17.0% DivorcedWomen who gave birth in the past 12 months Now married:
37.0% (137)Unmarried:
63.0% (232)
Women who did not give birth in the past 12 months Now married:
34.3% (690)Unmarried:
65.7% (1,323)
Marital status - Asian population 15 years and over
Males 55.2% Never married17.9% Now married0.0% Separated0.0% Widowed26.9% DivorcedFemales 15.1% Never married28.7% Now married0.0% Separated17.8% Widowed38.4% DivorcedWomen who did not give birth in the past 12 months Now married:
20.5% (17)Unmarried:
79.5% (64)
Marital status - Other race population 15 years and over
Males 46.9% Never married27.3% Now married0.0% Separated7.4% Widowed18.4% DivorcedFemales 37.6% Never married26.9% Now married13.4% Separated0.0% Widowed22.0% DivorcedWomen who did not give birth in the past 12 months Now married:
33.3% (79)Unmarried:
66.7% (158)
Marital status - Two or more races population 15 years and over
Males 36.1% Never married23.9% Now married1.8% Separated0.0% Widowed38.2% DivorcedFemales 33.8% Never married21.5% Now married1.8% Separated3.5% Widowed39.5% DivorcedWomen who gave birth in the past 12 months Now married:
0.0% (0)Unmarried:
100.0% (13)
Women who did not give birth in the past 12 months Now married:
21.6% (114)Unmarried:
78.4% (414)
Marital status - White alone, not Hispanic / Latino population 15 years and over
Males 36.2% Never married43.8% Now married1.3% Separated5.0% Widowed13.6% DivorcedFemales 18.2% Never married44.7% Now married4.0% Separated12.0% Widowed21.1% DivorcedWomen who gave birth in the past 12 months Now married:
31.0% (45)Unmarried:
69.0% (100)
Women who did not give birth in the past 12 months Now married:
60.1% (954)Unmarried:
39.9% (633)
Marital status - Hispanic or Latino population 15 years and over
Males 44.1% Never married27.6% Now married1.7% Separated7.5% Widowed19.1% DivorcedFemales 40.3% Never married25.5% Now married17.0% Separated3.4% Widowed13.8% DivorcedWomen who gave birth in the past 12 months Now married:
100.0% (19)Unmarried:
0.0% (0)
Women who did not give birth in the past 12 months Now married:
30.2% (78)Unmarried:
69.8% (181)
Ancestries in West Pensacola
1,351 11.4% American663 5.6% English503 4.3% African409 3.5% German347 2.9% Irish324 2.7% European159 1.3% Greek112 0.9% Italian92 0.8% Senegalese90 0.8% Scottish85 0.7% Haitian51 0.4% French44 0.4% Trinidadian and Tobagonian37 0.3% Northern European36 0.3% British35 0.3% Hungarian33 0.3% Romanian32 0.3% Scotch-Irish29 0.2% Jamaican21 0.2% Norwegian17 0.1% Brazilian15 0.1% Polish13 0.1% Cajun13 0.1% Bahamian12 0.1% Slovak10 0.08% Ukrainian5 0.04% Finnish3 0.03% Nigerian
Geographical mobility in West Pensacola Same house 1 year ago 8,774 89.0% White (Caucasian)7,198 89.7% Black or African American38 100.0% American Indian / Alaska Native324 76.3% Asian20 100.0% Native Hawaiian / Pacific Islander950 88.2% Other race1,464 88.7% Two or more races8,598 88.8% White alone, not Hispanic / Latino1,113 85.9% Hispanic or LatinoMoved within same county 742 7.5% White / Caucasian435 5.4% Black or African American28 6.6% Asian133 8.0% Two or more races758 7.8% White alone, not Hispanic / Latino70 5.4% Hispanic or LatinoMoved within same state 99 1.0% White / Caucasian223 2.8% Black or African American46 4.3% Other race107 1.1% White alone, not Hispanic / Latino23 1.8% Hispanic or LatinoMoved from different state 308 3.1% White / Caucasian168 2.1% Black or African American37 8.7% Asian81 7.5% Other race58 3.5% Two or more races249 2.6% White alone, not Hispanic / Latino188 14.5% Hispanic or LatinoMoved from abroad 3 0.0% White4 0.0% White alone, not Hispanic / Latino
Children Nativity (place of birth) in West Pensacola
Children under 6 years - Living with two parents Both parents native 464 100.0% NativeBoth parents foreign-born 45 100.0% NativeOne native, one foreign-born parent 90 100.0% NativeChildren under 6 years - Living with one parent Native parent 1,159 100.0% NativeForeign-born parent 26 100.0% NativeChildren 6 to 17 years - Living with two parents Both parents native 970 100.0% Native0 0.0% Foreign-bornBoth parents foreign-born 25 100.0% NativeOne native, one foreign-born parent 21 49.4% Native22 50.6% Foreign-bornChildren 6 to 17 years - Living with one parent Native parent 1,293 100.0% NativeForeign-born parent 138 54.8% Native114 45.2% Foreign-born
Grandparents responsible for own grandchildren in West Pensacola
Grandparents (30 to 59 years) White / Caucasian 69 100.0% Not responsible for grandchildrenBlack or African American 152 100.0% Responsible for grandchildrenWhite alone, not Hispanic / Latino 69 100.0% Not responsible for grandchildrenGrandparents (60 years and over) White / Caucasian 24 13.8% Responsible for grandchildren147 86.2% Not responsible for grandchildrenBlack or African American 54 32.6% Responsible for grandchildren112 67.4% Not responsible for grandchildrenWhite alone, not Hispanic / Latino 24 14.1% Responsible for grandchildren148 85.9% Not responsible for grandchildren