Wellesley, MA (Massachusetts) Houses and Residents
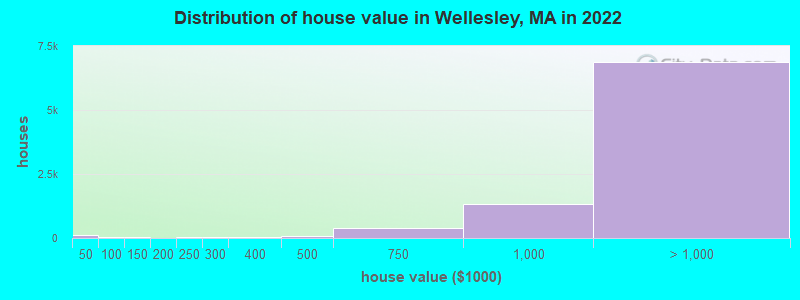
Estimated median house or condo value in 2022: $1,514,923 (it was $544,400 in 2000 )
Wellesley:
$1,514,923Massachusetts:
$534,700
Lower value quartile - upper value quartile: $1,064,876 - $2,124,946Mean price in 2022: Detached houses: $1,870,242 Here:
$1,870,242State:
$651,570
Townhouses or other attached units: $1,118,396 Here:
$1,118,396State:
$617,749
In 2-unit structures: $857,493 Here:
$857,493State:
$594,808
In 3-to-4-unit structures: $451,509 Here:
$451,509State:
$601,912
In 5-or-more-unit structures: $960,156 Here:
$960,156State:
$555,768
Total population: 27,982 (Urban population: 26,613, Rural population: 0)
Houses: 9,461 (9,091 occupied: 7,635 owner occupied, 1,408 renter occupied )
% of renters here:
16%State:
38%
Housing density: 929 houses/condos per square mile
Median price asked for vacant for-sale houses and condos in 2022: $1,776,948.
Median contract rent in 2022: over $2,000 (lower quartile is $1,429, upper quartile is over $2,000)
Median rent asked for vacant for-rent units in 2022: $1,988
Median gross rent in Wellesley, MA in 2022: over $2,000
Housing units in Wellesley with a mortgage: 4,818 (855 second mortgage, 17 home equity loan, 776 both second mortgage and home equity loan )Houses without a mortgage: 126
Median household income for houses/condos with a mortgage: $249,907
Median household income for apartments without a mortgage: $185,896
Median monthly housing costs: $3,486
Data:
Median house or condo value ($)
Median house or condo value ($ change since 2000)
Median house or condo value ($) - White
Median house or condo value ($) - Black or African American
Median house or condo value ($) - Asian
Median house or condo value ($) - Hispanic or Latino
Median house or condo value ($) - American Indian and Alaska Native
Median house or condo value ($) - Multirace
Median house or condo value ($) - Other Race
Median price asked for mobile homes ($)
Household density (households per square mile)
Mean house or condo value by units in structure - 1, detached ($)
Mean house or condo value by units in structure - 1, attached ($)
Mean house or condo value by units in structure - 2 ($)
Mean house or condo value by units in structure by units in structure - 3 or 4 ($)
Mean house or condo value by units in structure - 5 or more ($)
Mean house or condo value by units in structure - Boat, RV, van, etc. ($)
Mean house or condo value by units in structure - Mobile home ($)
Median contract rent ($)
Median contract rent - Lower quartile ($)
Median contract rent - Upper quartile ($)
Median gross rent ($)
Urban houses (%)
Rural houses (%)
Houses occupied (%)
Houses occupied (% change since 2000)
Houses owner occupied (%)
Houses owner occupied (% change since 2000)
Houses renter occupied (%)
Houses renter occupied (% change since 2000)
Vacant housing units - For rent (%)
Vacant housing units - For rent (% change since 2000)
Vacant housing units - For sale only (%)
Vacant housing units - For sale only (% change since 2000)
Vacant housing units - Rented or sold, not occupied (%)
Vacant housing units - Rented or sold, not occupied (% change since 2000)
Vacant housing units - For seasonal, recreational, or occasional use (%)
Vacant housing units - For seasonal, recreational, or occasional use (% change since 2000)
Vacant housing units - For migrant workers (%)
Vacant housing units - For migrant workers (% change since 2000)
Vacant housing units - Other vacant (%)
Vacant housing units - Other vacant (% change since 2000)
Median monthly housing costs ($)
Median household income for houses/condos with a mortgage ($)
Median household income for houses/condos without a mortgage ($)
Median household income ($)
Median household income ($) - White
Median household income ($) - Black or African American
Median household income ($) - Asian
Median household income ($) - Hispanic or Latino
Median household income ($) - American Indian and Alaska Native
Median household income ($) - Multirace
Median household income ($) - Other Race
Mortgage status - with mortgage (%)
Mortgage status - with second mortgage (%)
Mortgage status - with home equity loan (%)
Mortgage status - with both second mortgage and home equity loan (%)
Mortgage status - without a mortgage (%)
Median year house/condo built
Median year apartment built
Household type by relationship - Male householder living alone (%)
Household type by relationship - Male householder not living alone (%)
Household type by relationship - Female householder living alone (%)
Household type by relationship - Female householder not living alone (%)
Household type by relationship - Opposite-Sex spouse (%)
Household type by relationship - Same-Sex spouse (%)
Household type by relationship - Opposite-Sex unmarried partner (%)
Household type by relationship - Same-Sex unmarried partner (%)
Household type by relationship - In group quarters (%)
Size of family households - 2-person household (%)
Size of family households - 3-person household (%)
Size of family households - 4-person household (%)
Size of family households - 5-person household (%)
Size of family households - 6-person household (%)
Size of family households - 7-or-more-person household (%)
Size of nonfamily households - 1-person household (%)
Size of nonfamily households - 2-person household (%)
Size of nonfamily households - 3-person household (%)
Size of nonfamily households - 4-person household (%)
Size of nonfamily households - 5-person household (%)
Size of nonfamily households - 6-person household (%)
Size of nonfamily households - 7-or-moreperson household (%)
Year house built - Built 2010 or later (%)
Year house built - Built 2000 to 2009 (%)
Year house built - Built 1990 to 1999 (%)
Year house built - Built 1980 to 1989 (%)
Year house built - Built 1970 to 1979 (%)
Year house built - Built 1960 to 1969 (%)
Year house built - Built 1950 to 1959 (%)
Year house built - Built 1940 to 1949 (%)
Year house built - Built 1939 or earlier (%)
Median number of rooms in houses and condos
Median number of rooms in apartments
Median number of bedrooms in owner occupied houses
Mean number of bedrooms in owner occupied houses
Median number of bedrooms in renter occupied houses
Mean number of bedrooms in renter occupied houses
Median number of vehichles in owner occupied houses
Mean number of vehichles in owner occupied houses
Median number of vehichles in renter occupied houses
Mean number of vehichles in renter occupied houses
Rooms in owner-occupied houses - 1 room (%)
Rooms in owner-occupied houses - 2 rooms (%)
Rooms in owner-occupied houses - 3 rooms (%)
Rooms in owner-occupied houses - 4 rooms (%)
Rooms in owner-occupied houses - 5 rooms (%)
Rooms in owner-occupied houses - 6 rooms (%)
Rooms in owner-occupied houses - 7 rooms (%)
Rooms in owner-occupied houses - 8 rooms (%)
Rooms in owner-occupied houses - 9+ rooms (%)
Rooms in renter-occupied houses - 1 room (%)
Rooms in renter-occupied houses - 2 rooms (%)
Rooms in renter-occupied houses - 3 rooms (%)
Rooms in renter-occupied houses - 4 rooms (%)
Rooms in renter-occupied houses - 5 rooms (%)
Rooms in renter-occupied houses - 6 rooms (%)
Rooms in renter-occupied houses - 7 rooms (%)
Rooms in renter-occupied houses - 8 rooms (%)
Rooms in renter-occupied houses - 9+ rooms (%)
Bedrooms in owner-occupied houses - no bedrooms (%)
Bedrooms in owner-occupied houses - 1 bedroom (%)
Bedrooms in owner-occupied houses - 2 bedrooms (%)
Bedrooms in owner-occupied houses - 3 bedrooms (%)
Bedrooms in owner-occupied houses - 4 bedrooms (%)
Bedrooms in owner-occupied houses - 5+ bedrooms (%)
Bedrooms in renter-occupied houses - no bedrooms (%)
Bedrooms in renter-occupied houses - 1 bedroom (%)
Bedrooms in renter-occupied houses - 2 bedrooms (%)
Bedrooms in renter-occupied houses - 3 bedrooms (%)
Bedrooms in renter-occupied houses - 4 bedrooms (%)
Bedrooms in renter-occupied houses - 5+ bedrooms (%)
Vehicles available in owner-occupied houses - no vehicle available (%)
Vehicles available in owner-occupied houses - 1 vehicle available(%)
Vehicles available in owner-occupied houses - 2 Vehicles available (%)
Vehicles available in owner-occupied houses - 3 Vehicles available (%)
Vehicles available in owner-occupied houses - 4 Vehicles available (%)
Vehicles available in owner-occupied houses - 5+ Vehicles available (%)
Vehicles available in renter-occupied houses - no vehicle available (%)
Vehicles available in renter-occupied houses - 1 vehicle available (%)
Vehicles available in renter-occupied houses - 2 Vehicles available (%)
Vehicles available in renter-occupied houses - 3 Vehicles available (%)
Vehicles available in renter-occupied houses - 4 Vehicles available (%)
Vehicles available in renter-occupied houses - 5+ Vehicles available (%)
Housing units in structures - 1, detached (%)
Housing units in structures - 1, attached (%)
Housing units in structures - 2 (%)
Housing units in structures - 3 or 4 (%)
Housing units in structures - 5 to 9 (%)
Housing units in structures - 10 to 19 (%)
Housing units in structures - 20 to 49 (%)
Housing units in structures - 50 or more (%)
Housing units in structures - Mobile home (%)
Housing units in structures - Boat, RV, van, etc. (%)
Housing units in structures - Owners - 1, detached (%)
Housing units in structures - Owners - 1, attached (%)
Housing units in structures - Owners - 2 (%)
Housing units in structures - Owners - 3 or 4 (%)
Housing units in structures - Owners - 5 to 9 (%)
Housing units in structures - Owners - 10 to 19 (%)
Housing units in structures - Owners - 20 to 49 (%)
Housing units in structures - Owners - 50 or more (%)
Housing units in structures - Owners - Mobile home (%)
Housing units in structures - Owners - Boat, RV, van, etc. (%)
Housing units in structures - Renters - 1, detached (%)
Housing units in structures - Renters - 1, attached (%)
Housing units in structures - Renters - 2 (%)
Housing units in structures - Renters - 3 or 4 (%)
Housing units in structures - Renters - 5 to 9 (%)
Housing units in structures - Renters - 10 to 19 (%)
Housing units in structures - Renters - 20 to 49 (%)
Housing units in structures - Renters - 50 or more (%)
Housing units in structures - Renters - Mobile home (%)
Housing units in structures - Renters - Boat, RV, van, etc. (%)
House/condo owner moved in on average (years ago)
Renter moved in on average (years ago)
Year householder moved into unit - Moved in 1999 to March 2000 (%)
Year householder moved into unit - Moved in 1999 to March 2000 (%) - White
Year householder moved into unit - Moved in 1999 to March 2000 (%) - Black or African American
Year householder moved into unit - Moved in 1999 to March 2000 (%) - Asian
Year householder moved into unit - Moved in 1999 to March 2000 (%) - Hispanic or Latino
Year householder moved into unit - Moved in 1999 to March 2000 (%) - American Indian and Alaska Native
Year householder moved into unit - Moved in 1999 to March 2000 (%) - Multirace
Year householder moved into unit - Moved in 1999 to March 2000 (%) - Other Race
Year householder moved into unit - Moved in 1995 to 1998 (%)
Year householder moved into unit - Moved in 1995 to 1998 (%) - White
Year householder moved into unit - Moved in 1995 to 1998 (%) - Black or African American
Year householder moved into unit - Moved in 1995 to 1998 (%) - Asian
Year householder moved into unit - Moved in 1995 to 1998 (%) - Hispanic or Latino
Year householder moved into unit - Moved in 1995 to 1998 (%) - American Indian and Alaska Native
Year householder moved into unit - Moved in 1995 to 1998 (%) - Multirace
Year householder moved into unit - Moved in 1995 to 1998 (%) - Other Race
Year householder moved into unit - Moved in 1990 to 1994 (%)
Year householder moved into unit - Moved in 1990 to 1994 (%) - White
Year householder moved into unit - Moved in 1990 to 1994 (%) - Black or African American
Year householder moved into unit - Moved in 1990 to 1994 (%) - Asian
Year householder moved into unit - Moved in 1990 to 1994 (%) - Hispanic or Latino
Year householder moved into unit - Moved in 1990 to 1994 (%) - American Indian and Alaska Native
Year householder moved into unit - Moved in 1990 to 1994 (%) - Multirace
Year householder moved into unit - Moved in 1990 to 1994 (%) - Other Race
Year householder moved into unit - Moved in 1980 to 1989 (%)
Year householder moved into unit - Moved in 1980 to 1989 (%) - White
Year householder moved into unit - Moved in 1980 to 1989 (%) - Black or African American
Year householder moved into unit - Moved in 1980 to 1989 (%) - Asian
Year householder moved into unit - Moved in 1980 to 1989 (%) - Hispanic or Latino
Year householder moved into unit - Moved in 1980 to 1989 (%) - American Indian and Alaska Native
Year householder moved into unit - Moved in 1980 to 1989 (%) - Multirace
Year householder moved into unit - Moved in 1980 to 1989 (%) - Other Race
Year householder moved into unit - Moved in 1970 to 1979 (%)
Year householder moved into unit - Moved in 1970 to 1979 (%) - White
Year householder moved into unit - Moved in 1970 to 1979 (%) - Black or African American
Year householder moved into unit - Moved in 1970 to 1979 (%) - Asian
Year householder moved into unit - Moved in 1970 to 1979 (%) - Hispanic or Latino
Year householder moved into unit - Moved in 1970 to 1979 (%) - American Indian and Alaska Native
Year householder moved into unit - Moved in 1970 to 1979 (%) - Multirace
Year householder moved into unit - Moved in 1970 to 1979 (%) - Other Race
Year householder moved into unit - Moved in 1969 or earlier (%)
Year householder moved into unit - Moved in 1969 or earlier (%) - White
Year householder moved into unit - Moved in 1969 or earlier (%) - Black or African American
Year householder moved into unit - Moved in 1969 or earlier (%) - Asian
Year householder moved into unit - Moved in 1969 or earlier (%) - Hispanic or Latino
Year householder moved into unit - Moved in 1969 or earlier (%) - American Indian and Alaska Native
Year householder moved into unit - Moved in 1969 or earlier (%) - Multirace
Year householder moved into unit - Moved in 1969 or earlier (%) - Other Race
Housing units lacking complete plumbing facilities (%)
Housing units lacking complete kitchen facilities (%)
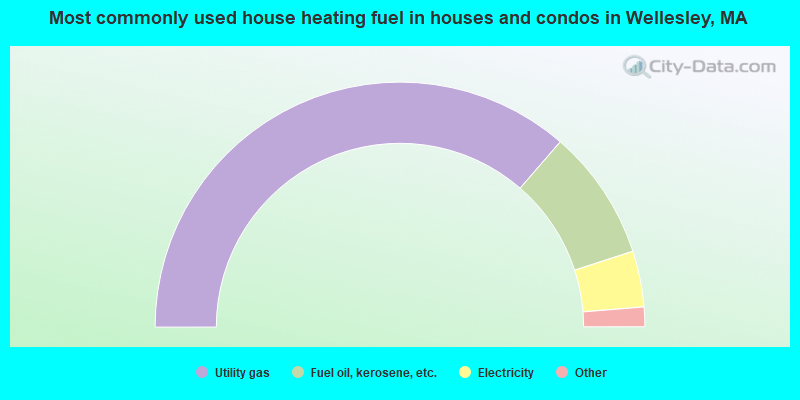
House heating fuel used in houses and condos - Utility gas (%)
House heating fuel used in houses and condos - Bottled, tank, or LP gas (%)
House heating fuel used in houses and condos - Electricity (%)
House heating fuel used in houses and condos - Fuel oil, kerosene, etc. (%)
House heating fuel used in houses and condos - Coal or coke (%)
House heating fuel used in houses and condos - Wood (%)
House heating fuel used in houses and condos - Solar energy (%)
House heating fuel used in houses and condos - Other fuel (%)
House heating fuel used in houses and condos - No fuel used (%)
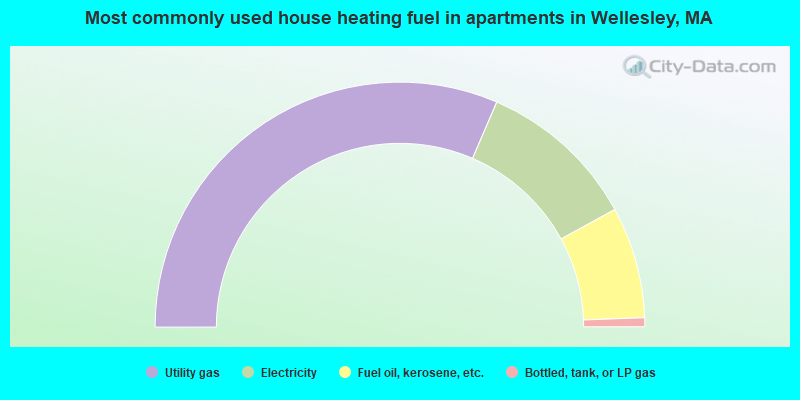
House heating fuel used in apartments - Utility gas (%)
House heating fuel used in apartments - Bottled, tank, or LP gas (%)
House heating fuel used in apartments - Electricity (%)
House heating fuel used in apartments - Fuel oil, kerosene, etc. (%)
House heating fuel used in apartments - Coal or coke (%)
House heating fuel used in apartments - Wood (%)
House heating fuel used in apartments - Solar energy (%)
House heating fuel used in apartments - Other fuel (%)
House heating fuel used in apartments - No fuel used (%)
Latest news about housing in Wellesley, MA collected exclusively by city-data.com from local newspapers, TV, and radio stations
Median year house/condo built: 1953Median year apartment built: 1964Household type by relationship:
Households: 30,003
Male householders: 4,387 (344 living alone ), Female householders: 4,610 (1,440 living alone )6,239 spouses (6,168 opposite-sex spouses ), 156 unmarried partners , (129 opposite-sex unmarried partners ), 9,259 children (8,698 natural , 143 adopted , 416 stepchildren ), 94 grandchildren , 15 brothers or sisters , 297 parents , 0 foster children , 142 other relatives , 316 non-relatives In group quarters: 4,483
Size of family households: 2,529 2-persons , 1,425 3-persons , 1,614 4-persons , 938 5-persons , 406 6-persons , 38 7-or-more-persons .
Size of nonfamily households: 1,863 1-person , 143 2-persons , 28 3-persons .
6,696 married couples with children. single-parent households (119 men , 538 women ).
79.4% of residents of Wellesley speak English at home. of residents speak Spanish at home (77% speak English very well , 16% speak English well , 7% speak English not well ).of residents speak other Indo-European language at home (74% speak English very well , 15% speak English well , 9% speak English not well , 2% don't speak English at all ).of residents speak Asian or Pacific Island language at home (70% speak English very well , 19% speak English well , 10% speak English not well , 1% don't speak English at all ).of residents speak other language at home (100% speak English very well ).
Foreign born population: 5,364 (17.9%)of them are naturalized citizens )
Median number of rooms in houses and condos:
Median number of rooms in apartments
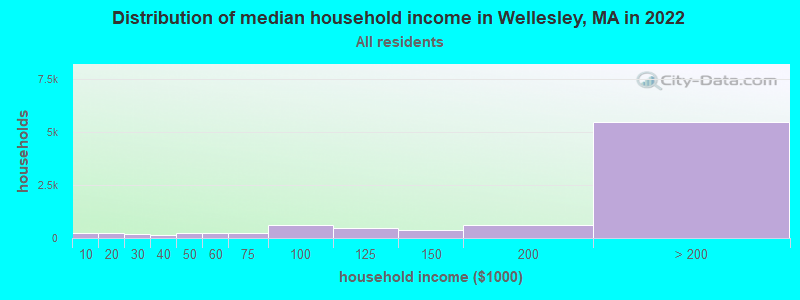
Wellesley, MA household income distribution 230 Less than $10,000237 $10,000 to $19,999192 $20,000 to $29,999140 $30,000 to $39,999218 $40,000 to $49,999226 $50,000 to $59,999256 $60,000 to $74,999593 $75,000 to $99,999490 $100,000 to $124,999360 $125,000 to $149,999598 $150,000 to $199,9995,460 $200,000 or more
Home value of owner - occupied houses in 2022 in Wellesley, MA 75 Less than $10,00034 $10,000 to $14,99920 $80,000 to $89,99925 $100,000 to $124,9997 $125,000 to $149,9994 $175,000 to $199,99954 $200,000 to $249,99919 $250,000 to $299,99923 $300,000 to $399,99974 $400,000 to $499,999386 $500,000 to $749,9991,315 $750,000 to $999,9992,491 $1,000,000 to $1,499,9992,040 $1,500,000 to $1,999,9992,331 $2,000,000 or moreRent paid by renters in 2022 in Wellesley, MA 10 $150 to $19916 $200 to $24947 $250 to $29931 $300 to $3496 $350 to $3998 $400 to $44917 $450 to $4993 $500 to $5496 $550 to $5997 $700 to $74913 $800 to $89927 $900 to $99950 $1,000 to $1,24990 $1,250 to $1,499105 $1,500 to $1,999194 $2,000 to $2,499198 $2,500 to $2,999145 $3,000 to $3,499338 $3,500 or more79 No cash rent
Percentage of workers working in this county: 58.1%Number of people working at home: 4,565 (35.2% of all workers )
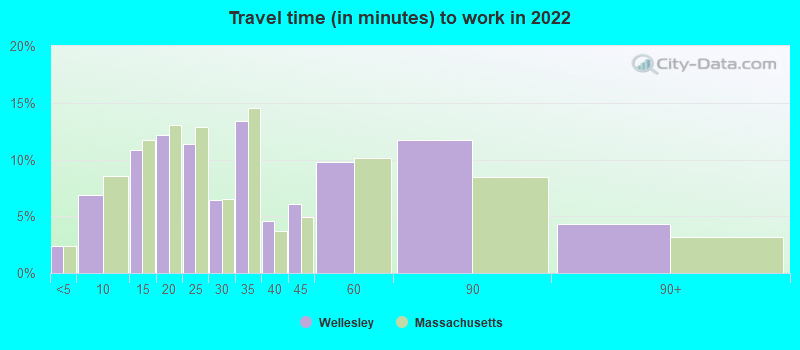
Travel time to work (commute)
Less than 5 minutes: 3185 to 9 minutes: 86510 to 14 minutes: 1,16015 to 19 minutes: 1,06620 to 24 minutes: 82725 to 29 minutes: 46930 to 34 minutes: 1,20335 to 39 minutes: 31740 to 44 minutes: 47745 to 59 minutes: 1,30160 to 89 minutes: 71290 or more minutes: 132
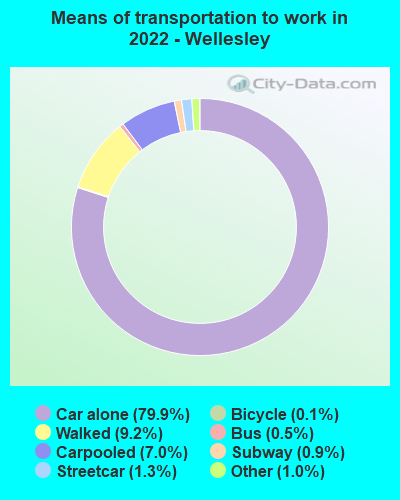
Means of transportation to work:
Drove a car alone: 13,327 (62.8%)Carpooled: 1,150 (5.4%)Bus : 60 (0.3%)Subway or elevated rail : 211 (1.0%)Long-distance train or commuter rail : 179 (0.8%)Light rail, streetcar or trolley : 12 (0.1%)Taxi: 173 (0.8%)Bicycle: 14 (0.1%)Walked: 1,454 (6.9%)Worked at home: 4,565 (21.5%)
Unemployment by race in 2022
Unemployment rate for White non-Hispanic residents 3.3% Males4.0% FemalesUnemployment rate for Black residents 6.3% Males25.7% FemalesUnemployment rate for Asian residents 1.3% Males0.9% FemalesUnemployment rate for two or more race residents 1.2% Males5.8% FemalesUnemployment rate for Hispanic or Latino residents 2.3% Females
Year of entry for the foreign-born population in Wellesley, Massachusetts
2,420 2010 or later 828 2000 to 2009 1,049 1990 to 1999 606 1980 to 1989 324 1970 to 1979 673 Before 1970
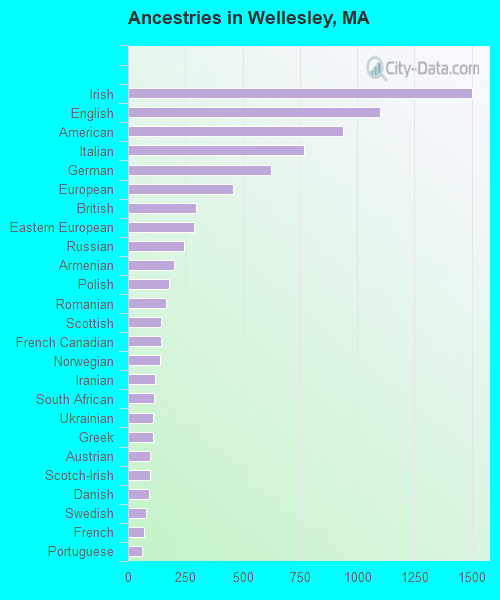
First ancestries reported:
Irish: 1,501 (10.8%)
English: 1,102 (7.9%)
American: 937 (6.7%)
Italian: 770 (5.5%)
German: 623 (4.5%)
European: 460 (3.3%)
British: 295 (2.1%)
Eastern European: 289 (2.1%)
Russian: 245 (1.8%)
Armenian: 203 (1.5%)
Polish: 179 (1.3%)
Romanian: 164 (1.2%)
Scottish: 144 (1.0%)
French Canadian: 144 (1.0%)
Norwegian: 141 (1.0%)
Iranian: 120 (0.9%)
South African: 112 (0.8%)
Ukrainian: 109 (0.8%)
Greek: 108 (0.8%)
Austrian: 95 (0.7%)
Scotch-Irish: 95 (0.7%)
Danish: 91 (0.7%)
Swedish: 79 (0.6%)
French: 71 (0.5%)
Portuguese: 59 (0.4%)
Canadian: 56 (0.4%)
African: 52 (0.4%)
Finnish: 51 (0.4%)
Northern European: 48 (0.3%)
Albanian: 40 (0.3%)
Lithuanian: 33 (0.2%)
Haitian: 33 (0.2%)
Dutch: 32 (0.2%)
Lebanese: 31 (0.2%)
Brazilian: 28 (0.2%)
Kenyan: 28 (0.2%)
Somali: 28 (0.2%)
Slovak: 23 (0.2%)
Swiss: 20 (0.1%)
Jamaican: 20 (0.1%)
Latvian: 19 (0.1%)
Hungarian: 19 (0.1%)
Afghan: 18 (0.1%)
Ghanaian: 16 (0.1%)
Czech: 16 (0.1%)
Turkish: 16 (0.1%)
Israeli: 15 (0.1%)
Cape Verdean: 12 (0.09%)
Belizean: 12 (0.09%)
Sierra Leonean: 10 (0.07%)
Croatian: 10 (0.07%)
Bulgarian: 10 (0.07%)
Belgian: 9 (0.06%)
Egyptian: 9 (0.06%)
Trinidadian and Tobagonian: 9 (0.06%)
Welsh: 7 (0.05%)
Jordanian: 7 (0.05%)
New Zealander: 6 (0.04%)
Zimbabwean: 4 (0.03%)
Most common places of birth for foreign-born residents (%): China, excluding Hong Kong and Taiwan Wellesley:
23.3% (1,245)Massachusetts:
8.4% (103,233)
India Wellesley:
7.1% (378)Massachusetts:
6.8% (82,934)
United Kingdom, excluding England and Scotland Wellesley:
7.0% (372)Massachusetts:
1.0% (12,709)
Canada Wellesley:
4.0% (213)Massachusetts:
2.3% (28,158)
Korea Wellesley:
3.2% (169)Massachusetts:
1.4% (17,613)
Argentina Wellesley:
2.5% (135)Massachusetts:
0.3% (3,727)
Hong Kong Wellesley:
2.5% (133)Massachusetts:
0.7% (8,536)
Russia Wellesley:
2.4% (127)Massachusetts:
1.5% (18,278)
Haiti Wellesley:
2.3% (122)Massachusetts:
4.9% (60,432)
Germany Wellesley:
2.2% (117)Massachusetts:
1.0% (12,529)
Spain Wellesley:
1.8% (96)Massachusetts:
0.4% (4,618)
Ireland Wellesley:
1.7% (91)Massachusetts:
1.1% (13,446)
Poland Wellesley:
1.5% (80)Massachusetts:
0.9% (10,915)
Place of birth for U.S.-born residents:
This state: 12,700Other state: 11,503Northeast: 4,753Midwest: 3,133South: 2,334West: 1,522 87.9% of Wellesley residents lived in the same house 1 years ago.
Out of people who lived in different houses, 18.5% lived in this county.
Out of people who lived in different counties, 38.8% lived in Massachusetts.
Wellesley:
87.9%State average:
87.7%
Education attainment for males 25 years and older:
No schooling: 65Nursery to 4th grade: 155th and 6th grade: 07th and 8th grade: 09th grade: 710th grade: 011th grade: 112th grade, no diploma: 53High school graduate (or equivalency): 358Less than 1 year of college: 157Some college more than 1 year, no degree: 176Associate degree: 145Bachelor's degree: 2,177Master's degree: 2,698Professional school degree: 1,135Doctorate degree: 791
Education attainment for females 25 years and older:
No schooling: 45Nursery to 4th grade: 185th and 6th grade: 277th and 8th grade: 09th grade: 010th grade: 811th grade: 912th grade, no diploma: 28High school graduate (or equivalency): 389Less than 1 year of college: 131Some college more than 1 year, no degree: 318Associate degree: 288Bachelor's degree: 3,261Master's degree: 2,817Professional school degree: 1,072Doctorate degree: 742
Housing units in structures:
One, detached: 7,788One, attached: 339Two: 2753 or 4: 2565 to 9: 8710 to 19: 9720 to 49: 39250 or more: 224Housing units lacking complete plumbing facilities in 2022: 0.8%Housing units lacking complete kitchen facilities in 2022: 1.6%House/condo owner moved in on average 11 years ago
Renter moved in on average 5 years ago
Private vs. public school enrollment:
Students in private schools in grades 1 to 8 (elementary and middle school): 745 Here:
20.2%Massachusetts:
10.3%
Students in private schools in grades 9 to 12 (high school): 407 Here:
22.1%Massachusetts:
12.3%
Students in private undergraduate colleges: 4,261 Here:
93.2%Massachusetts:
51.2%