Races in Wellesley, Massachusetts (MA) Detailed Stats
Data:
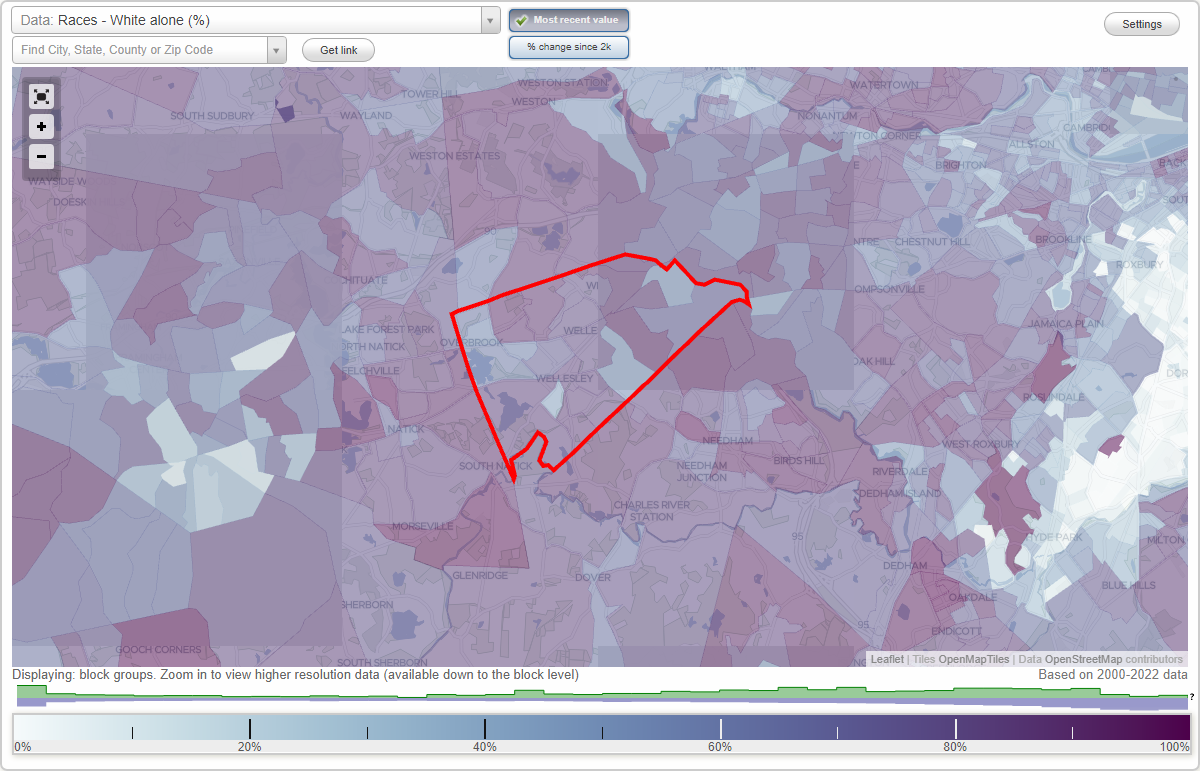
Races - White alone (%)
Races - White alone (% change since 2000)
Races - Black alone (%)
Races - Black alone (% change since 2000)
Races - American Indian alone (%)
Races - American Indian alone (% change since 2000)
Races - Asian alone (%)
Races - Asian alone (% change since 2000)
Races - Hispanic (%)
Races - Hispanic (% change since 2000)
Races - Native Hawaiian and Other Pacific Islander alone (%)
Races - Native Hawaiian and Other Pacific Islander alone (% change since 2000)
Races - Two or more races(%)
Races - Two or more races(% change since 2000)
Races - Other race alone (%)
Races - Other race alone (% change since 2000)
Racial diversity
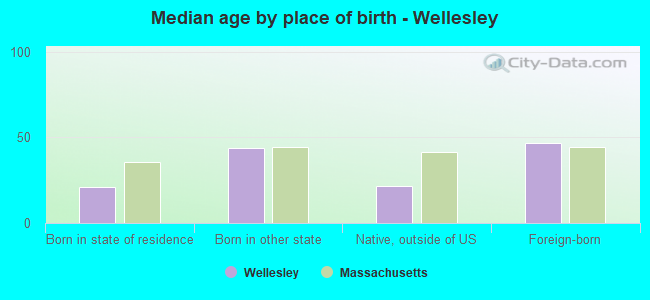
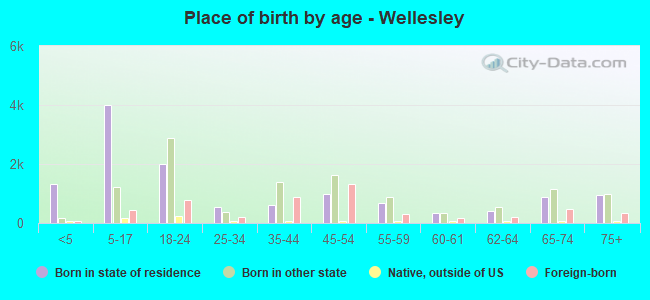
Place of birth - Born in state of residence (%)
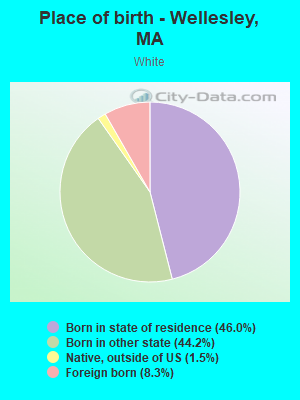
Place of birth - Born in state of residence (%) - White
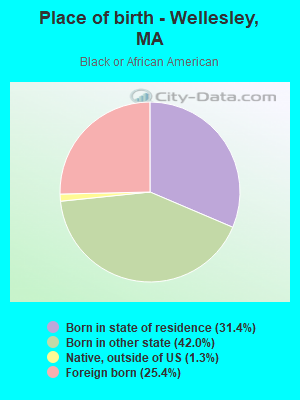
Place of birth - Born in state of residence (%) - Black or African American
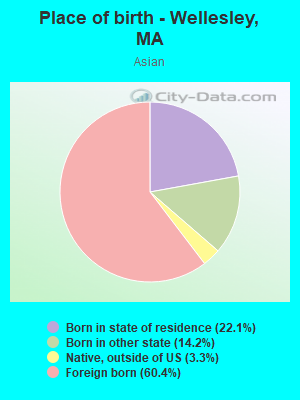
Place of birth - Born in state of residence (%) - Asian
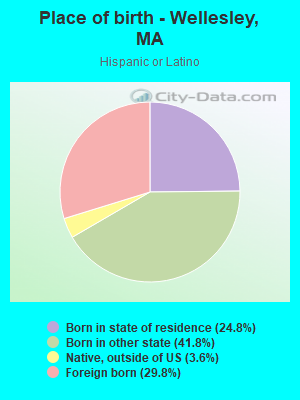
Place of birth - Born in state of residence (%) - Hispanic or Latino
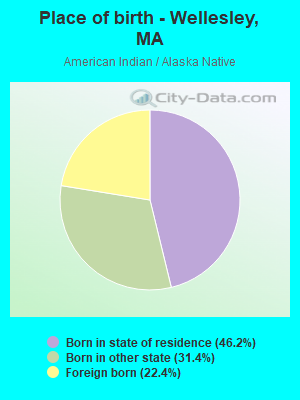
Place of birth - Born in state of residence (%) - American Indian and Alaska Native
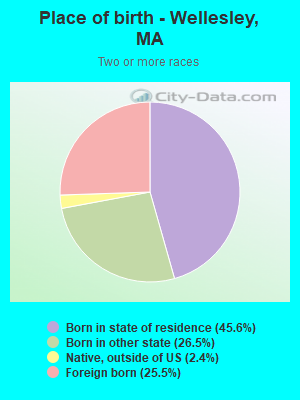
Place of birth - Born in state of residence (%) - Multirace
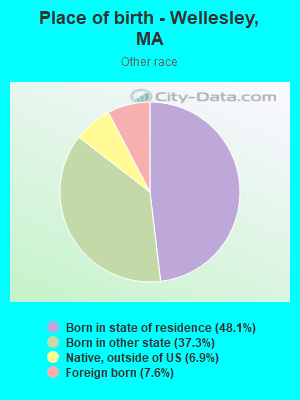
Place of birth - Born in state of residence (%) - Other Race
Place of birth - Born in other state (%)
Place of birth - Born in other state (%) - White
Place of birth - Born in other state (%) - Black or African American
Place of birth - Born in other state (%) - Asian
Place of birth - Born in other state (%) - Hispanic or Latino
Place of birth - Born in other state (%) - American Indian and Alaska Native
Place of birth - Born in other state (%) - Multirace
Place of birth - Born in other state (%) - Other Race
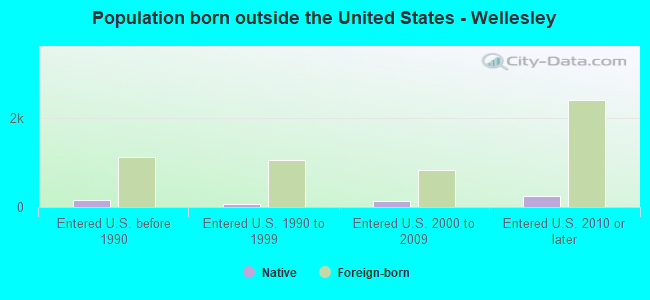
Place of birth - Native, outside of US (%)
Place of birth - Native, outside of US (%) - White
Place of birth - Native, outside of US (%) - Black or African American
Place of birth - Native, outside of US (%) - Asian
Place of birth - Native, outside of US (%) - Hispanic or Latino
Place of birth - Native, outside of US (%) - American Indian and Alaska Native
Place of birth - Native, outside of US (%) - Multirace
Place of birth - Native, outside of US (%) - Other Race
Place of birth - Foreign born (%)
Place of birth - Foreign born (%) - White
Place of birth - Foreign born (%) - Black or African American
Place of birth - Foreign born (%) - Asian
Place of birth - Foreign born (%) - Hispanic or Latino
Place of birth - Foreign born (%) - American Indian and Alaska Native
Place of birth - Foreign born (%) - Multirace
Place of birth - Foreign born (%) - Other Race
Residents speaking English at home (%)
Residents speaking English at home - Born in the United States (%)
Residents speaking English at home - Native, born elsewhere (%)
Residents speaking English at home - Foreign born (%)
Residents speaking Spanish at home (%)
Residents speaking Spanish at home - Born in the United States (%)
Residents speaking Spanish at home - Native, born elsewhere (%)
Residents speaking Spanish at home - Foreign born (%)
Residents speaking other language at home (%)
Residents speaking other language at home - Born in the United States (%)
Residents speaking other language at home - Native, born elsewhere (%)
Residents speaking other language at home - Foreign born (%)
Marital status - Never married (%)
Marital status - Now married (%)
Marital status - Separated (%)
Marital status - Widowed (%)
Marital status - Divorced (%)
Ancestries Reported - Arab (%)
Ancestries Reported - Czech (%)
Ancestries Reported - Danish (%)
Ancestries Reported - Dutch (%)
Ancestries Reported - English (%)
Ancestries Reported - French (%)
Ancestries Reported - French Canadian (%)
Ancestries Reported - German (%)
Ancestries Reported - Greek (%)
Ancestries Reported - Hungarian (%)
Ancestries Reported - Irish (%)
Ancestries Reported - Italian (%)
Ancestries Reported - Lithuanian (%)
Ancestries Reported - Norwegian (%)
Ancestries Reported - Polish (%)
Ancestries Reported - Portuguese (%)
Ancestries Reported - Russian (%)
Ancestries Reported - Scotch-Irish (%)
Ancestries Reported - Scottish (%)
Ancestries Reported - Slovak (%)
Ancestries Reported - Subsaharan African (%)
Ancestries Reported - Swedish (%)
Ancestries Reported - Swiss (%)
Ancestries Reported - Ukrainian (%)
Ancestries Reported - United States (%)
Ancestries Reported - Welsh (%)
Ancestries Reported - West Indian (%)
Ancestries Reported - Other (%)
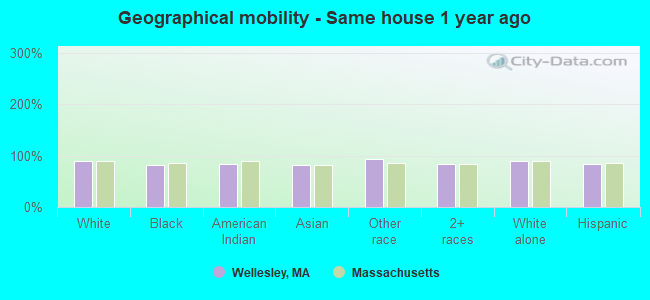
Geographical mobility - Same house 1 year ago (%)
Geographical mobility - Same house 1 year ago (%) - White
Geographical mobility - Same house 1 year ago (%) - Black or African American
Geographical mobility - Same house 1 year ago (%) - Asian
Geographical mobility - Same house 1 year ago (%) - Hispanic or Latino
Geographical mobility - Same house 1 year ago (%) - American Indian and Alaska Native
Geographical mobility - Same house 1 year ago (%) - Multirace
Geographical mobility - Same house 1 year ago (%) - Other Race
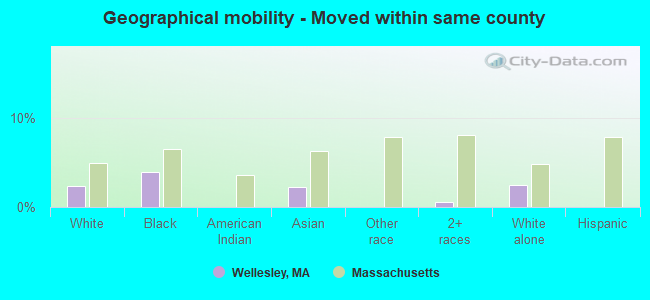
Geographical mobility - Moved within same county (%)
Geographical mobility - Moved within same county (%) - White
Geographical mobility - Moved within same county (%) - Black or African American
Geographical mobility - Moved within same county (%) - Asian
Geographical mobility - Moved within same county (%) - Hispanic or Latino
Geographical mobility - Moved within same county (%) - American Indian and Alaska Native
Geographical mobility - Moved within same county (%) - Multirace
Geographical mobility - Moved within same county (%) - Other Race
Geographical mobility - Moved from different county within same state (%)
Geographical mobility - Moved from different county within same state (%) - White
Geographical mobility - Moved from different county within same state (%) - Black or African American
Geographical mobility - Moved from different county within same state (%) - Asian
Geographical mobility - Moved from different county within same state (%) - Hispanic or Latino
Geographical mobility - Moved from different county within same state (%) - American Indian and Alaska Native
Geographical mobility - Moved from different county within same state (%) - Multirace
Geographical mobility - Moved from different county within same state (%) - Other Race
Geographical mobility - Moved from different state (%)
Geographical mobility - Moved from different state (%) - White
Geographical mobility - Moved from different state (%) - Black or African American
Geographical mobility - Moved from different state (%) - Asian
Geographical mobility - Moved from different state (%) - Hispanic or Latino
Geographical mobility - Moved from different state (%) - American Indian and Alaska Native
Geographical mobility - Moved from different state (%) - Multirace
Geographical mobility - Moved from different state (%) - Other Race
Geographical mobility - Moved from abroad (%)
Geographical mobility - Moved from abroad (%) - White
Geographical mobility - Moved from abroad (%) - Black or African American
Geographical mobility - Moved from abroad (%) - Asian
Geographical mobility - Moved from abroad (%) - Hispanic or Latino
Geographical mobility - Moved from abroad (%) - American Indian and Alaska Native
Geographical mobility - Moved from abroad (%) - Multirace
Geographical mobility - Moved from abroad (%) - Other Race
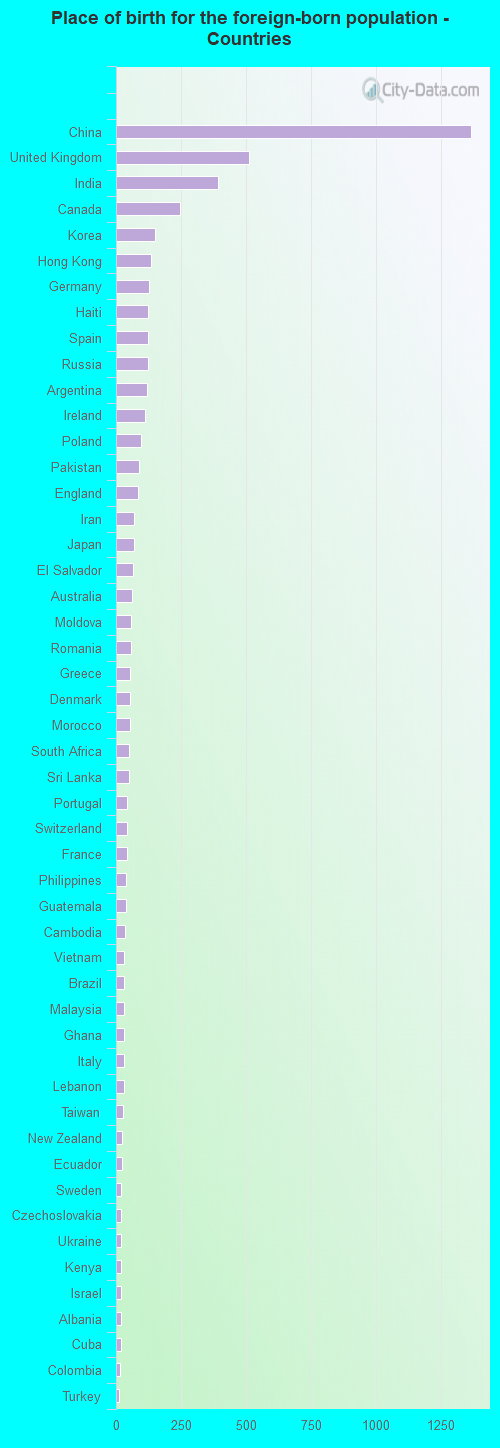
Place of birth for the foreign-born population - Ireland (%)
Place of birth for the foreign-born population - Denmark (%)
Place of birth for the foreign-born population - Norway (%)
Place of birth for the foreign-born population - Sweden (%)
Place of birth for the foreign-born population - United Kingdom (%)
Place of birth for the foreign-born population - England (%)
Place of birth for the foreign-born population - Scotland (%)
Place of birth for the foreign-born population - Other Northern Europe (%)
Place of birth for the foreign-born population - Austria (%)
Place of birth for the foreign-born population - Belgium (%)
Place of birth for the foreign-born population - France (%)
Place of birth for the foreign-born population - Germany (%)
Place of birth for the foreign-born population - Netherlands (%)
Place of birth for the foreign-born population - Switzerland (%)
Place of birth for the foreign-born population - Other Western Europe (%)
Place of birth for the foreign-born population - Greece (%)
Place of birth for the foreign-born population - Italy (%)
Place of birth for the foreign-born population - Portugal (%)
Place of birth for the foreign-born population - Spain (%)
Place of birth for the foreign-born population - Other Southern Europe (%)
Place of birth for the foreign-born population - Albania (%)
Place of birth for the foreign-born population - Belarus (%)
Place of birth for the foreign-born population - Bosnia and Herzegovina (%)
Place of birth for the foreign-born population - Bulgaria (%)
Place of birth for the foreign-born population - Croatia (%)
Place of birth for the foreign-born population - Czechoslovakia (%)
Place of birth for the foreign-born population - Hungary (%)
Place of birth for the foreign-born population - Latvia (%)
Place of birth for the foreign-born population - Lithuania (%)
Place of birth for the foreign-born population - North Macedonia (Macedonia) (%)
Place of birth for the foreign-born population - Moldova (%)
Place of birth for the foreign-born population - Poland (%)
Place of birth for the foreign-born population - Romania (%)
Place of birth for the foreign-born population - Russia (%)
Place of birth for the foreign-born population - Serbia (%)
Place of birth for the foreign-born population - Ukraine (%)
Place of birth for the foreign-born population - Other Eastern Europe (%)
Place of birth for the foreign-born population - China (%)
Place of birth for the foreign-born population - Hong Kong (%)
Place of birth for the foreign-born population - Taiwan (%)
Place of birth for the foreign-born population - Japan (%)
Place of birth for the foreign-born population - Korea (%)
Place of birth for the foreign-born population - Other Eastern Asia (%)
Place of birth for the foreign-born population - Afghanistan (%)
Place of birth for the foreign-born population - Bangladesh (%)
Place of birth for the foreign-born population - India (%)
Place of birth for the foreign-born population - Iran (%)
Place of birth for the foreign-born population - Kazakhstan (%)
Place of birth for the foreign-born population - Nepal (%)
Place of birth for the foreign-born population - Pakistan (%)
Place of birth for the foreign-born population - Sri Lanka (%)
Place of birth for the foreign-born population - Uzbekistan (%)
Place of birth for the foreign-born population - Other South Central Asia (%)
Place of birth for the foreign-born population - Burma (%)
Place of birth for the foreign-born population - Cambodia (%)
Place of birth for the foreign-born population - Indonesia (%)
Place of birth for the foreign-born population - Laos (%)
Place of birth for the foreign-born population - Malaysia (%)
Place of birth for the foreign-born population - Philippines (%)
Place of birth for the foreign-born population - Singapore (%)
Place of birth for the foreign-born population - Thailand (%)
Place of birth for the foreign-born population - Vietnam (%)
Place of birth for the foreign-born population - Other South Eastern Asia (%)
Place of birth for the foreign-born population - Armenia (%)
Place of birth for the foreign-born population - Iraq (%)
Place of birth for the foreign-born population - Israel (%)
Place of birth for the foreign-born population - Jordan (%)
Place of birth for the foreign-born population - Kuwait (%)
Place of birth for the foreign-born population - Lebanon (%)
Place of birth for the foreign-born population - Saudi Arabia (%)
Place of birth for the foreign-born population - Syria (%)
Place of birth for the foreign-born population - Turkey (%)
Place of birth for the foreign-born population - Yemen (%)
Place of birth for the foreign-born population - Other Western Asia (%)
Place of birth for the foreign-born population - Eritrea (%)
Place of birth for the foreign-born population - Ethiopia (%)
Place of birth for the foreign-born population - Kenya (%)
Place of birth for the foreign-born population - Somalia (%)
Place of birth for the foreign-born population - Uganda (%)
Place of birth for the foreign-born population - Zimbabwe (%)
Place of birth for the foreign-born population - Other Eastern Africa (%)
Place of birth for the foreign-born population - Cameroon (%)
Place of birth for the foreign-born population - Congo (%)
Place of birth for the foreign-born population - Democratic Republic of Congo (Zaire) (%)
Place of birth for the foreign-born population - Other Middle Africa (%)
Place of birth for the foreign-born population - Egypt (%)
Place of birth for the foreign-born population - Morocco (%)
Place of birth for the foreign-born population - Sudan (%)
Place of birth for the foreign-born population - Other Northern Africa (%)
Place of birth for the foreign-born population - South Africa (%)
Place of birth for the foreign-born population - Other Southern Africa (%)
Place of birth for the foreign-born population - Cabo Verde (%)
Place of birth for the foreign-born population - Ghana (%)
Place of birth for the foreign-born population - Liberia (%)
Place of birth for the foreign-born population - Nigeria (%)
Place of birth for the foreign-born population - Senegal (%)
Place of birth for the foreign-born population - Sierra Leone (%)
Place of birth for the foreign-born population - Other Western Africa (%)
Place of birth for the foreign-born population - Australia (%)
Place of birth for the foreign-born population - New Zealand (%)
Place of birth for the foreign-born population - Fiji (%)
Place of birth for the foreign-born population - Micronesia (%)
Place of birth for the foreign-born population - Bahamas (%)
Place of birth for the foreign-born population - Barbados (%)
Place of birth for the foreign-born population - Cuba (%)
Place of birth for the foreign-born population - Dominica (%)
Place of birth for the foreign-born population - Dominican Republic (%)
Place of birth for the foreign-born population - Grenada (%)
Place of birth for the foreign-born population - Haiti (%)
Place of birth for the foreign-born population - Jamaica (%)
Place of birth for the foreign-born population - St. Vincent and the Grenadines (%)
Place of birth for the foreign-born population - Trinidad and Tobago (%)
Place of birth for the foreign-born population - West Indies (%)
Place of birth for the foreign-born population - Other Caribbean (%)
Place of birth for the foreign-born population - Belize (%)
Place of birth for the foreign-born population - Costa Rica (%)
Place of birth for the foreign-born population - El Salvador (%)
Place of birth for the foreign-born population - Guatemala (%)
Place of birth for the foreign-born population - Honduras (%)
Place of birth for the foreign-born population - Mexico (%)
Place of birth for the foreign-born population - Nicaragua (%)
Place of birth for the foreign-born population - Panama (%)
Place of birth for the foreign-born population - Other Central America (%)
Place of birth for the foreign-born population - Argentina (%)
Place of birth for the foreign-born population - Bolivia (%)
Place of birth for the foreign-born population - Brazil (%)
Place of birth for the foreign-born population - Chile (%)
Place of birth for the foreign-born population - Colombia (%)
Place of birth for the foreign-born population - Ecuador (%)
Place of birth for the foreign-born population - Guyana (%)
Place of birth for the foreign-born population - Peru (%)
Place of birth for the foreign-born population - Uruguay (%)
Place of birth for the foreign-born population - Venezuela (%)
Place of birth for the foreign-born population - Other South America (%)
Place of birth for the foreign-born population - Canada (%)
Place of birth for the foreign-born population - Other Northern America (%)
Place of birth for the foreign-born population - Other (%)
Latest news about races in Wellesley, MA collected exclusively by city-data.com from local newspapers, TV, and radio stations
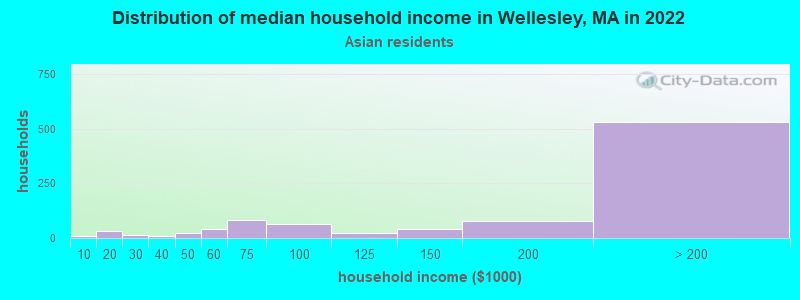
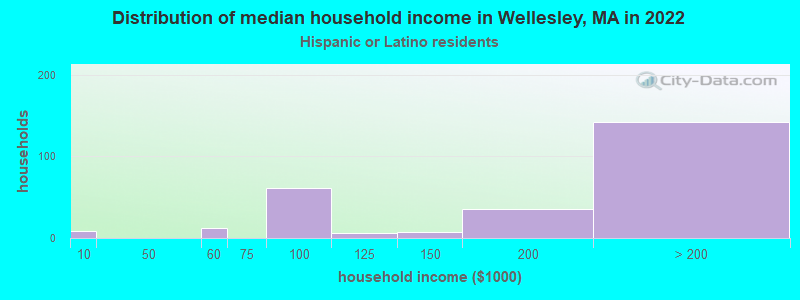
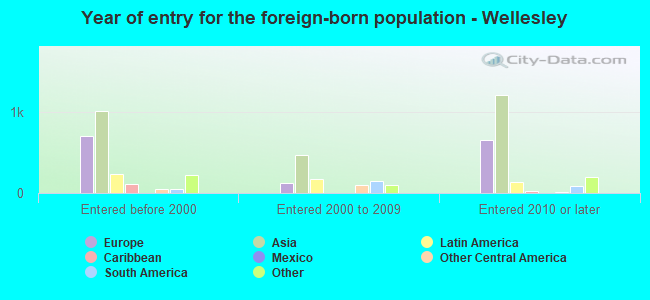
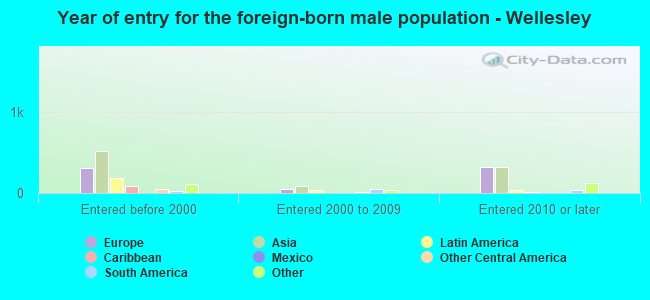
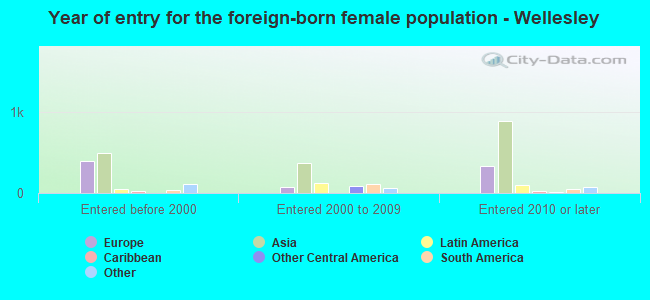
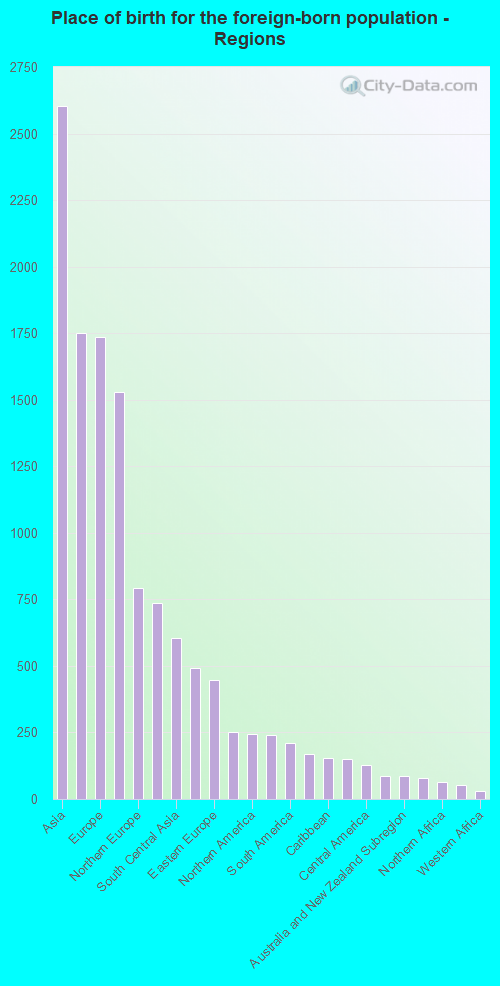
According to 2022 data, the most numerous races in Wellesley, MA are White alone (21,267 residents), Hispanic (1,751 residents), and Asian alone (4,101 residents). 79.5% of Wellesley residents speak English at home. 17.8% of Wellesley, MA residents are foreign-born (8.5% born in Asia, 5.7% born in Europe), which is about the same as the foreign-born rate of 18.0% across the entire state of Massachusetts.
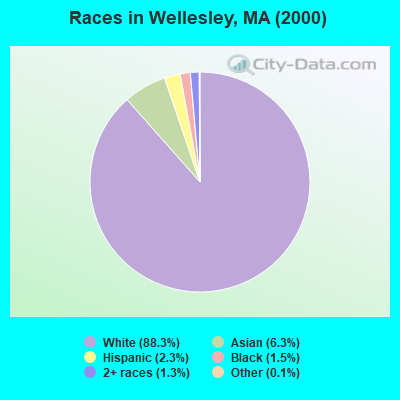
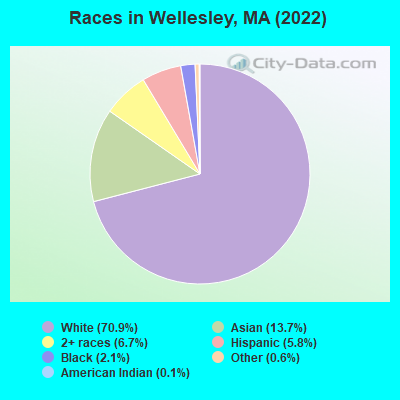
Race distribution in Wellesley
2000 2022
5,198,359 81.9% White alone 428,729 6.8% Hispanic 318,329 5.0% Black alone 236,786 3.7% Asian alone 110,338 1.7% Two or more races 43,586 0.7% Other race alone 11,264 0.2% American Indian alone 1,706 0.03% Native Hawaiian and Other
4,676,627 67.0% White alone 911,038 13.0% Hispanic 501,463 7.2% Asian alone 459,740 6.6% Black alone 341,889 4.9% Two or more races 84,403 1.2% Other race alone 5,838 0.08% American Indian alone 976 0.01% Native Hawaiian and Other
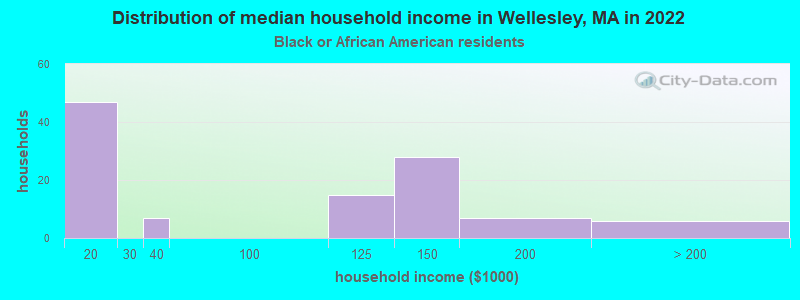
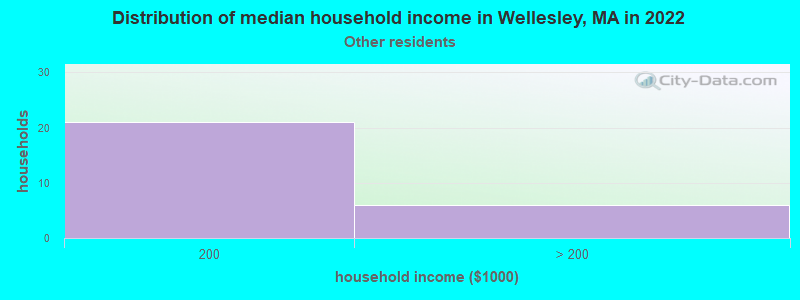
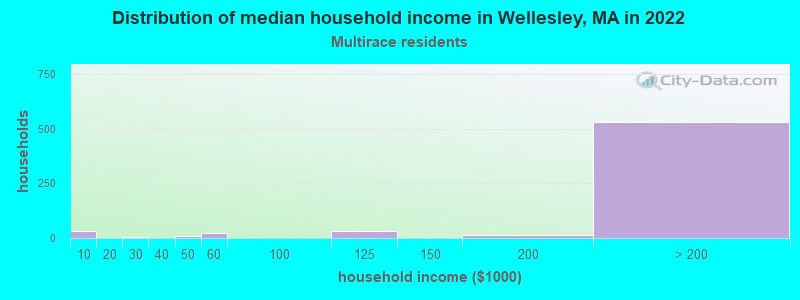
Income and house value in Wellesley Median household income in 2022 over $200,000 White non-Hispanic householdersover $200,000 Asian householdersover $200,000 Two or more races householdersover $200,000 Hispanic or Latino race householdersMedian 2022 house value over $1,000,000 White Non-Hispanic householders$995,385 Black or African American householders over $1,000,000 Asian householders$914,407 Some other race householdersover $1,000,000 Hispanic or Latino householders
Median age by race in Wellesley
43.8 Median age for White residents42.9 44.3 19.8 Median age for Black or African American residents49.7 20.0 18.8 Median age for American Indian / Alaska Native residents50.8 18.4 23.9 Median age for Asian residents40.2 22.4 -514,227,641.8 Median age for Native Hawaiian / Pacific Islander residents-513,131,312.6 -508,717,948.2 20.3 Median age for Other race residents24.5 19.5 20.1 Median age for Two or more races residents21.3 19.0 44.1 Median age for White alone residents43.3 44.9 20.9 Median age for Hispanic or Latino residents21.0 20.7
Owner/renter occupied households by race in Wellesley
House owners and renters - White residents 6,314 86.0% Owner occupied1,027 14.0% Renter occupiedHouse owners and renters - Black or African American residents 37 43.8% Owner occupied48 56.2% Renter occupiedHouse owners and renters - American Indian / Alaska Native residents 10 100.0% Owner occupiedHouse owners and renters - Asian residents 883 90.1% Owner occupied97 9.9% Renter occupiedHouse owners and renters - Other race residents 6 15.0% Owner occupied33 85.0% Renter occupiedHouse owners and renters - Two or more races residents 431 72.0% Owner occupied167 28.0% Renter occupiedHouse owners and renters - White alone residents 6,303 86.5% Owner occupied984 13.5% Renter occupiedHouse owners and renters - Hispanic or Latino residents 156 53.5% Owner occupied136 46.5% Renter occupied
Language usage in Wellesley
English speakers - Total 79.5% of residents of Wellesley speak English at home.
3.7% of residents speak Spanish at home 831 78.6% Speak English very well226 21.4% Speak English less than very well16.6% of residents speak other language at home 3,505 74.1% Speak English very well1,225 25.9% Speak English less than very well
English speakers - Born in the United States 90.1% of residents of Wellesley speak English at home.
3.6% of residents speak Spanish at home 329 81.2% Speak English very well76 18.8% Speak English less than very well6.3% of residents speak other language at home 657 91.8% Speak English very well59 8.2% Speak English less than very well
English speakers - Native, born elsewhere 77.8% of residents of Wellesley speak English at home.
4.8% of residents speak Spanish at home 29 100.0% Speak English very well15.8% of residents speak other language at home 93 97.9% Speak English very well2 2.1% Speak English less than very well
English speakers - Foreign-born 31.8% of residents of Wellesley speak English at home.
7.8% of residents speak Spanish at home 328 78.7% Speak English very well89 21.3% Speak English less than very well59.2% of residents speak other language at home 2,145 68.0% Speak English very well1,010 32.0% Speak English less than very well
White (Caucasian) - Speak only English Native:
95.5% (18,147)Foreign-born:
54.5% (975)
White (Caucasian) - Speak another language Native:
4.5% (847)Foreign-born:
44.8% (802)
Black or African American - Speak only English Native:
78.2% (357)Foreign-born:
30.3% (46)
Black or African American - Speak another language Native:
22.2% (101)Foreign-born:
66.0% (101)
American Indian / Alaska Native - Speak another language Native:
40.6% (24)Foreign-born:
100.0% (17)
Asian - Speak only English Native:
46.6% (699)Foreign-born:
20.8% (514)
Asian - Speak another language Native:
53.5% (803)Foreign-born:
80.7% (1,995)
Other race - Speak only English Native:
80.6% (269)Foreign-born:
46.1% (15)
Other race - Speak another language Native:
26.3% (88)Foreign-born:
60.8% (20)
Two or more races - Speak only English Native:
81.3% (1,512)Foreign-born:
18.7% (149)
Two or more races - Speak another language Native:
18.6% (345)Foreign-born:
81.1% (647)
White alone - Speak only English Native:
96.1% (17,930)Foreign-born:
55.2% (973)
White alone - Speak another language Native:
3.9% (722)Foreign-born:
42.2% (744)
Hispanic or Latino - Speak only English Native:
52.0% (537)Foreign-born:
11.0% (59)
Hispanic or Latino - Speak another language Native:
47.7% (494)Foreign-born:
89.1% (476)
Foreign-born residents in Wellesley 5,333 residents are foreign born (8.5% Asia , 5.7% Europe ).
This city:
17.8%Massachusetts:
17.6%
Marital status for residents in Wellesley Marital status - White (Caucasian) population 15 years and over
Males 31.0% Never married64.0% Now married1.0% Separated1.5% Widowed2.4% DivorcedFemales 32.5% Never married50.8% Now married1.2% Separated7.9% Widowed7.5% DivorcedWomen who gave birth in the past 12 months Now married:
100.0% (221)Unmarried:
0.0% (0)
Women who did not give birth in the past 12 months Now married:
39.7% (1,866)Unmarried:
60.3% (2,829)
Marital status - Black or African American population 15 years and over
Males 47.3% Never married25.5% Now married0.0% Separated0.0% Widowed27.3% DivorcedFemales 86.9% Never married7.8% Now married0.0% Separated0.0% Widowed5.3% DivorcedWomen who did not give birth in the past 12 months Now married:
1.8% (8)Unmarried:
98.2% (419)
Marital status - American Indian / Alaska Native population 15 years and over
Males 45.5% Never married54.5% Now married0.0% Separated0.0% Widowed0.0% DivorcedFemales 100.0% Never married0.0% Now married0.0% Separated0.0% Widowed0.0% DivorcedWomen who did not give birth in the past 12 months Now married:
0.0% (0)Unmarried:
100.0% (44)
Marital status - Asian population 15 years and over
Males 20.4% Never married79.2% Now married0.0% Separated0.0% Widowed0.4% DivorcedFemales 52.4% Never married43.9% Now married0.4% Separated0.1% Widowed3.2% DivorcedWomen who gave birth in the past 12 months Now married:
100.0% (85)Unmarried:
0.0% (0)
Women who did not give birth in the past 12 months Now married:
31.3% (586)Unmarried:
68.7% (1,284)
Marital status - Other race population 15 years and over
Males 49.5% Never married50.5% Now married0.0% Separated0.0% Widowed0.0% DivorcedFemales 74.6% Never married25.4% Now married0.0% Separated0.0% Widowed0.0% DivorcedWomen who did not give birth in the past 12 months Now married:
25.4% (47)Unmarried:
74.6% (139)
Marital status - Two or more races population 15 years and over
Males 40.1% Never married53.1% Now married5.9% Separated0.9% Widowed0.0% DivorcedFemales 51.9% Never married37.5% Now married0.0% Separated7.3% Widowed3.3% DivorcedWomen who gave birth in the past 12 months Now married:
100.0% (28)Unmarried:
0.0% (0)
Women who did not give birth in the past 12 months Now married:
30.2% (224)Unmarried:
69.8% (516)
Marital status - White alone, not Hispanic / Latino population 15 years and over
Males 30.4% Never married65.2% Now married0.4% Separated1.6% Widowed2.4% DivorcedFemales 31.6% Never married51.3% Now married1.3% Separated8.2% Widowed7.6% DivorcedWomen who gave birth in the past 12 months Now married:
100.0% (208)Unmarried:
0.0% (0)
Women who did not give birth in the past 12 months Now married:
40.8% (1,870)Unmarried:
59.2% (2,708)
Marital status - Hispanic or Latino population 15 years and over
Males 54.5% Never married35.3% Now married10.2% Separated0.0% Widowed0.0% DivorcedFemales 56.7% Never married37.6% Now married0.0% Separated3.2% Widowed2.4% DivorcedWomen who gave birth in the past 12 months Now married:
100.0% (36)Unmarried:
0.0% (0)
Women who did not give birth in the past 12 months Now married:
26.7% (162)Unmarried:
73.3% (445)
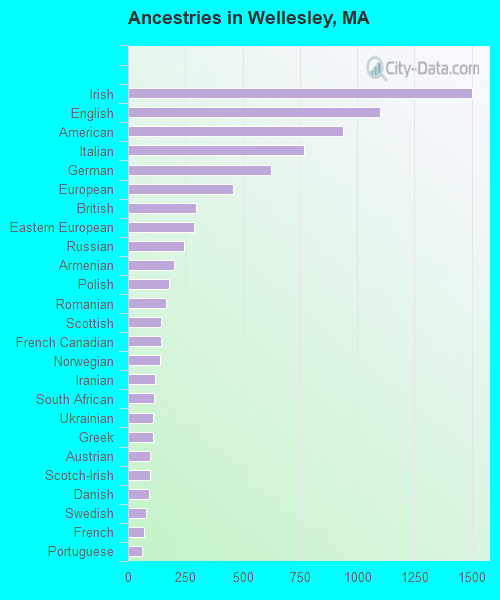
Ancestries in Wellesley
1,501 10.8% Irish1,102 7.9% English937 6.7% American770 5.5% Italian623 4.5% German460 3.3% European295 2.1% British289 2.1% Eastern European245 1.8% Russian203 1.5% Armenian179 1.3% Polish164 1.2% Romanian144 1.0% Scottish144 1.0% French Canadian141 1.0% Norwegian120 0.9% Iranian112 0.8% South African109 0.8% Ukrainian108 0.8% Greek95 0.7% Austrian95 0.7% Scotch-Irish91 0.7% Danish79 0.6% Swedish71 0.5% French59 0.4% Portuguese56 0.4% Canadian52 0.4% African51 0.4% Finnish48 0.3% Northern European40 0.3% Albanian33 0.2% Lithuanian33 0.2% Haitian32 0.2% Dutch31 0.2% Lebanese28 0.2% Brazilian28 0.2% Kenyan28 0.2% Somali23 0.2% Slovak20 0.1% Swiss20 0.1% Jamaican19 0.1% Latvian19 0.1% Hungarian18 0.1% Afghan16 0.1% Ghanaian16 0.1% Czech16 0.1% Turkish15 0.1% Israeli12 0.09% Cape Verdean12 0.09% Belizean10 0.07% Sierra Leonean10 0.07% Croatian10 0.07% Bulgarian9 0.06% Belgian9 0.06% Egyptian9 0.06% Trinidadian and Tobagonian7 0.05% Welsh7 0.05% Jordanian6 0.04% New Zealander4 0.03% Zimbabwean
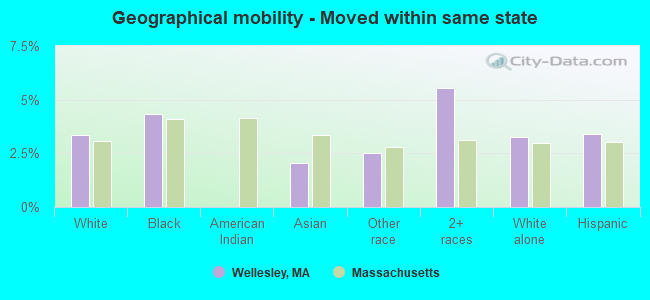
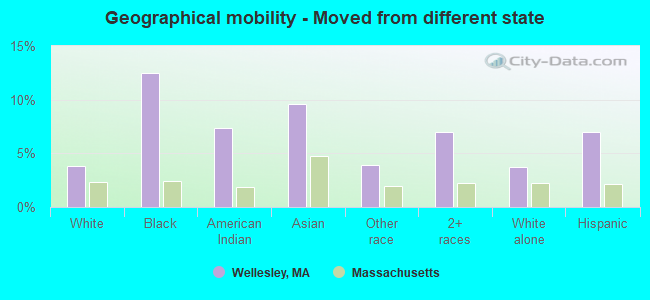
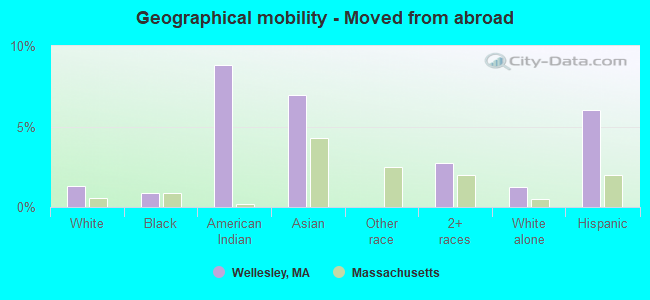
Geographical mobility in Wellesley Same house 1 year ago 19,275 89.6% White (Caucasian)520 81.0% Black or African American69 83.0% American Indian / Alaska Native3,273 81.0% Asian332 93.9% Other race2,471 83.5% Two or more races18,938 89.7% White alone, not Hispanic / Latino1,427 84.4% Hispanic or LatinoMoved within same county 509 2.4% White / Caucasian25 3.9% Black or African American91 2.3% Asian17 0.6% Two or more races516 2.4% White alone, not Hispanic / LatinoMoved within same state 723 3.4% White / Caucasian28 4.4% Black or African American82 2.0% Asian9 2.5% Other race164 5.6% Two or more races690 3.3% White alone, not Hispanic / Latino58 3.4% Hispanic or LatinoMoved from different state 831 3.9% White / Caucasian80 12.5% Black or African American6 7.4% American Indian / Alaska Native387 9.6% Asian14 3.9% Other race207 7.0% Two or more races793 3.8% White alone, not Hispanic / Latino117 6.9% Hispanic or LatinoMoved from abroad 276 1.3% White6 0.9% Black or African American7 8.8% American Indian / Alaska Native282 7.0% Asian80 2.7% Two or more races265 1.3% White alone, not Hispanic / Latino102 6.0% Hispanic or Latino
Children Nativity (place of birth) in Wellesley
Children under 6 years - Living with two parents Both parents native 1,221 99.9% Native2 0.1% Foreign-bornBoth parents foreign-born 186 86.7% Native29 13.3% Foreign-bornOne native, one foreign-born parent 333 100.0% NativeChildren under 6 years - Living with one parent Native parent 56 100.0% NativeForeign-born parent 13 42.1% Native17 57.9% Foreign-bornChildren 6 to 17 years - Living with two parents Both parents native 3,367 98.6% Native48 1.4% Foreign-bornBoth parents foreign-born 693 70.2% Native294 29.8% Foreign-bornOne native, one foreign-born parent 491 97.7% Native12 2.3% Foreign-bornChildren 6 to 17 years - Living with one parent Native parent 117 100.0% NativeForeign-born parent 419 54.5% Native349 45.5% Foreign-born
Grandparents responsible for own grandchildren in Wellesley
Grandparents (30 to 59 years) White / Caucasian 17 100.0% Not responsible for grandchildrenBlack or African American 19 100.0% Responsible for grandchildrenAsian 9 100.0% Not responsible for grandchildrenWhite alone, not Hispanic / Latino 19 100.0% Not responsible for grandchildrenGrandparents (60 years and over) White / Caucasian 7 8.9% Responsible for grandchildren68 91.1% Not responsible for grandchildrenAsian 121 100.0% Not responsible for grandchildrenWhite alone, not Hispanic / Latino 7 8.9% Responsible for grandchildren68 91.1% Not responsible for grandchildren