Upper Arlington, OH (Ohio) Houses and Residents
| Upper Arlington: | $605,896 |
| Ohio: | $204,100 |
Mean price in 2022:
Detached houses: $536,549
Here: $536,549 State: $254,366 Townhouses or other attached units: $302,950
Here: $302,950 State: $225,733 In 2-unit structures: $310,532
Here: $310,532 State: $144,384 In 3-to-4-unit structures: $196,502
Here: $196,502 State: $203,002 In 5-or-more-unit structures: $359,300
Here: $359,300 State: $211,593 Mobile homes: $156,020
Here: $156,020 State: $62,719
Total population: 34,609 (Urban population: 33,605, Rural population: 0)
Houses: 15,260 (14,564 occupied: 11,376 owner occupied, 3,096 renter occupied)
| % of renters here: | 21% |
| State: | 33% |
Housing density: 1,563 houses/condos per square mile
Median price asked for vacant for-sale houses and condos in 2022: $876,877.
Median contract rent in 2022: $1,304 (lower quartile is $1,086, upper quartile is $1,628)
Median rent asked for vacant for-rent units in 2022: $1,988
Median gross rent in Upper Arlington, OH in 2022: $1,475
Housing units in Upper Arlington with a mortgage: 7,373 (1,339 second mortgage, 12 home equity loan, 1,252 both second mortgage and home equity loan)
Houses without a mortgage: 243
Median household income for houses/condos with a mortgage: $199,474
Median household income for apartments without a mortgage: $128,771
Median monthly housing costs: $1,932
Compare current foreclosures near Upper Arlington, OH:
| Photo | Address | Area | Beds / Baths | Price | Details |
|---|---|---|---|---|---|

|
#1
Bayberry Cir
Columbus, OH 43207
|
1,564 sq. feet
|
1 baths 3 beds |
$127,500
|
show details |

|
#2
S High St
Columbus, OH 43207
|
1,678 sq. feet
|
2 baths 4 beds |
$27,500
|
show details |

|
#3
E 21st Ave
Columbus, OH 43211
|
1,061 sq. feet
|
1 baths 3 beds |
$179,900
|
show details |

|
#4
Meadow Passage Dr
Canal Winchester, OH 43110
|
2,034 sq. feet
|
3 baths 3 beds |
show details | |

|
#5
Westphal Ave
Columbus, OH 43213
|
1,129 sq. feet
|
1 baths 3 beds |
show details | |

|
#6
Jane Ave
Columbus, OH 43219
|
1,491 sq. feet
|
2 baths 3 beds |
show details | |

|
#7
Sandalwood Blvd
Columbus, OH 43229
|
1,161 sq. feet
|
2 baths 3 beds |
show details | |

|
#8
Colfax Ave
Columbus, OH 43224
|
914 sq. feet
|
1 baths 3 beds |
show details | |

|
#9
Gladys Rd
Columbus, OH 43228
|
832 sq. feet
|
1 baths 3 beds |
show details | |

|
#10
Melrose Ave
Columbus, OH 43211
|
1,488 sq. feet
|
1 baths 4 beds |
show details |
| Photo | Address | Area | Beds / Baths | Price | Details |
|---|---|---|---|---|---|

|
#11
Castlebrook Dr
Powell, OH 43065
|
2,826 sq. feet
|
4 baths 4 beds |
show details | |

|
#12
Saint Margaret Ln
Columbus, OH 43213
|
750 sq. feet
|
1 baths 2 beds |
show details | |

|
#13
E Powell Rd
Columbus, OH 43240
|
1,173 sq. feet
|
2 baths 3 beds |
show details | |

|
#14
Linnet Ave
Columbus, OH 43223
|
1,008 sq. feet
|
1 baths 3 beds |
show details | |

|
#15
Firwood Dr
Columbus, OH 43229
|
1,483 sq. feet
|
2 baths 3 beds |
show details | |

|
#16
Woodbrook Cir N
Columbus, OH 43223
|
960 sq. feet
|
2 baths 2 beds |
show details | |

|
#17
Maurine Dr
Columbus, OH 43228
|
1,148 sq. feet
|
1 baths 3 beds |
show details | |

|
#18
Woodbrook Cir N
Columbus, OH 43223
|
960 sq. feet
|
2 baths 2 beds |
show details | |

|
#19
Delaware Ct
Westerville, OH 43081
|
1,446 sq. feet
|
2 baths 3 beds |
show details | |

|
#20
Arrowood Loop N
Columbus, OH 43229
|
1,880 sq. feet
|
3 baths 4 beds |
show details |
| Photo | Address | Area | Beds / Baths | Price | Details |
|---|---|---|---|---|---|

|
#21
Delaware Dr
Westerville, OH 43081
|
1,210 sq. feet
|
2 baths 3 beds |
show details | |

|
#22
Pierce Ave
Columbus, OH 43213
|
914 sq. feet
|
1 baths 3 beds |
show details | |

|
#23
Lawrence Ave
Columbus, OH 43228
|
1,398 sq. feet
|
2 baths 2 beds |
show details | |

|
#24
Fairway Commons Dr
Hilliard, OH 43026
|
2,654 sq. feet
|
3 baths 3 beds |
show details | |

|
#25
Argyle Dr
Columbus, OH 43219
|
1,077 sq. feet
|
1 baths 3 beds |
show details | |

|
#26
Striebel Ct
Columbus, OH 43227
|
925 sq. feet
|
1 baths 3 beds |
show details | |

|
#27
Bovee Ln
Powell, OH 43065
|
2,243 sq. feet
|
3 baths 4 beds |
show details | |

|
#28
Dehner Dr
Columbus, OH 43227
|
1,294 sq. feet
|
2 baths 3 beds |
show details | |

|
#29
Troutbrook Dr
Dublin, OH 43017
|
2,628 sq. feet
|
3 baths 3 beds |
show details | |

|
#30
Ivorton Rd W
Columbus, OH 43207
|
1,008 sq. feet
|
2 baths 3 beds |
show details |
| Photo | Address | Area | Beds / Baths | Price | Details |
|---|---|---|---|---|---|

|
#31
Corbins Mill Dr
Dublin, OH 43017
|
1,330 sq. feet
|
2 baths 2 beds |
show details | |

|
#32
Legend
Columbus, OH 43230
|
2,100 sq. feet
|
3 baths 3 beds |
show details | |

|
#33
Atlanta Dr
Columbus, OH 43228
|
1,040 sq. feet
|
2 baths 3 beds |
show details | |

|
#34
Briarwood Dr
Columbus, OH 43213
|
1,164 sq. feet
|
3 baths 3 beds |
show details | |

|
#35
Salado Creek Dr
Columbus, OH 43219
|
2,334 sq. feet
|
3 baths 3 beds |
show details | |

|
#36
Strawpocket Ln
Westerville, OH 43081
|
1,048 sq. feet
|
2 baths 2 beds |
show details | |

|
#37
E Deshler Ave
Columbus, OH 43227
|
918 sq. feet
|
1 baths 3 beds |
show details | |

|
#38
Shell Ct W
Columbus, OH 43213
|
952 sq. feet
|
2 baths 2 beds |
show details | |

|
#39
N Champion Ave
Columbus, OH 43203
|
2,340 sq. feet
|
2 baths 6 beds |
show details | |

|
#40
S Eureka Ave
Columbus, OH 43204
|
1,124 sq. feet
|
1 baths 3 beds |
show details |
| Photo | Address | Area | Beds / Baths | Price | Details |
|---|---|---|---|---|---|

|
#41
Orange Station Loop
Lewis Center, OH 43035
|
3,116 sq. feet
|
3 baths 4 beds |
show details | |

|
#42
Ironwood Dr
Columbus, OH 43229
|
1,380 sq. feet
|
2 baths 3 beds |
show details | |

|
#43
Sanderling Ave
Powell, OH 43065
|
2,470 sq. feet
|
3 baths 4 beds |
show details | |

|
#44
Whispering Woods
Powell, OH 43065
|
3,990 sq. feet
|
6 baths 5 beds |
show details | |

|
#45
Ascot Dr
Columbus, OH 43229
|
1,528 sq. feet
|
3 baths 3 beds |
show details | |

|
#46
Scriven Ave
Columbus, OH 43228
|
832 sq. feet
|
2 baths 2 beds |
show details | |

|
#47
Westphal Ave
Columbus, OH 43213
|
1,138 sq. feet
|
1 baths 3 beds |
show details | |

|
#48
Pin Oak Dr
Columbus, OH 43229
|
1,632 sq. feet
|
2 baths 4 beds |
show details | |

|
#49
Villa Oaks Ln
Columbus, OH 43230
|
1,064 sq. feet
|
2 baths 2 beds |
show details | |

|
Check over 1 million property listings on Foreclosure.com!
|
browse all offers | |||


Median year apartment built: 1968
Household type by relationship:
Households: 36,601- Male householders: 7,422 (1,639 living alone), Female householders: 6,885 (2,067 living alone)
8,687 spouses (8,658 opposite-sex spouses), 535 unmarried partners, (515 opposite-sex unmarried partners), 11,770 children (11,372 natural, 216 adopted, 181 stepchildren), 93 grandchildren, 147 brothers or sisters, 313 parents, 0 foster children, 137 other relatives, 408 non-relatives
- In group quarters: 200
Size of family households: 4,237 2-persons, 1,908 3-persons, 2,477 4-persons, 783 5-persons, 225 6-persons, 87 7-or-more-persons.
Size of nonfamily households: 3,869 1-person, 630 2-persons, 47 3-persons.
8,841 married couples with children.
1,164 single-parent households (295 men, 869 women).
89.8% of residents of Upper Arlington speak English at home.
2.1% of residents speak Spanish at home (90% speak English very well, 10% speak English well).
2.5% of residents speak other Indo-European language at home (88% speak English very well, 9% speak English well, 3% speak English not well).
3.8% of residents speak Asian or Pacific Island language at home (49% speak English very well, 27% speak English well, 20% speak English not well, 5% don't speak English at all).
0.9% of residents speak other language at home (74% speak English very well, 13% speak English well, 7% speak English not well, 5% don't speak English at all).
Foreign born population: 3,031 (8.3%)
(51.0% of them are naturalized citizens)
| Here: | 7.5 |
| State: | 6.7 |
| Here: | 4.6 |
| State: | 4.4 |

- Bedrooms in owner-occupied houses and condos in Upper Arlington, Ohio
- 0no bedroom
- 501 bedroom
- 1,2342 bedrooms
- 5,0823 bedrooms
- 3,7364 bedrooms
- 1,2745+ bedrooms

- Bedrooms in renter-occupied apartments in Upper Arlington, Ohio
- 11no bedroom
- 5191 bedroom
- 1,8112 bedrooms
- 6643 bedrooms
- 784 bedrooms
- 135+ bedrooms

- Cars and other vehicles available in Upper Arlington in owner-occupied houses/condos
- 215no vehicle
- 2,6031 vehicle
- 6,0742 vehicles
- 1,8223 vehicles
- 5824 vehicles
- 805+ vehicles

- Cars and other vehicles available in Upper Arlington in renter-occupied apartments
- 119no vehicle
- 1,6711 vehicle
- 1,0072 vehicles
- 2303 vehicles
- 704 vehicles
- 05+ vehicles

- Rooms in owner-occupied houses in Upper Arlington, Ohio
- 01 room
- 02 rooms
- 413 rooms
- 3504 rooms
- 1,1835 rooms
- 2,0076 rooms
- 2,0197 rooms
- 2,0388 rooms
- 3,7399+ rooms

- Rooms in renter-occupied apartments in Upper Arlington, Ohio
- 111 room
- 2492 rooms
- 2753 rooms
- 8734 rooms
- 7805 rooms
- 5716 rooms
- 927 rooms
- 1018 rooms
- 1449+ rooms


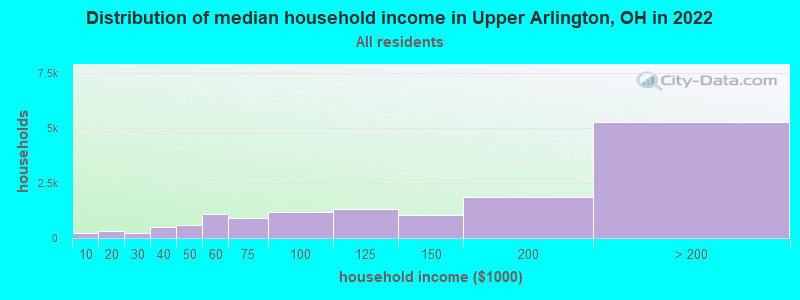
Upper Arlington, OH household income distribution

- 219Less than $10,000
- 300$10,000 to $19,999
- 242$20,000 to $29,999
- 498$30,000 to $39,999
- 592$40,000 to $49,999
- 1,075$50,000 to $59,999
- 894$60,000 to $74,999
- 1,171$75,000 to $99,999
- 1,336$100,000 to $124,999
- 1,051$125,000 to $149,999
- 1,872$150,000 to $199,999
- 5,280$200,000 or more
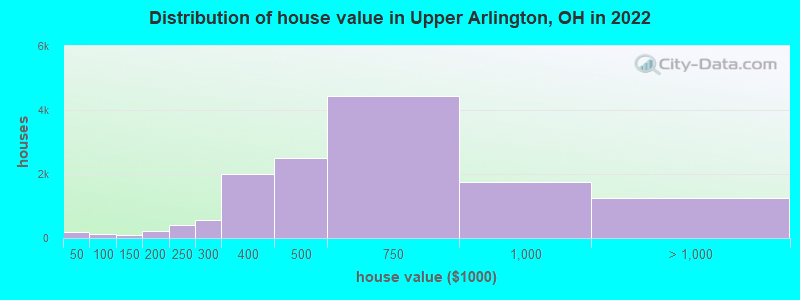
Home value of owner - occupied houses in 2022 in Upper Arlington, OH
-
- 36Less than $10,000
- 37$10,000 to $14,999
- 16$25,000 to $29,999
- 111$40,000 to $49,999
- 3$50,000 to $59,999
- 5$60,000 to $69,999
- 4$70,000 to $79,999
- 4$90,000 to $99,999
- 47$100,000 to $124,999
- 39$125,000 to $149,999
- 78$150,000 to $174,999
- 131$175,000 to $199,999
- 402$200,000 to $249,999
- 562$250,000 to $299,999
- 1,986$300,000 to $399,999
- 2,501$400,000 to $499,999
- 4,445$500,000 to $749,999
- 1,748$750,000 to $999,999
- 916$1,000,000 to $1,499,999
- 190$1,500,000 to $1,999,999
- 157$2,000,000 or more
Rent paid by renters in 2022 in Upper Arlington, OH
-
- 16$200 to $249
- 4$350 to $399
- 61$400 to $449
- 22$550 to $599
- 32$600 to $649
- 30$700 to $749
- 23$750 to $799
- 47$800 to $899
- 315$900 to $999
- 950$1,000 to $1,249
- 802$1,250 to $1,499
- 714$1,500 to $1,999
- 132$2,000 to $2,499
- 32$2,500 to $2,999
- 15$3,000 to $3,499
- 37$3,500 or more
- 138No cash rent


Percentage of workers working in this county: 93.8%
Number of people working at home: 5,280 (28.8% of all workers)

Travel time to work (commute)
- Less than 5 minutes: 336
- 5 to 9 minutes: 1,490
- 10 to 14 minutes: 2,627
- 15 to 19 minutes: 2,866
- 20 to 24 minutes: 3,053
- 25 to 29 minutes: 1,184
- 30 to 34 minutes: 1,307
- 35 to 39 minutes: 154
- 40 to 44 minutes: 154
- 45 to 59 minutes: 245
- 60 to 89 minutes: 259
- 90 or more minutes: 61
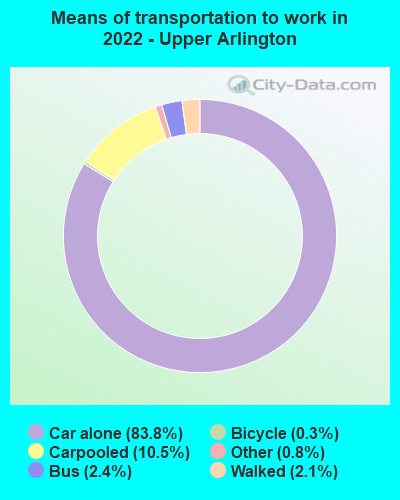
Means of transportation to work:
- Drove a car alone: 8,759 (58.0%)
- Carpooled: 1,294 (8.6%)
- Bus: 281 (1.9%)
- Taxi: 109 (0.7%)
- Bicycle: 37 (0.2%)
- Walked: 185 (1.2%)
- Worked at home: 5,280 (35.0%)

- Unemployment by race in 2022
- Unemployment rate for White non-Hispanic residents
- 1.4%Males
- 1.8%Females
- Unemployment rate for Black residents
- 6.1%Males
- Unemployment rate for two or more race residents
- 1.7%Females

- Year of entry for the foreign-born population in Upper Arlington, Ohio
- 1,1092010 or later
- 5352000 to 2009
- 6771990 to 1999
- 3731980 to 1989
- 3601970 to 1979
- 632Before 1970
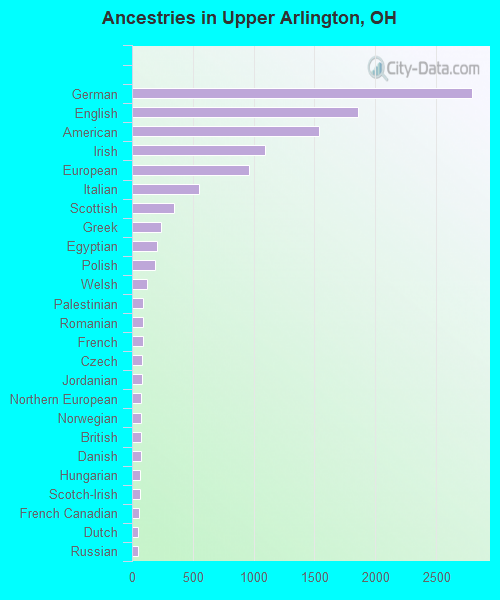
First ancestries reported:
- German: 2,796 (18.4%)
- English: 1,858 (12.2%)
- American: 1,536 (10.1%)
- Irish: 1,095 (7.2%)
- European: 964 (6.3%)
- Italian: 550 (3.6%)
- Scottish: 345 (2.3%)
- Greek: 237 (1.6%)
- Egyptian: 203 (1.3%)
- Polish: 186 (1.2%)
- Welsh: 121 (0.8%)
- Palestinian: 92 (0.6%)
- Romanian: 89 (0.6%)
- French: 88 (0.6%)
- Czech: 83 (0.5%)
- Jordanian: 80 (0.5%)
- Northern European: 78 (0.5%)
- Norwegian: 74 (0.5%)
- British: 74 (0.5%)
- Danish: 70 (0.5%)
- Hungarian: 67 (0.4%)
- Scotch-Irish: 65 (0.4%)
- French Canadian: 55 (0.4%)
- Dutch: 52 (0.3%)
- Russian: 47 (0.3%)
- Slovak: 43 (0.3%)
- African: 41 (0.3%)
- New Zealander: 40 (0.3%)
- Eastern European: 34 (0.2%)
- Portuguese: 31 (0.2%)
- Yugoslavian: 25 (0.2%)
- Iranian: 25 (0.2%)
- Swiss: 21 (0.1%)
- Lebanese: 20 (0.1%)
- Slovene: 17 (0.1%)
- Lithuanian: 16 (0.1%)
- Turkish: 16 (0.1%)
- Nigerian: 15 (0.10%)
- Albanian: 14 (0.09%)
- Ukrainian: 13 (0.09%)
- Croatian: 10 (0.07%)
- Finnish: 9 (0.06%)
- Armenian: 9 (0.06%)
- Czechoslovakian: 8 (0.05%)
- Latvian: 7 (0.05%)
- Swedish: 5 (0.03%)
- Arab: 4 (0.03%)
- Belgian: 4 (0.03%)
- Scandinavian: 3 (0.02%)
Most common places of birth for foreign-born residents (%):
| Upper Arlington: | 20.8% (617) |
| Ohio: | 6.2% (35,703) |
| Upper Arlington: | 10.6% (314) |
| Ohio: | 11.6% (66,525) |
| Upper Arlington: | 7.6% (224) |
| Ohio: | 7.8% (44,796) |
| Upper Arlington: | 6.1% (181) |
| Ohio: | 2.0% (11,398) |
| Upper Arlington: | 5.6% (167) |
| Ohio: | 0.5% (2,631) |
| Upper Arlington: | 4.1% (120) |
| Ohio: | 0.8% (4,651) |
| Upper Arlington: | 3.6% (107) |
| Ohio: | 2.6% (14,988) |
| Upper Arlington: | 3.4% (100) |
| Ohio: | 1.9% (10,777) |
| Upper Arlington: | 2.4% (70) |
| Ohio: | 1.0% (5,444) |
| Upper Arlington: | 2.3% (67) |
| Ohio: | 0.3% (1,486) |
| Upper Arlington: | 2.1% (63) |
| Ohio: | 0.5% (2,690) |
| Upper Arlington: | 1.9% (56) |
| Ohio: | 0.7% (3,722) |
| Upper Arlington: | 1.7% (51) |
| Ohio: | 0.2% (1,056) |
| Upper Arlington: | 1.7% (51) |
| Ohio: | 1.2% (7,029) |
| Upper Arlington: | 1.7% (50) |
| Ohio: | 1.5% (8,452) |
| Upper Arlington: | 1.7% (49) |
| Ohio: | 1.9% (10,960) |
| Upper Arlington: | 1.6% (46) |
| Ohio: | 1.0% (5,979) |
| Upper Arlington: | 1.6% (46) |
| Ohio: | 1.1% (6,346) |
Place of birth for U.S.-born residents:
- This state: 24,010
- Other state: 9,243
- Northeast: 3,193
- Midwest: 2,950
- South: 2,260
- West: 952
88.0% of Upper Arlington residents lived in the same house 1 years ago.
Out of people who lived in different houses, 37.9% lived in this county.
Out of people who lived in different counties, 59.9% lived in Ohio.
| Upper Arlington: | 88.0% |
| State average: | 87.8% |
Education attainment for males 25 years and older:
- No schooling: 53
- Nursery to 4th grade: 6
- 5th and 6th grade: 16
- 7th and 8th grade: 0
- 9th grade: 43
- 10th grade: 0
- 11th grade: 33
- 12th grade, no diploma: 47
- High school graduate (or equivalency): 683
- Less than 1 year of college: 344
- Some college more than 1 year, no degree: 1,191
- Associate degree: 285
- Bachelor's degree: 4,856
- Master's degree: 2,253
- Professional school degree: 1,354
- Doctorate degree: 943

Education attainment for females 25 years and older:
- No schooling: 58
- Nursery to 4th grade: 10
- 5th and 6th grade: 36
- 7th and 8th grade: 0
- 9th grade: 0
- 10th grade: 22
- 11th grade: 14
- 12th grade, no diploma: 92
- High school graduate (or equivalency): 791
- Less than 1 year of college: 301
- Some college more than 1 year, no degree: 772
- Associate degree: 423
- Bachelor's degree: 5,866
- Master's degree: 3,179
- Professional school degree: 1,107
- Doctorate degree: 529


Housing units in structures:
- One, detached: 11,296
- One, attached: 1,277
- Two: 187
- 3 or 4: 1,106
- 5 to 9: 503
- 10 to 19: 114
- 20 to 49: 84
- 50 or more: 682
- Boats, RVs, vans, etc.: 8
Housing units lacking complete kitchen facilities in 2022: 0.6%
House/condo owner moved in on average 13 years ago
Renter moved in on average 5 years ago

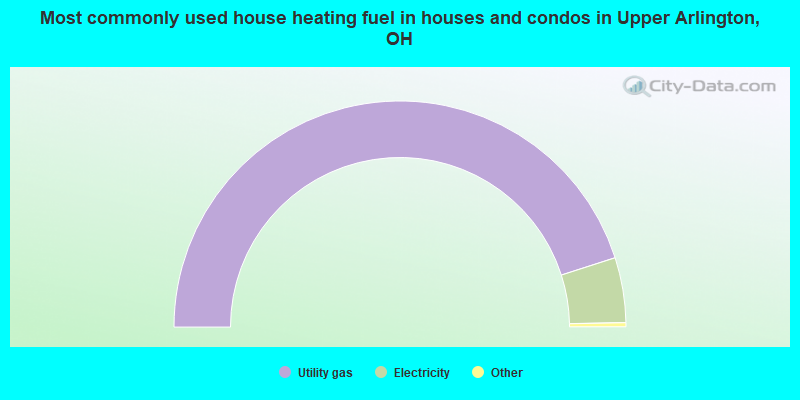
- 90.2%Utility gas
- 9.3%Electricity
- 0.3%Fuel oil, kerosene, etc.
- 0.1%Bottled, tank, or LP gas
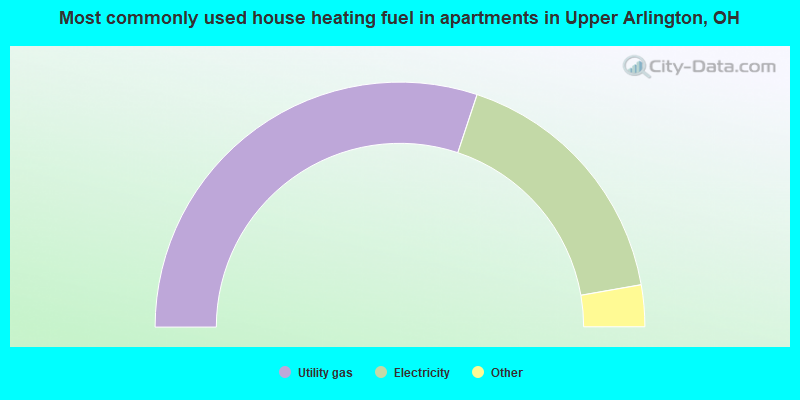
- 60.2%Utility gas
- 34.3%Electricity
- 3.1%No fuel used
- 2.4%Bottled, tank, or LP gas
Private vs. public school enrollment:
| Here: | 7.9% |
| Ohio: | 16.0% |
| Here: | 8.9% |
| Ohio: | 13.1% |
| Here: | 19.8% |
| Ohio: | 22.3% |


