Races in Upper Arlington, Ohio (OH) Detailed Stats
Data:
Races - White alone (%)
Races - White alone (% change since 2000)
Races - Black alone (%)
Races - Black alone (% change since 2000)
Races - American Indian alone (%)
Races - American Indian alone (% change since 2000)
Races - Asian alone (%)
Races - Asian alone (% change since 2000)
Races - Hispanic (%)
Races - Hispanic (% change since 2000)
Races - Native Hawaiian and Other Pacific Islander alone (%)
Races - Native Hawaiian and Other Pacific Islander alone (% change since 2000)
Races - Two or more races(%)
Races - Two or more races(% change since 2000)
Races - Other race alone (%)
Races - Other race alone (% change since 2000)
Racial diversity
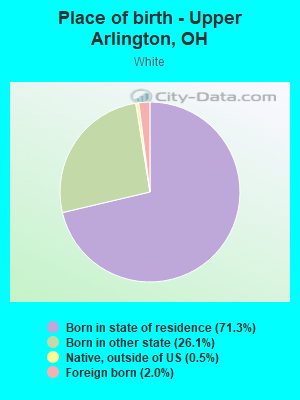
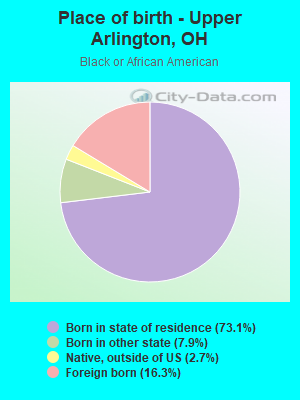
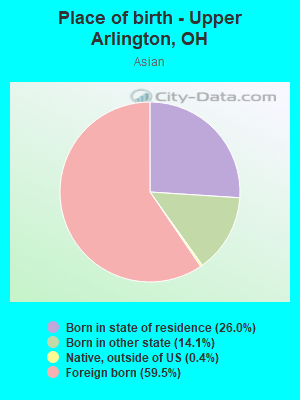
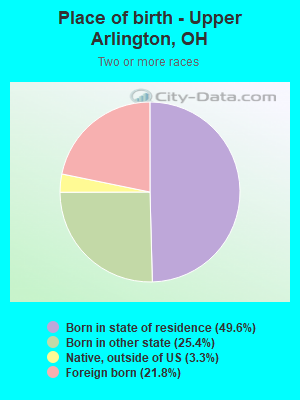
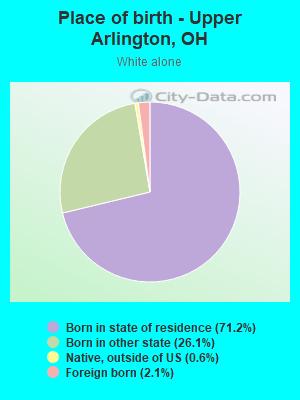
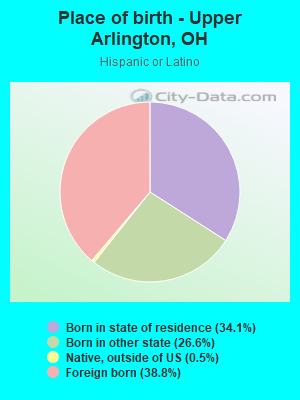
Place of birth - Born in state of residence (%)
Place of birth - Born in state of residence (%) - White
Place of birth - Born in state of residence (%) - Black or African American
Place of birth - Born in state of residence (%) - Asian
Place of birth - Born in state of residence (%) - Hispanic or Latino
Place of birth - Born in state of residence (%) - American Indian and Alaska Native
Place of birth - Born in state of residence (%) - Multirace
Place of birth - Born in state of residence (%) - Other Race
Place of birth - Born in other state (%)
Place of birth - Born in other state (%) - White
Place of birth - Born in other state (%) - Black or African American
Place of birth - Born in other state (%) - Asian
Place of birth - Born in other state (%) - Hispanic or Latino
Place of birth - Born in other state (%) - American Indian and Alaska Native
Place of birth - Born in other state (%) - Multirace
Place of birth - Born in other state (%) - Other Race
Place of birth - Native, outside of US (%)
Place of birth - Native, outside of US (%) - White
Place of birth - Native, outside of US (%) - Black or African American
Place of birth - Native, outside of US (%) - Asian
Place of birth - Native, outside of US (%) - Hispanic or Latino
Place of birth - Native, outside of US (%) - American Indian and Alaska Native
Place of birth - Native, outside of US (%) - Multirace
Place of birth - Native, outside of US (%) - Other Race
Place of birth - Foreign born (%)
Place of birth - Foreign born (%) - White
Place of birth - Foreign born (%) - Black or African American
Place of birth - Foreign born (%) - Asian
Place of birth - Foreign born (%) - Hispanic or Latino
Place of birth - Foreign born (%) - American Indian and Alaska Native
Place of birth - Foreign born (%) - Multirace
Place of birth - Foreign born (%) - Other Race
Residents speaking English at home (%)
Residents speaking English at home - Born in the United States (%)
Residents speaking English at home - Native, born elsewhere (%)
Residents speaking English at home - Foreign born (%)
Residents speaking Spanish at home (%)
Residents speaking Spanish at home - Born in the United States (%)
Residents speaking Spanish at home - Native, born elsewhere (%)
Residents speaking Spanish at home - Foreign born (%)
Residents speaking other language at home (%)
Residents speaking other language at home - Born in the United States (%)
Residents speaking other language at home - Native, born elsewhere (%)
Residents speaking other language at home - Foreign born (%)
Marital status - Never married (%)
Marital status - Now married (%)
Marital status - Separated (%)
Marital status - Widowed (%)
Marital status - Divorced (%)
Ancestries Reported - Arab (%)
Ancestries Reported - Czech (%)
Ancestries Reported - Danish (%)
Ancestries Reported - Dutch (%)
Ancestries Reported - English (%)
Ancestries Reported - French (%)
Ancestries Reported - French Canadian (%)
Ancestries Reported - German (%)
Ancestries Reported - Greek (%)
Ancestries Reported - Hungarian (%)
Ancestries Reported - Irish (%)
Ancestries Reported - Italian (%)
Ancestries Reported - Lithuanian (%)
Ancestries Reported - Norwegian (%)
Ancestries Reported - Polish (%)
Ancestries Reported - Portuguese (%)
Ancestries Reported - Russian (%)
Ancestries Reported - Scotch-Irish (%)
Ancestries Reported - Scottish (%)
Ancestries Reported - Slovak (%)
Ancestries Reported - Subsaharan African (%)
Ancestries Reported - Swedish (%)
Ancestries Reported - Swiss (%)
Ancestries Reported - Ukrainian (%)
Ancestries Reported - United States (%)
Ancestries Reported - Welsh (%)
Ancestries Reported - West Indian (%)
Ancestries Reported - Other (%)
Geographical mobility - Same house 1 year ago (%)
Geographical mobility - Same house 1 year ago (%) - White
Geographical mobility - Same house 1 year ago (%) - Black or African American
Geographical mobility - Same house 1 year ago (%) - Asian
Geographical mobility - Same house 1 year ago (%) - Hispanic or Latino
Geographical mobility - Same house 1 year ago (%) - American Indian and Alaska Native
Geographical mobility - Same house 1 year ago (%) - Multirace
Geographical mobility - Same house 1 year ago (%) - Other Race
Geographical mobility - Moved within same county (%)
Geographical mobility - Moved within same county (%) - White
Geographical mobility - Moved within same county (%) - Black or African American
Geographical mobility - Moved within same county (%) - Asian
Geographical mobility - Moved within same county (%) - Hispanic or Latino
Geographical mobility - Moved within same county (%) - American Indian and Alaska Native
Geographical mobility - Moved within same county (%) - Multirace
Geographical mobility - Moved within same county (%) - Other Race
Geographical mobility - Moved from different county within same state (%)
Geographical mobility - Moved from different county within same state (%) - White
Geographical mobility - Moved from different county within same state (%) - Black or African American
Geographical mobility - Moved from different county within same state (%) - Asian
Geographical mobility - Moved from different county within same state (%) - Hispanic or Latino
Geographical mobility - Moved from different county within same state (%) - American Indian and Alaska Native
Geographical mobility - Moved from different county within same state (%) - Multirace
Geographical mobility - Moved from different county within same state (%) - Other Race
Geographical mobility - Moved from different state (%)
Geographical mobility - Moved from different state (%) - White
Geographical mobility - Moved from different state (%) - Black or African American
Geographical mobility - Moved from different state (%) - Asian
Geographical mobility - Moved from different state (%) - Hispanic or Latino
Geographical mobility - Moved from different state (%) - American Indian and Alaska Native
Geographical mobility - Moved from different state (%) - Multirace
Geographical mobility - Moved from different state (%) - Other Race
Geographical mobility - Moved from abroad (%)
Geographical mobility - Moved from abroad (%) - White
Geographical mobility - Moved from abroad (%) - Black or African American
Geographical mobility - Moved from abroad (%) - Asian
Geographical mobility - Moved from abroad (%) - Hispanic or Latino
Geographical mobility - Moved from abroad (%) - American Indian and Alaska Native
Geographical mobility - Moved from abroad (%) - Multirace
Geographical mobility - Moved from abroad (%) - Other Race
Place of birth for the foreign-born population - Ireland (%)
Place of birth for the foreign-born population - Denmark (%)
Place of birth for the foreign-born population - Norway (%)
Place of birth for the foreign-born population - Sweden (%)
Place of birth for the foreign-born population - United Kingdom (%)
Place of birth for the foreign-born population - England (%)
Place of birth for the foreign-born population - Scotland (%)
Place of birth for the foreign-born population - Other Northern Europe (%)
Place of birth for the foreign-born population - Austria (%)
Place of birth for the foreign-born population - Belgium (%)
Place of birth for the foreign-born population - France (%)
Place of birth for the foreign-born population - Germany (%)
Place of birth for the foreign-born population - Netherlands (%)
Place of birth for the foreign-born population - Switzerland (%)
Place of birth for the foreign-born population - Other Western Europe (%)
Place of birth for the foreign-born population - Greece (%)
Place of birth for the foreign-born population - Italy (%)
Place of birth for the foreign-born population - Portugal (%)
Place of birth for the foreign-born population - Spain (%)
Place of birth for the foreign-born population - Other Southern Europe (%)
Place of birth for the foreign-born population - Albania (%)
Place of birth for the foreign-born population - Belarus (%)
Place of birth for the foreign-born population - Bosnia and Herzegovina (%)
Place of birth for the foreign-born population - Bulgaria (%)
Place of birth for the foreign-born population - Croatia (%)
Place of birth for the foreign-born population - Czechoslovakia (%)
Place of birth for the foreign-born population - Hungary (%)
Place of birth for the foreign-born population - Latvia (%)
Place of birth for the foreign-born population - Lithuania (%)
Place of birth for the foreign-born population - North Macedonia (Macedonia) (%)
Place of birth for the foreign-born population - Moldova (%)
Place of birth for the foreign-born population - Poland (%)
Place of birth for the foreign-born population - Romania (%)
Place of birth for the foreign-born population - Russia (%)
Place of birth for the foreign-born population - Serbia (%)
Place of birth for the foreign-born population - Ukraine (%)
Place of birth for the foreign-born population - Other Eastern Europe (%)
Place of birth for the foreign-born population - China (%)
Place of birth for the foreign-born population - Hong Kong (%)
Place of birth for the foreign-born population - Taiwan (%)
Place of birth for the foreign-born population - Japan (%)
Place of birth for the foreign-born population - Korea (%)
Place of birth for the foreign-born population - Other Eastern Asia (%)
Place of birth for the foreign-born population - Afghanistan (%)
Place of birth for the foreign-born population - Bangladesh (%)
Place of birth for the foreign-born population - India (%)
Place of birth for the foreign-born population - Iran (%)
Place of birth for the foreign-born population - Kazakhstan (%)
Place of birth for the foreign-born population - Nepal (%)
Place of birth for the foreign-born population - Pakistan (%)
Place of birth for the foreign-born population - Sri Lanka (%)
Place of birth for the foreign-born population - Uzbekistan (%)
Place of birth for the foreign-born population - Other South Central Asia (%)
Place of birth for the foreign-born population - Burma (%)
Place of birth for the foreign-born population - Cambodia (%)
Place of birth for the foreign-born population - Indonesia (%)
Place of birth for the foreign-born population - Laos (%)
Place of birth for the foreign-born population - Malaysia (%)
Place of birth for the foreign-born population - Philippines (%)
Place of birth for the foreign-born population - Singapore (%)
Place of birth for the foreign-born population - Thailand (%)
Place of birth for the foreign-born population - Vietnam (%)
Place of birth for the foreign-born population - Other South Eastern Asia (%)
Place of birth for the foreign-born population - Armenia (%)
Place of birth for the foreign-born population - Iraq (%)
Place of birth for the foreign-born population - Israel (%)
Place of birth for the foreign-born population - Jordan (%)
Place of birth for the foreign-born population - Kuwait (%)
Place of birth for the foreign-born population - Lebanon (%)
Place of birth for the foreign-born population - Saudi Arabia (%)
Place of birth for the foreign-born population - Syria (%)
Place of birth for the foreign-born population - Turkey (%)
Place of birth for the foreign-born population - Yemen (%)
Place of birth for the foreign-born population - Other Western Asia (%)
Place of birth for the foreign-born population - Eritrea (%)
Place of birth for the foreign-born population - Ethiopia (%)
Place of birth for the foreign-born population - Kenya (%)
Place of birth for the foreign-born population - Somalia (%)
Place of birth for the foreign-born population - Uganda (%)
Place of birth for the foreign-born population - Zimbabwe (%)
Place of birth for the foreign-born population - Other Eastern Africa (%)
Place of birth for the foreign-born population - Cameroon (%)
Place of birth for the foreign-born population - Congo (%)
Place of birth for the foreign-born population - Democratic Republic of Congo (Zaire) (%)
Place of birth for the foreign-born population - Other Middle Africa (%)
Place of birth for the foreign-born population - Egypt (%)
Place of birth for the foreign-born population - Morocco (%)
Place of birth for the foreign-born population - Sudan (%)
Place of birth for the foreign-born population - Other Northern Africa (%)
Place of birth for the foreign-born population - South Africa (%)
Place of birth for the foreign-born population - Other Southern Africa (%)
Place of birth for the foreign-born population - Cabo Verde (%)
Place of birth for the foreign-born population - Ghana (%)
Place of birth for the foreign-born population - Liberia (%)
Place of birth for the foreign-born population - Nigeria (%)
Place of birth for the foreign-born population - Senegal (%)
Place of birth for the foreign-born population - Sierra Leone (%)
Place of birth for the foreign-born population - Other Western Africa (%)
Place of birth for the foreign-born population - Australia (%)
Place of birth for the foreign-born population - New Zealand (%)
Place of birth for the foreign-born population - Fiji (%)
Place of birth for the foreign-born population - Micronesia (%)
Place of birth for the foreign-born population - Bahamas (%)
Place of birth for the foreign-born population - Barbados (%)
Place of birth for the foreign-born population - Cuba (%)
Place of birth for the foreign-born population - Dominica (%)
Place of birth for the foreign-born population - Dominican Republic (%)
Place of birth for the foreign-born population - Grenada (%)
Place of birth for the foreign-born population - Haiti (%)
Place of birth for the foreign-born population - Jamaica (%)
Place of birth for the foreign-born population - St. Vincent and the Grenadines (%)
Place of birth for the foreign-born population - Trinidad and Tobago (%)
Place of birth for the foreign-born population - West Indies (%)
Place of birth for the foreign-born population - Other Caribbean (%)
Place of birth for the foreign-born population - Belize (%)
Place of birth for the foreign-born population - Costa Rica (%)
Place of birth for the foreign-born population - El Salvador (%)
Place of birth for the foreign-born population - Guatemala (%)
Place of birth for the foreign-born population - Honduras (%)
Place of birth for the foreign-born population - Mexico (%)
Place of birth for the foreign-born population - Nicaragua (%)
Place of birth for the foreign-born population - Panama (%)
Place of birth for the foreign-born population - Other Central America (%)
Place of birth for the foreign-born population - Argentina (%)
Place of birth for the foreign-born population - Bolivia (%)
Place of birth for the foreign-born population - Brazil (%)
Place of birth for the foreign-born population - Chile (%)
Place of birth for the foreign-born population - Colombia (%)
Place of birth for the foreign-born population - Ecuador (%)
Place of birth for the foreign-born population - Guyana (%)
Place of birth for the foreign-born population - Peru (%)
Place of birth for the foreign-born population - Uruguay (%)
Place of birth for the foreign-born population - Venezuela (%)
Place of birth for the foreign-born population - Other South America (%)
Place of birth for the foreign-born population - Canada (%)
Place of birth for the foreign-born population - Other Northern America (%)
Place of birth for the foreign-born population - Other (%)
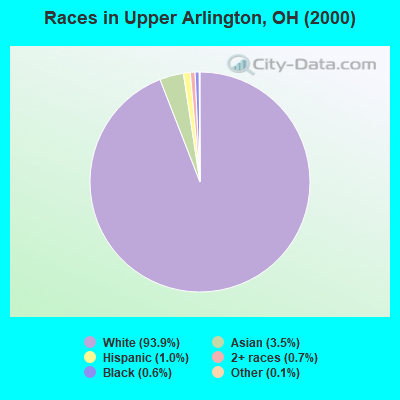
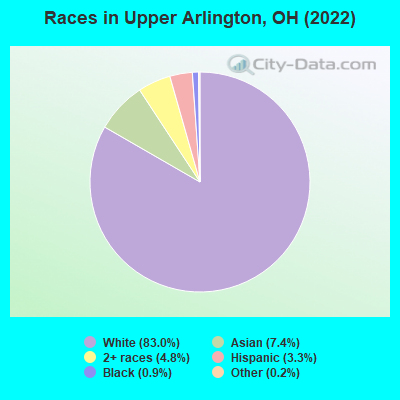
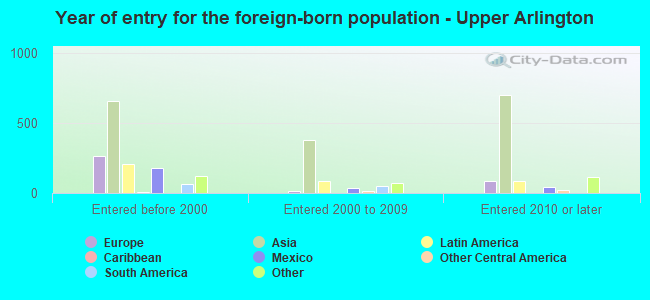
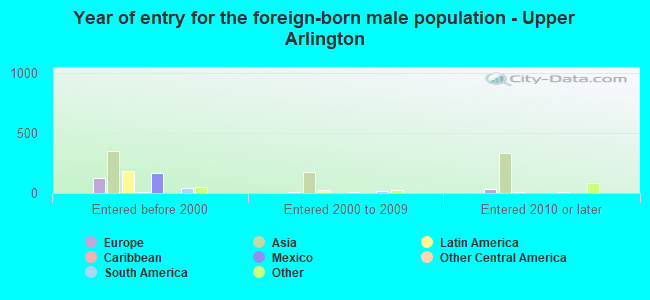
According to 2022 data, the most numerous races in Upper Arlington, OH are White alone (30,376 residents), Black alone (324 residents), and Two or more races (1,774 residents). 89.4% of Upper Arlington residents speak English at home. 8.1% of Upper Arlington, OH residents are foreign-born (4.9% born in Asia, 1.2% born in Europe, 0.9% born in Latin America), which is 50.6% greater than the foreign-born rate of 4.0% across the entire state of Ohio.
Race distribution in Upper Arlington
2000 2022
9,538,111 84.0% White alone 1,290,662 11.4% Black alone 217,123 1.9% Hispanic 137,770 1.2% Two or more races 131,670 1.2% Asian alone 21,985 0.2% American Indian alone 13,483 0.1% Other race alone 2,336 0.02% Native Hawaiian and Other
8,948,793 76.1% White alone 1,401,403 11.9% Black alone 529,291 4.5% Two or more races 517,232 4.4% Hispanic 293,387 2.5% Asian alone 52,805 0.4% Other race alone 9,785 0.08% American Indian alone 3,362 0.03% Native Hawaiian and Other
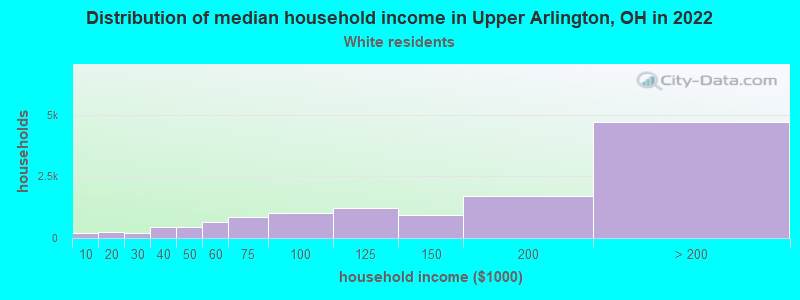
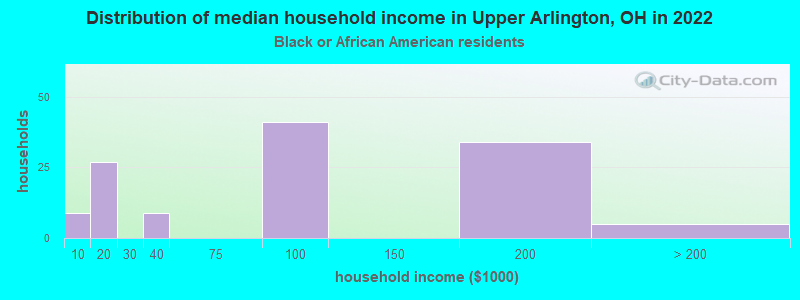
Income and house value in Upper Arlington Median household income in 2022 $147,581 White non-Hispanic householders$85,912 Black householders$118,710 Asian householdersover $200,000 Some other race householders$50,508 Two or more races householdersMedian 2022 house value $617,624 White Non-Hispanic householders$276,915 Black or African American householders$212,835 American Indian or Alaska Native householders $657,960 Asian householders$442,549 Some other race householders$603,321 Two or more races householders$533,520 Hispanic or Latino householders
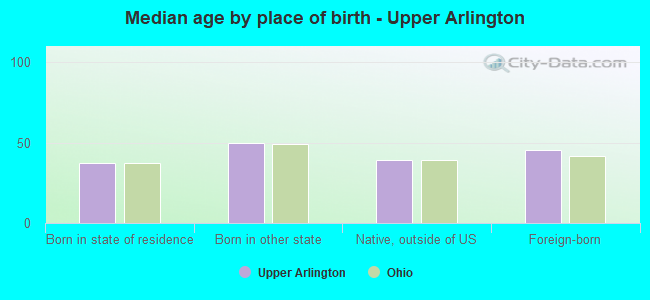
Median age by race in Upper Arlington
42.7 Median age for White residents41.8 44.0 31.4 Median age for Black or African American residents31.3 27.8 -691,029,899.6 Median age for American Indian / Alaska Native residents-670,953,911.4 -732,121,211.4 38.8 Median age for Asian residents38.1 38.7 -497,206,703.4 Median age for Native Hawaiian / Pacific Islander residents-544,891,640.3 -805,394,989.6 41.4 Median age for Other race residents47.3 33.1 20.1 Median age for Two or more races residents21.3 17.2 42.6 Median age for White alone residents41.6 44.0 32.6 Median age for Hispanic or Latino residents15.1 36.5
Owner/renter occupied households by race in Upper Arlington
House owners and renters - White residents 10,033 80.6% Owner occupied2,407 19.4% Renter occupiedHouse owners and renters - Black or African American residents 19 14.4% Owner occupied115 85.6% Renter occupiedHouse owners and renters - Asian residents 568 67.5% Owner occupied273 32.5% Renter occupiedHouse owners and renters - Other race residents 48 66.7% Owner occupied24 33.3% Renter occupiedHouse owners and renters - Two or more races residents 512 57.5% Owner occupied378 42.5% Renter occupiedHouse owners and renters - White alone residents 9,979 80.6% Owner occupied2,401 19.4% Renter occupiedHouse owners and renters - Hispanic or Latino residents 306 78.7% Owner occupied83 21.3% Renter occupied
Language usage in Upper Arlington
English speakers - Total 89.4% of residents of Upper Arlington speak English at home.
2.1% of residents speak Spanish at home 651 91.3% Speak English very well62 8.7% Speak English less than very well7.8% of residents speak other language at home 1,755 66.4% Speak English very well888 33.6% Speak English less than very well
English speakers - Born in the United States 94.7% of residents of Upper Arlington speak English at home.
2.1% of residents speak Spanish at home 141 75.0% Speak English very well47 25.0% Speak English less than very well3.2% of residents speak other language at home 289 100.0% Speak English very well
English speakers - Native, born elsewhere 90.7% of residents of Upper Arlington speak English at home.
2.5% of residents speak Spanish at home 6 100.0% Speak English less than very well8.1% of residents speak other language at home 19 100.0% Speak English very well
English speakers - Foreign-born 17.1% of residents of Upper Arlington speak English at home.
11.9% of residents speak Spanish at home 349 98.3% Speak English very well6 1.7% Speak English less than very well68.3% of residents speak other language at home 1,179 58.1% Speak English very well851 41.9% Speak English less than very well
White (Caucasian) - Speak only English Native:
98.7% (27,467)Foreign-born:
43.5% (262)
White (Caucasian) - Speak another language Native:
1.4% (389)Foreign-born:
57.4% (346)
Black or African American - Speak only English Native:
98.5% (220)Foreign-born:
72.3% (37)
Asian - Speak only English Native:
69.9% (630)Foreign-born:
7.6% (122)
Asian - Speak another language Native:
32.9% (297)Foreign-born:
93.9% (1,513)
Other race - Speak only English Native:
37.9% (33)Foreign-born:
25.2% (20)
Other race - Speak another language Native:
62.2% (54)Foreign-born:
34.8% (27)
Two or more races - Speak only English Native:
94.4% (1,785)Foreign-born:
3.6% (21)
Two or more races - Speak another language Native:
6.1% (116)Foreign-born:
96.2% (546)
White alone - Speak only English Native:
98.5% (27,352)Foreign-born:
43.1% (269)
White alone - Speak another language Native:
1.5% (420)Foreign-born:
53.3% (333)
Hispanic or Latino - Speak only English Native:
69.0% (438)Foreign-born:
15.3% (72)
Hispanic or Latino - Speak another language Native:
25.5% (162)Foreign-born:
86.2% (403)
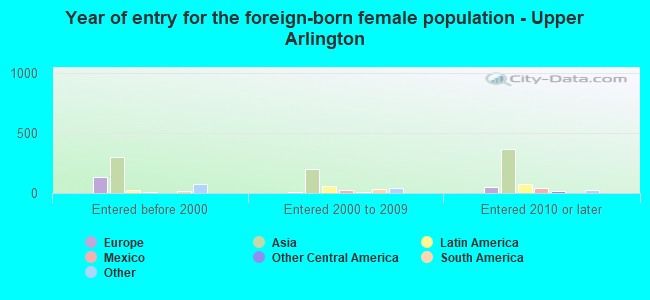
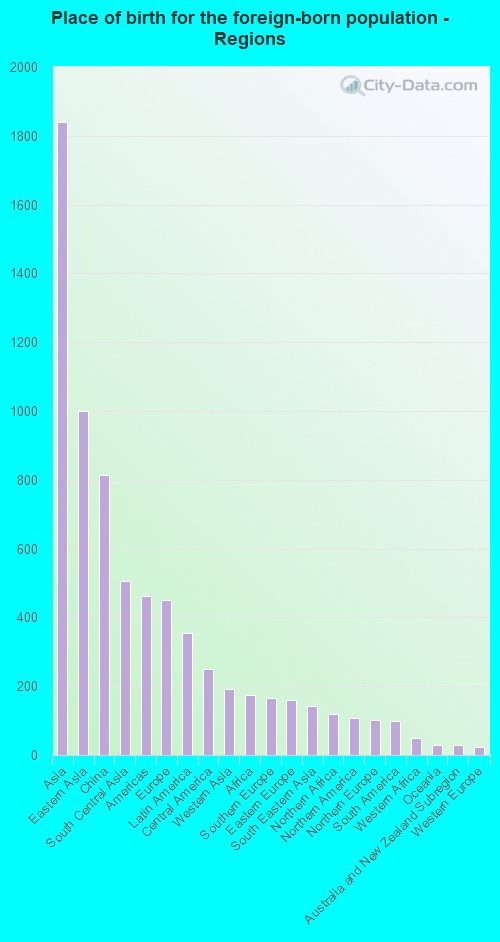
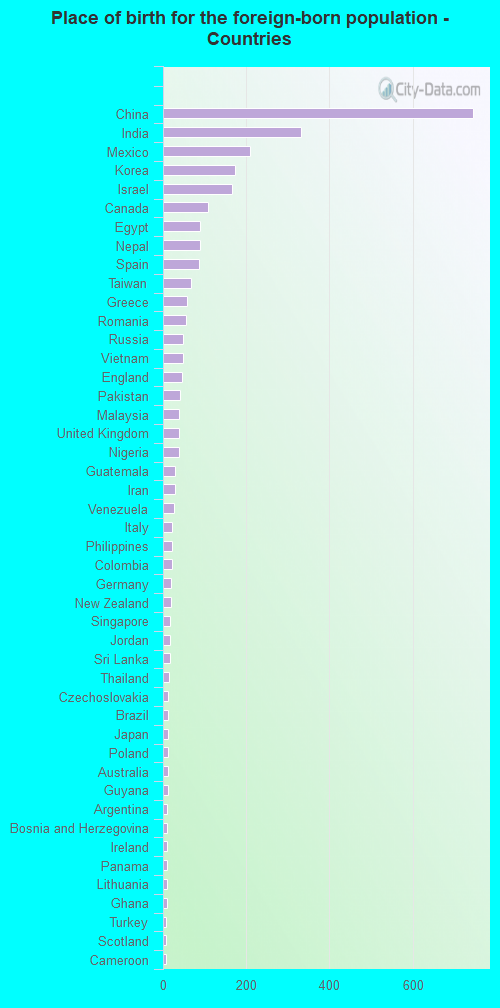
Foreign-born residents in Upper Arlington 2,961 residents are foreign born (4.9% Asia , 1.2% Europe , 0.9% Latin America ).
Marital status for residents in Upper Arlington Marital status - White (Caucasian) population 15 years and over
Males 23.7% Never married65.4% Now married0.3% Separated5.2% Widowed5.4% DivorcedFemales 18.7% Never married62.3% Now married1.0% Separated6.9% Widowed11.1% DivorcedWomen who gave birth in the past 12 months Now married:
95.5% (507)Unmarried:
4.5% (24)
Women who did not give birth in the past 12 months Now married:
61.3% (3,466)Unmarried:
38.7% (2,185)
Marital status - Black or African American population 15 years and over
Males 40.3% Never married55.7% Now married0.0% Separated4.0% Widowed0.0% DivorcedFemales 18.7% Never married20.6% Now married21.5% Separated2.8% Widowed36.4% DivorcedWomen who gave birth in the past 12 months Now married:
100.0% (7)Unmarried:
0.0% (0)
Women who did not give birth in the past 12 months Now married:
53.5% (22)Unmarried:
46.5% (19)
Marital status - Asian population 15 years and over
Males 19.1% Never married80.0% Now married0.0% Separated0.9% Widowed0.0% DivorcedFemales 22.3% Never married62.3% Now married1.6% Separated8.7% Widowed5.1% DivorcedWomen who gave birth in the past 12 months Now married:
100.0% (24)Unmarried:
0.0% (0)
Women who did not give birth in the past 12 months Now married:
65.9% (534)Unmarried:
34.1% (276)
Marital status - Other race population 15 years and over
Males 23.5% Never married76.5% Now married0.0% Separated0.0% Widowed0.0% DivorcedFemales 18.2% Never married81.8% Now married0.0% Separated0.0% Widowed0.0% DivorcedWomen who did not give birth in the past 12 months Now married:
75.9% (53)Unmarried:
24.1% (17)
Marital status - Two or more races population 15 years and over
Males 45.9% Never married51.7% Now married0.0% Separated0.0% Widowed2.4% DivorcedFemales 38.0% Never married48.0% Now married2.5% Separated2.5% Widowed8.9% DivorcedWomen who did not give birth in the past 12 months Now married:
46.5% (190)Unmarried:
53.5% (218)
Marital status - White alone, not Hispanic / Latino population 15 years and over
Males 24.0% Never married65.3% Now married0.3% Separated5.0% Widowed5.4% DivorcedFemales 18.8% Never married62.0% Now married1.0% Separated7.0% Widowed11.2% DivorcedWomen who gave birth in the past 12 months Now married:
95.3% (490)Unmarried:
4.7% (24)
Women who did not give birth in the past 12 months Now married:
60.9% (3,411)Unmarried:
39.1% (2,192)
Marital status - Hispanic or Latino population 15 years and over
Males 12.4% Never married79.7% Now married0.0% Separated7.9% Widowed0.0% DivorcedFemales 15.6% Never married74.3% Now married0.0% Separated4.9% Widowed5.2% DivorcedWomen who gave birth in the past 12 months Now married:
100.0% (27)Unmarried:
0.0% (0)
Women who did not give birth in the past 12 months Now married:
78.6% (195)Unmarried:
21.4% (53)
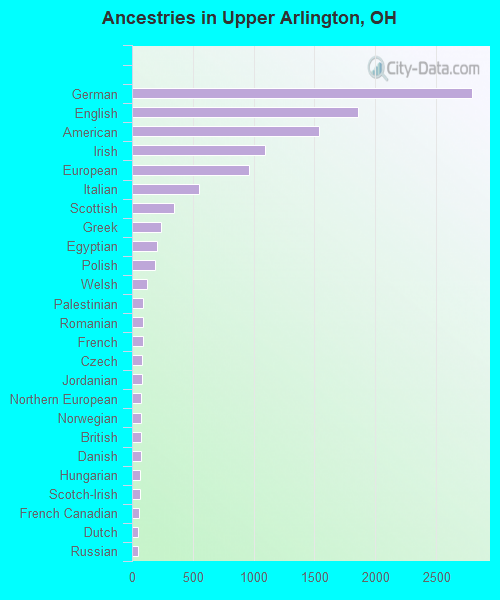
Ancestries in Upper Arlington
2,796 18.4% German1,858 12.2% English1,536 10.1% American1,095 7.2% Irish964 6.3% European550 3.6% Italian345 2.3% Scottish237 1.6% Greek203 1.3% Egyptian186 1.2% Polish121 0.8% Welsh92 0.6% Palestinian89 0.6% Romanian88 0.6% French83 0.5% Czech80 0.5% Jordanian78 0.5% Northern European74 0.5% Norwegian74 0.5% British70 0.5% Danish67 0.4% Hungarian65 0.4% Scotch-Irish55 0.4% French Canadian52 0.3% Dutch47 0.3% Russian43 0.3% Slovak41 0.3% African40 0.3% New Zealander34 0.2% Eastern European31 0.2% Portuguese25 0.2% Yugoslavian25 0.2% Iranian21 0.1% Swiss20 0.1% Lebanese17 0.1% Slovene16 0.1% Lithuanian16 0.1% Turkish15 0.10% Nigerian14 0.09% Albanian13 0.09% Ukrainian10 0.07% Croatian9 0.06% Finnish9 0.06% Armenian8 0.05% Czechoslovakian7 0.05% Latvian5 0.03% Swedish4 0.03% Arab4 0.03% Belgian3 0.02% Scandinavian
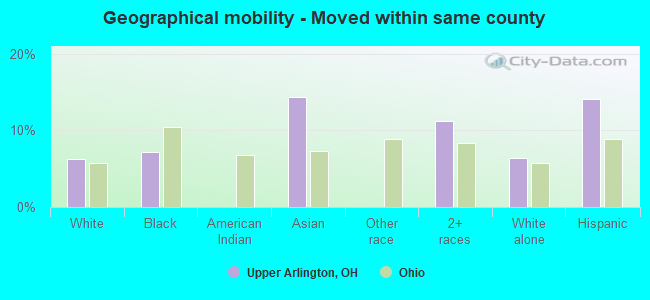
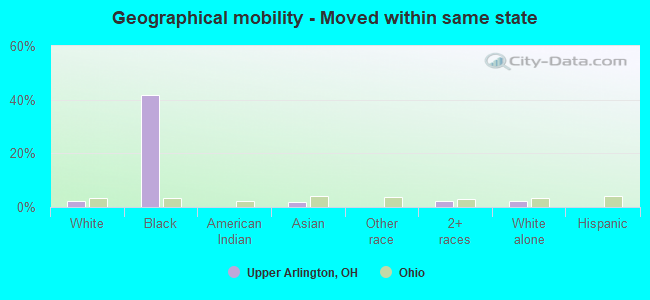
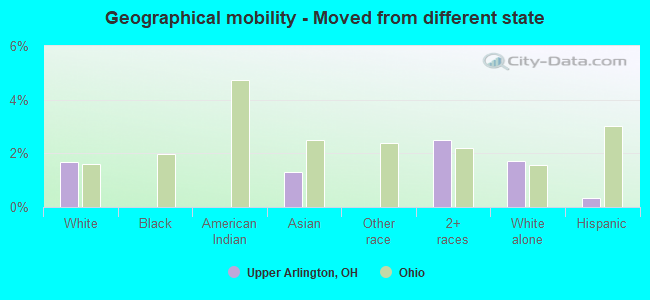
Geographical mobility in Upper Arlington Same house 1 year ago 26,953 90.1% White (Caucasian)140 43.6% Black or African American12 100.0% American Indian / Alaska Native2,151 79.8% Asian158 94.5% Other race2,129 82.5% Two or more races26,935 89.9% White alone, not Hispanic / Latino968 82.3% Hispanic or LatinoMoved within same county 1,864 6.2% White / Caucasian23 7.2% Black or African American386 14.3% Asian290 11.2% Two or more races1,903 6.4% White alone, not Hispanic / Latino165 14.1% Hispanic or LatinoMoved within same state 624 2.1% White / Caucasian134 41.8% Black or African American46 1.7% Asian59 2.3% Two or more races623 2.1% White alone, not Hispanic / LatinoMoved from different state 501 1.7% White / Caucasian35 1.3% Asian64 2.5% Two or more races512 1.7% White alone, not Hispanic / Latino4 0.3% Hispanic or LatinoMoved from abroad 8 0.0% White108 4.0% Asian9 0.0% White alone, not Hispanic / Latino
Children Nativity (place of birth) in Upper Arlington
Children under 6 years - Living with two parents Both parents native 2,455 100.0% NativeBoth parents foreign-born 149 66.1% Native76 33.9% Foreign-bornOne native, one foreign-born parent 208 100.0% NativeChildren under 6 years - Living with one parent Native parent 261 100.0% NativeChildren 6 to 17 years - Living with two parents Both parents native 5,142 99.4% Native29 0.6% Foreign-bornBoth parents foreign-born 362 77.1% Native107 22.9% Foreign-bornOne native, one foreign-born parent 261 98.3% Native4 1.7% Foreign-bornChildren 6 to 17 years - Living with one parent Native parent 784 100.0% NativeForeign-born parent 147 56.1% Native115 43.9% Foreign-born
Grandparents responsible for own grandchildren in Upper Arlington
Grandparents (30 to 59 years) White / Caucasian 51 100.0% Not responsible for grandchildrenAsian 18 100.0% Not responsible for grandchildrenWhite alone, not Hispanic / Latino 53 100.0% Not responsible for grandchildrenGrandparents (60 years and over) White / Caucasian 22 32.9% Responsible for grandchildren45 67.1% Not responsible for grandchildrenAsian 44 64.2% Responsible for grandchildren25 35.8% Not responsible for grandchildrenWhite alone, not Hispanic / Latino 22 32.5% Responsible for grandchildren46 67.5% Not responsible for grandchildren