University Park, FL (Florida) Houses and Residents
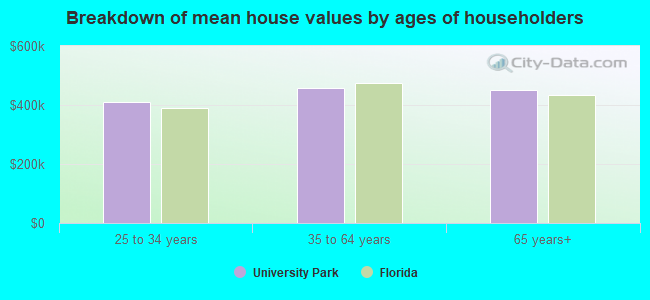
| University Park: | $581,041 |
| Florida: | $354,100 |
Total population: 26,995 (Urban population: 26,476, Rural population: 0)
Houses: 8,472 (7,994 occupied: 5,445 owner occupied, 2,917 renter occupied)
| % of renters here: | 35% |
| State: | 33% |
Housing density: 2,086 houses/condos per square mile
Median price asked for vacant for-sale houses and condos in 2022: $413,648.
Median contract rent in 2022: $1,601 (lower quartile is $1,239, upper quartile is $1,957)
Median rent asked for vacant for-rent units in 2022: $2,108
Median gross rent in University Park, FL in 2022: $1,747
Housing units in University Park with a mortgage: 2,840 (60 second mortgage, 320 home equity loan, 0 both second mortgage and home equity loan)
Houses without a mortgage: 2,131
Median household income for houses/condos with a mortgage: $98,517
Median household income for apartments without a mortgage: $80,470
Median monthly housing costs: $1,581
Compare current foreclosures near University Park, FL:
| Photo | Address | Area | Beds / Baths | Price | Details |
|---|---|---|---|---|---|

|
#1
E 35th St
Hialeah, FL 33013
|
1,690 sq. feet
|
1 baths 2 beds |
$436,000
|
show details |

|
#2
SW 27th St
Hollywood, FL 33029
|
3,611 sq. feet
|
2 baths 4 beds |
$665,600
|
show details |

|
#3
SW 38th Ct
Miami, FL 33134
|
2,823 sq. feet
|
4 baths 6 beds |
$1,100,000
|
show details |

|
#4
SW 88th St
Miami, FL 33156
|
3,536 sq. feet
|
4 baths 5 beds |
$1,805,000
|
show details |

|
#5
NE 1st Ave Unit #2200
Miami, FL 33132
|
- sq. feet
|
2 baths 1 beds |
$715,000
|
show details |

|
#6
SE 5th St Apt 703
Miami, FL 33131
|
952 sq. feet
|
2 baths 1 beds |
show details | |

|
#7
NW 196th St
Miami, FL 33169
|
1,350 sq. feet
|
2 baths 3 beds |
show details | |

|
#8
NW 102nd Ave Apt 208
Miami, FL 33178
|
1,060 sq. feet
|
2 baths 2 beds |
show details | |

|
#9
W 79th Pl
Hialeah, FL 33014
|
1,822 sq. feet
|
3 baths 3 beds |
show details | |

|
#10
SW 58th St
Miami, FL 33193
|
1,986 sq. feet
|
2 baths 4 beds |
show details |
| Photo | Address | Area | Beds / Baths | Price | Details |
|---|---|---|---|---|---|

|
#11
SW 177th Ter
Miami, FL 33187
|
2,492 sq. feet
|
4 baths 5 beds |
show details | |

|
#12
NW 73rd St
Miami, FL 33147
|
1,356 sq. feet
|
2 baths 3 beds |
show details | |

|
#13
Biscayne Boulevard Way Apt 5211
Miami, FL 33131
|
1,237 sq. feet
|
3 baths 2 beds |
show details | |

|
#14
Biscayne Boulevard Way Apt 5301
Miami, FL 33131
|
3,362 sq. feet
|
5 baths 3 beds |
show details | |

|
#15
NW 102nd Ave Apt 101
Miami, FL 33178
|
926 sq. feet
|
2 baths 2 beds |
show details | |

|
#16
NW 78th St
Miami, FL 33147
|
1,118 sq. feet
|
1 baths 3 beds |
show details | |

|
#17
NW 102nd St
Miami, FL 33147
|
1,501 sq. feet
|
2 baths 4 beds |
show details | |

|
#18
NW 144th St
Hialeah, FL 33016
|
1,859 sq. feet
|
2 baths 3 beds |
show details | |

|
#19
NW 88th St
Miami, FL 33147
|
2,120 sq. feet
|
3 baths 7 beds |
show details | |

|
#20
NW 44th Ter
Miami, FL 33178
|
2,650 sq. feet
|
3 baths 4 beds |
show details |
| Photo | Address | Area | Beds / Baths | Price | Details |
|---|---|---|---|---|---|

|
#21
Brickell Ave Apt 501
Miami, FL 33131
|
1,977 sq. feet
|
3 baths 3 beds |
show details | |

|
#22
Brickell Ave Apt 4811
Miami, FL 33131
|
816 sq. feet
|
1 baths 1 beds |
show details | |

|
#23
Brickell Ave Apt 2101
Miami, FL 33131
|
1,825 sq. feet
|
3 baths 3 beds |
show details | |

|
#24
NE 2nd Ave
Miami, FL 33132
|
662 sq. feet
|
1 baths 1 beds |
show details | |

|
#25
W 80th Pl
Hialeah, FL 33014
|
1,747 sq. feet
|
3 baths 3 beds |
show details | |

|
#26
NW 33rd St
Miami, FL 33127
|
1,492 sq. feet
|
1 baths 3 beds |
show details | |

|
#27
SW 76th Ave
Miami, FL 33157
|
2,723 sq. feet
|
3 baths 4 beds |
show details | |

|
#28
NW 67th St
Miami, FL 33147
|
2,705 sq. feet
|
4 baths 7 beds |
show details | |

|
#29
Brickell Bay Dr Apt 2001
Miami, FL 33131
|
1,878 sq. feet
|
3 baths 2 beds |
show details | |

|
#30
SW 41st St
Miami, FL 33155
|
1,090 sq. feet
|
1 baths 2 beds |
show details |
| Photo | Address | Area | Beds / Baths | Price | Details |
|---|---|---|---|---|---|

|
#31
SW 74th Ave
Miami, FL 33157
|
3,945 sq. feet
|
4 baths 5 beds |
show details | |

|
#32
SW 74th St
Miami, FL 33183
|
1,640 sq. feet
|
2 baths 3 beds |
show details | |

|
#33
SW 153rd Pl S
Miami, FL 33185
|
1,383 sq. feet
|
2 baths 2 beds |
show details | |

|
#34
Brickell Bay Dr Apt 915
Miami, FL 33131
|
1,249 sq. feet
|
2 baths 2 beds |
show details | |

|
#35
SW 188th St
Miami, FL 33157
|
1,916 sq. feet
|
2 baths 3 beds |
show details | |

|
#36
Sterling Dr
Miami, FL 33157
|
1,164 sq. feet
|
2 baths 3 beds |
show details | |

|
#37
NW 81st Ter
Miami, FL 33147
|
1,530 sq. feet
|
2 baths 3 beds |
show details | |

|
#38
Brickell Bay Dr Ph 4214
Miami, FL 33131
|
1,245 sq. feet
|
2 baths 2 beds |
show details | |

|
#39
SW 87th Ave
Miami, FL 33176
|
4,764 sq. feet
|
5 baths 5 beds |
show details | |

|
#40
Brickell Bay Dr Apt 3724
Miami, FL 33131
|
1,232 sq. feet
|
2 baths 3 beds |
show details |
| Photo | Address | Area | Beds / Baths | Price | Details |
|---|---|---|---|---|---|

|
#41
W 79th St # 32
Hialeah, FL 33014
|
1,080 sq. feet
|
2 baths 2 beds |
show details | |

|
#42
SW 154th Path
Miami, FL 33194
|
1,858 sq. feet
|
2 baths 3 beds |
show details | |

|
#43
NW 56th St
Miami, FL 33127
|
1,573 sq. feet
|
2 baths 3 beds |
show details | |

|
#44
SW 151st Pl
Miami, FL 33185
|
1,814 sq. feet
|
2 baths 5 beds |
show details | |

|
#45
SW 133rd Avenue Rd Apt 117
Miami, FL 33183
|
965 sq. feet
|
2 baths 2 beds |
show details | |

|
#46
NW 53rd St
Miami, FL 33127
|
2,096 sq. feet
|
2 baths 4 beds |
show details | |

|
#47
Brickell Ave Apt 1610
Miami, FL 33131
|
1,289 sq. feet
|
3 baths 2 beds |
show details | |

|
#48
NW 95th Ter
Miami, FL 33147
|
1,224 sq. feet
|
2 baths 3 beds |
show details | |

|
#49
SW 188th Ter
Miami, FL 33157
|
3,479 sq. feet
|
4 baths 5 beds |
show details | |

|
Check over 1 million property listings on Foreclosure.com!
|
browse all offers | |||


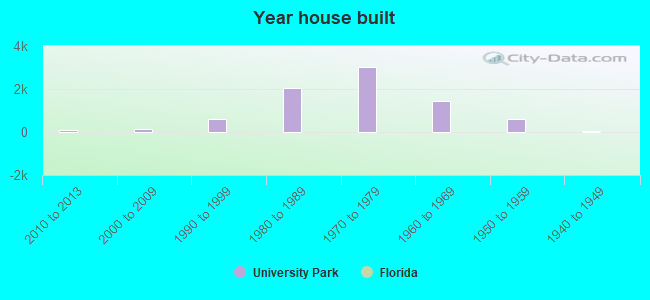
Median year apartment built: 1980
Household type by relationship:
Households: 27,732- Male householders: 4,489 (560 living alone), Female householders: 3,320 (864 living alone)
4,001 spouses (4,001 opposite-sex spouses), 466 unmarried partners, (459 opposite-sex unmarried partners), 7,195 children (6,725 natural, 78 adopted, 391 stepchildren), 490 grandchildren, 455 brothers or sisters, 1,356 parents, 0 foster children, 1,479 other relatives, 1,466 non-relatives
- In group quarters: 3,010
Size of family households: 2,416 2-persons, 1,770 3-persons, 1,176 4-persons, 531 5-persons, 212 6-persons, 183 7-or-more-persons.
Size of nonfamily households: 1,494 1-person, 295 2-persons, 101 3-persons, 102 4-persons, 13 5-persons.
2,268 married couples with children.
805 single-parent households (425 men, 380 women).
12.0% of residents of University Park speak English at home.
88.2% of residents speak Spanish at home (54% speak English very well, 18% speak English well, 18% speak English not well, 10% don't speak English at all).
2.2% of residents speak other Indo-European language at home (90% speak English very well, 4% speak English well, 6% speak English not well).
1.4% of residents speak Asian or Pacific Island language at home (38% speak English very well, 21% speak English well, 27% speak English not well, 13% don't speak English at all).
0.4% of residents speak other language at home (82% speak English very well, 18% speak English not well).
Foreign born population: 17,519 (63.2%)
(67.5% of them are naturalized citizens)
| Here: | 5.5 |
| State: | 5.9 |
| Here: | 3.8 |
| State: | 4.2 |
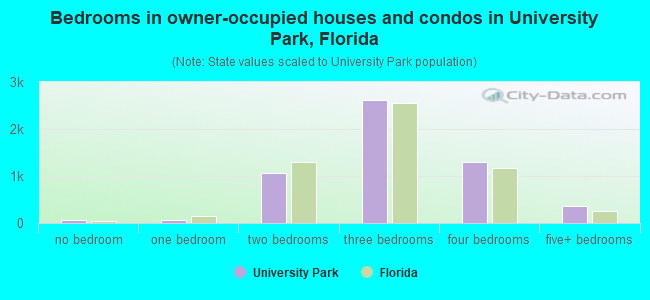
- Bedrooms in owner-occupied houses and condos in University Park, Florida
- 55no bedroom
- 561 bedroom
- 1,0702 bedrooms
- 2,6153 bedrooms
- 1,2894 bedrooms
- 3625+ bedrooms
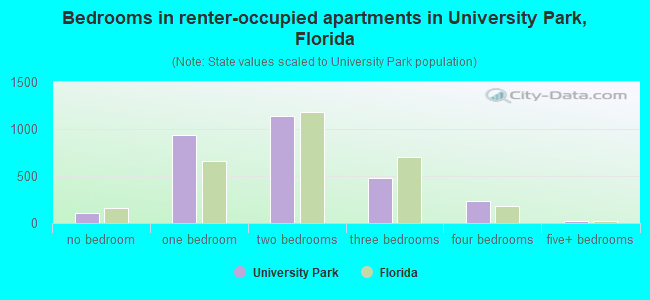
- Bedrooms in renter-occupied apartments in University Park, Florida
- 106no bedroom
- 9351 bedroom
- 1,1352 bedrooms
- 4823 bedrooms
- 2344 bedrooms
- 265+ bedrooms
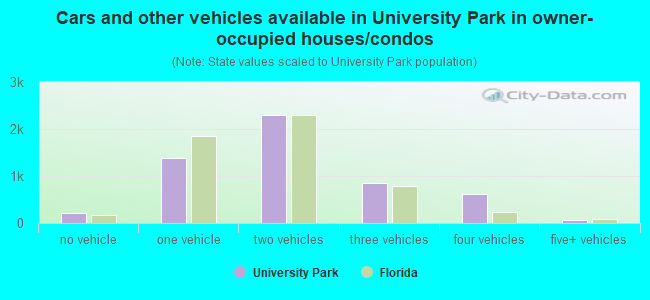
- Cars and other vehicles available in University Park in owner-occupied houses/condos
- 222no vehicle
- 1,3881 vehicle
- 2,2932 vehicles
- 8603 vehicles
- 6164 vehicles
- 675+ vehicles
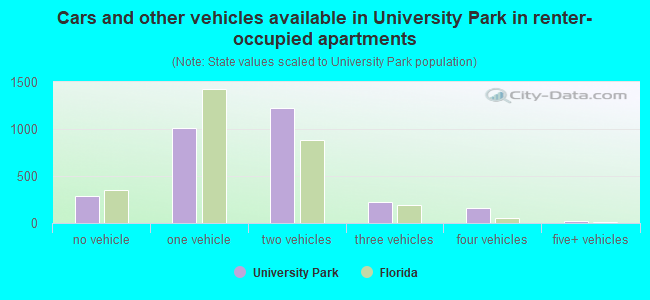
- Cars and other vehicles available in University Park in renter-occupied apartments
- 285no vehicle
- 1,0141 vehicle
- 1,2272 vehicles
- 2193 vehicles
- 1564 vehicles
- 175+ vehicles
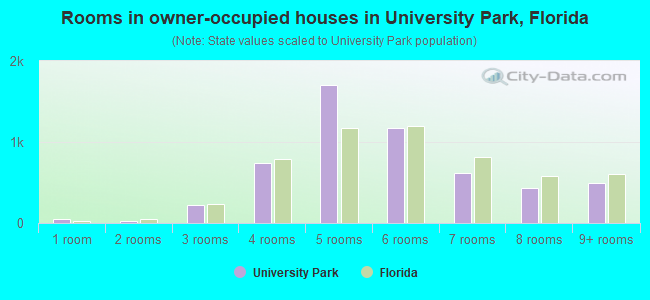
- Rooms in owner-occupied houses in University Park, Florida
- 481 room
- 202 rooms
- 2223 rooms
- 7394 rooms
- 1,7025 rooms
- 1,1766 rooms
- 6237 rooms
- 4278 rooms
- 4909+ rooms
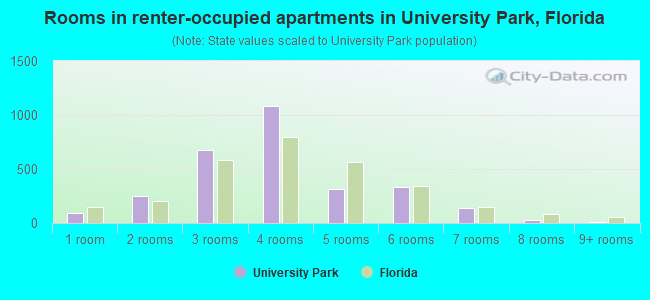
- Rooms in renter-occupied apartments in University Park, Florida
- 961 room
- 2482 rooms
- 6743 rooms
- 1,0794 rooms
- 3125 rooms
- 3306 rooms
- 1377 rooms
- 308 rooms
- 119+ rooms
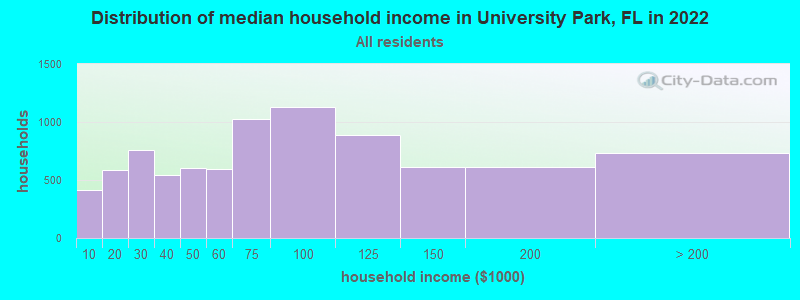
University Park, FL household income distribution

- 417Less than $10,000
- 587$10,000 to $19,999
- 759$20,000 to $29,999
- 539$30,000 to $39,999
- 606$40,000 to $49,999
- 598$50,000 to $59,999
- 1,027$60,000 to $74,999
- 1,132$75,000 to $99,999
- 892$100,000 to $124,999
- 615$125,000 to $149,999
- 610$150,000 to $199,999
- 730$200,000 or more
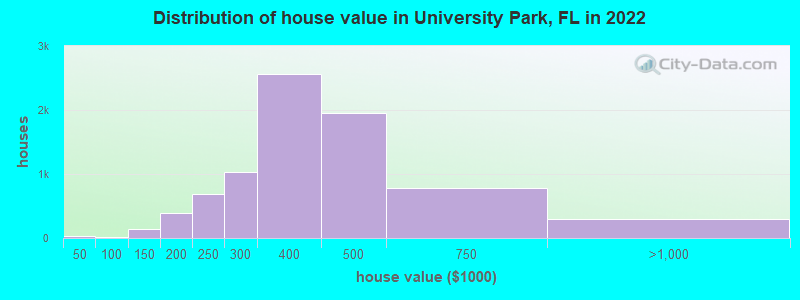
Home value of owner - occupied houses in 2022 in University Park, FL
-
- 18Less than $10,000
- 13$15,000 to $19,999
- 2$50,000 to $59,999
- 9$70,000 to $79,999
- 3$80,000 to $89,999
- 4$90,000 to $99,999
- 81$100,000 to $124,999
- 54$125,000 to $149,999
- 260$150,000 to $174,999
- 133$175,000 to $199,999
- 679$200,000 to $249,999
- 1,033$250,000 to $299,999
- 2,563$300,000 to $399,999
- 1,957$400,000 to $499,999
- 779$500,000 to $749,999
- 297$750,000 to $999,999
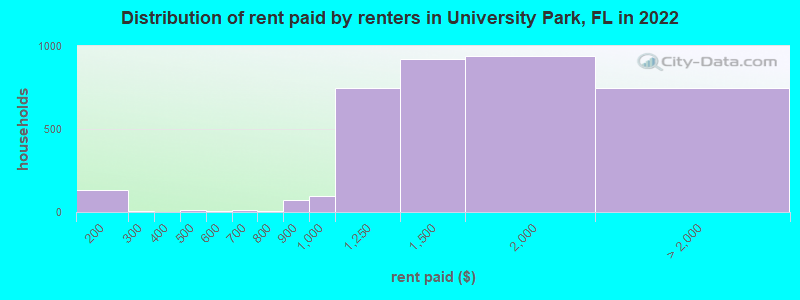
Rent paid by renters in 2022 in University Park, FL
-
- 11$100 to $149
- 122$150 to $199
- 7$250 to $299
- 10$400 to $449
- 3$500 to $549
- 3$550 to $599
- 8$600 to $649
- 6$650 to $699
- 3$700 to $749
- 0$750 to $799
- 72$800 to $899
- 94$900 to $999
- 746$1,000 to $1,249
- 922$1,250 to $1,499
- 941$1,500 to $1,999
- 353$2,000 to $2,499
- 239$2,500 to $2,999
- 28$3,500 or more
- 122No cash rent
Percentage of workers working in this county: 96.1%
Number of people working at home: 1,267 (8.9% of all workers)
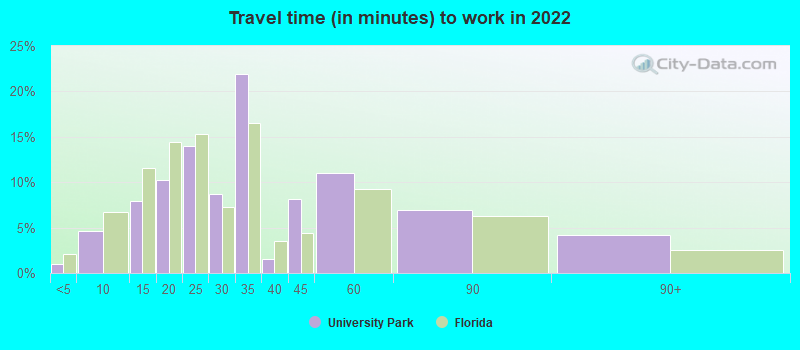
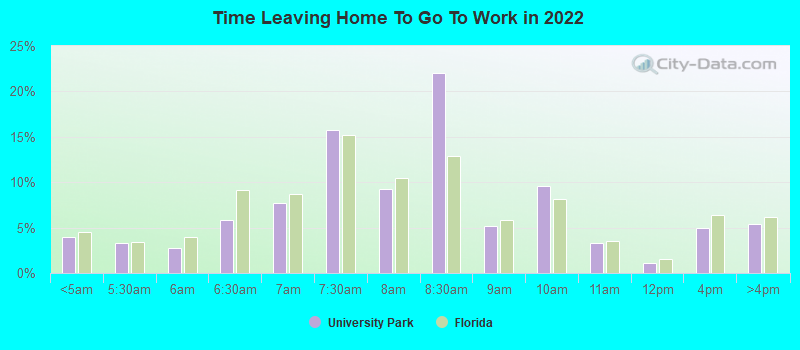
Travel time to work (commute)
- Less than 5 minutes: 93
- 5 to 9 minutes: 647
- 10 to 14 minutes: 911
- 15 to 19 minutes: 804
- 20 to 24 minutes: 1,537
- 25 to 29 minutes: 736
- 30 to 34 minutes: 3,291
- 35 to 39 minutes: 658
- 40 to 44 minutes: 1,103
- 45 to 59 minutes: 1,646
- 60 to 89 minutes: 1,321
- 90 or more minutes: 141
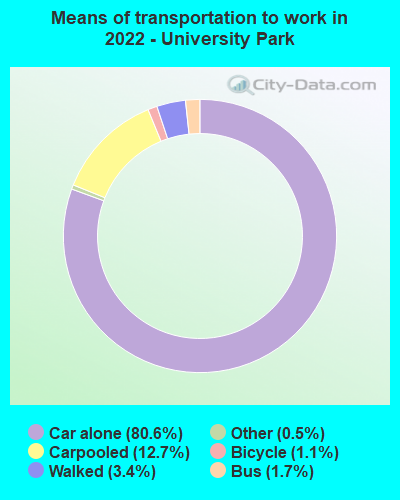
Means of transportation to work:
- Drove a car alone: 11,110 (71.6%)
- Carpooled: 1,816 (11.7%)
- Bus: 148 (1.0%)
- Long-distance train or commuter rail: 8 (0.1%)
- Taxi: 97 (0.6%)
- Bicycle: 133 (0.9%)
- Walked: 523 (3.4%)
- Worked at home: 1,404 (9.0%)
- Unemployment by race in 2022
- Unemployment rate for White non-Hispanic residents
- 9.9%Males
- 6.5%Females
- Unemployment rate for Black residents
- 20.4%Males
- 2.2%Females
- Unemployment rate for Asian residents
- 8.8%Males
- Unemployment rate for Hispanic or Latino residents
- 3.5%Males
- 1.1%Females
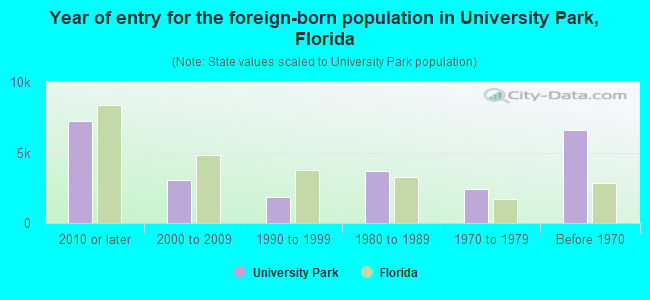
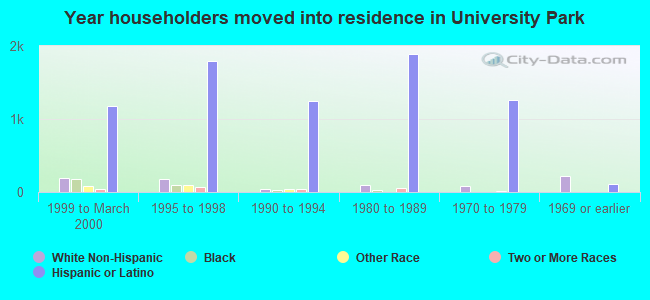
- Year of entry for the foreign-born population in University Park, Florida
- 7,2082010 or later
- 3,0422000 to 2009
- 1,8171990 to 1999
- 3,6711980 to 1989
- 2,4371970 to 1979
- 6,568Before 1970
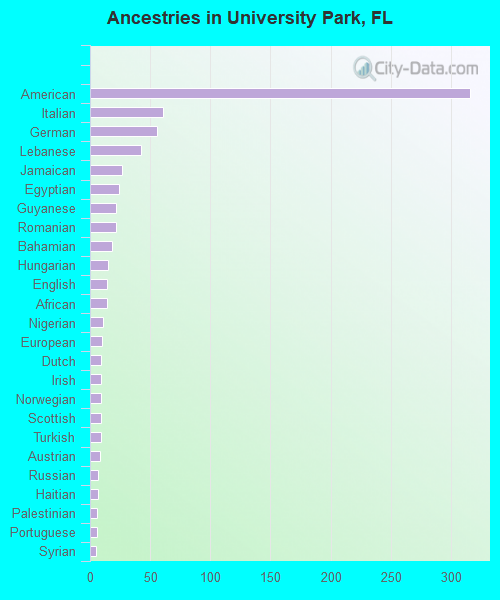
First ancestries reported:
- American: 316 (1.6%)
- Italian: 61 (0.3%)
- German: 56 (0.3%)
- Lebanese: 42 (0.2%)
- Jamaican: 27 (0.1%)
- Egyptian: 24 (0.1%)
- Guyanese: 22 (0.1%)
- Romanian: 22 (0.1%)
- Bahamian: 18 (0.09%)
- Hungarian: 15 (0.08%)
- English: 14 (0.07%)
- African: 14 (0.07%)
- Nigerian: 11 (0.06%)
- European: 10 (0.05%)
- Dutch: 9 (0.05%)
- Irish: 9 (0.05%)
- Norwegian: 9 (0.05%)
- Scottish: 9 (0.05%)
- Turkish: 9 (0.05%)
- Austrian: 8 (0.04%)
- Russian: 7 (0.04%)
- Haitian: 7 (0.04%)
- Palestinian: 6 (0.03%)
- Portuguese: 6 (0.03%)
- Syrian: 5 (0.03%)
- Arab: 5 (0.03%)
- Scotch-Irish: 4 (0.02%)
Most common places of birth for foreign-born residents (%):
| University Park: | 75.6% (12,746) |
| Florida: | 100.0% (-1) |
| University Park: | 5.2% (881) |
| Florida: | 100.0% (-1) |
| University Park: | 3.6% (608) |
| Florida: | 100.0% (-1) |
| University Park: | 3.4% (566) |
| Florida: | 100.0% (-1) |
| University Park: | 2.3% (390) |
| Florida: | 100.0% (-1) |
| University Park: | 1.9% (318) |
| Florida: | 100.0% (-1) |
| University Park: | 1.8% (305) |
| Florida: | 100.0% (-1) |
| University Park: | 1.7% (281) |
| Florida: | 100.0% (-1) |
Place of birth for U.S.-born residents:
- This state: 8,637
- Other state: 1,661
- Northeast: 1,087
- Midwest: 217
- South: 242
- West: 120
89.8% of University Park residents lived in the same house 1 years ago.
Out of people who lived in different houses, 34.8% lived in this county.
Out of people who lived in different counties, 56.9% lived in Florida.
| University Park: | 89.8% |
| State average: | 86.3% |
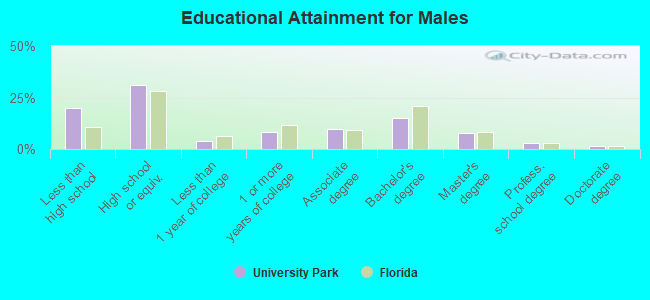
Education attainment for males 25 years and older:
- No schooling: 336
- Nursery to 4th grade: 18
- 5th and 6th grade: 113
- 7th and 8th grade: 166
- 9th grade: 159
- 10th grade: 64
- 11th grade: 62
- 12th grade, no diploma: 916
- High school graduate (or equivalency): 2,866
- Less than 1 year of college: 363
- Some college more than 1 year, no degree: 751
- Associate degree: 914
- Bachelor's degree: 1,411
- Master's degree: 724
- Professional school degree: 258
- Doctorate degree: 122
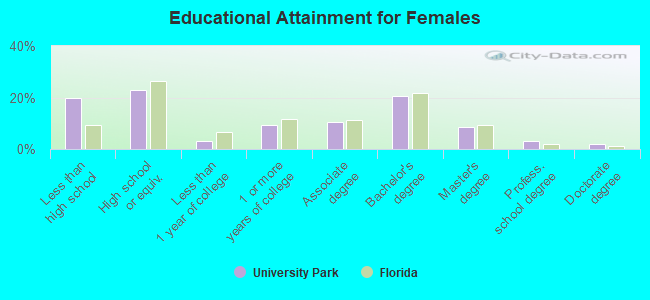
Education attainment for females 25 years and older:
- No schooling: 287
- Nursery to 4th grade: 121
- 5th and 6th grade: 362
- 7th and 8th grade: 159
- 9th grade: 97
- 10th grade: 27
- 11th grade: 136
- 12th grade, no diploma: 825
- High school graduate (or equivalency): 2,352
- Less than 1 year of college: 321
- Some college more than 1 year, no degree: 952
- Associate degree: 1,067
- Bachelor's degree: 2,112
- Master's degree: 851
- Professional school degree: 314
- Doctorate degree: 198


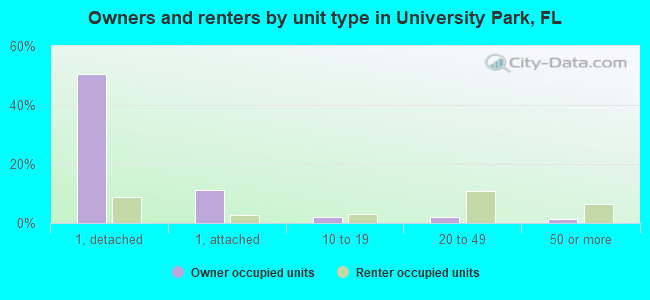
Housing units in structures:
- One, detached: 5,093
- One, attached: 1,076
- 3 or 4: 73
- 5 to 9: 206
- 10 to 19: 427
- 20 to 49: 1,080
- 50 or more: 514
Median worth of mobile homes: $594,042
Housing units lacking complete kitchen facilities in 2022: 1.4%
House/condo owner moved in on average 19 years ago
Renter moved in on average 2 years ago
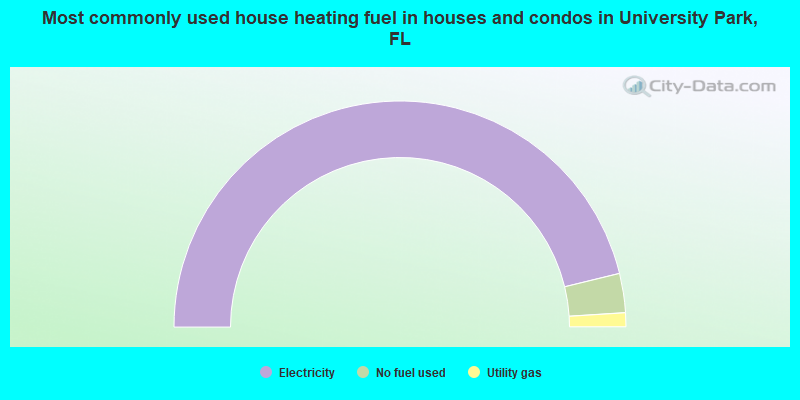
- 92.4%Electricity
- 5.6%No fuel used
- 2.0%Utility gas
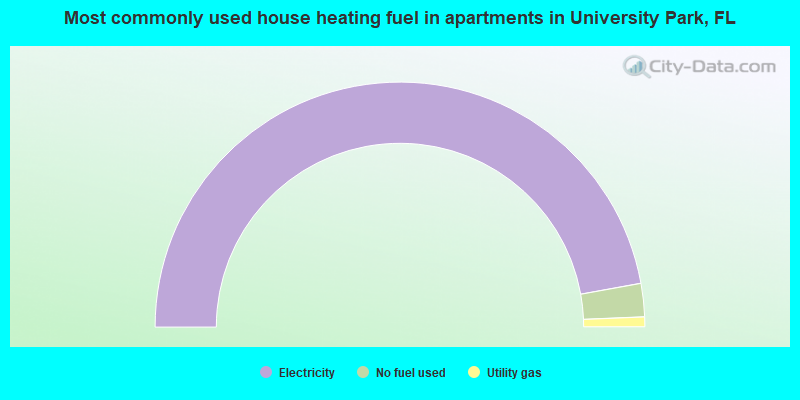
- 94.3%Electricity
- 4.4%No fuel used
- 1.3%Utility gas
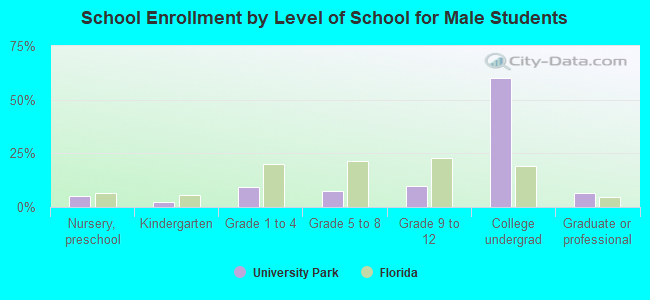
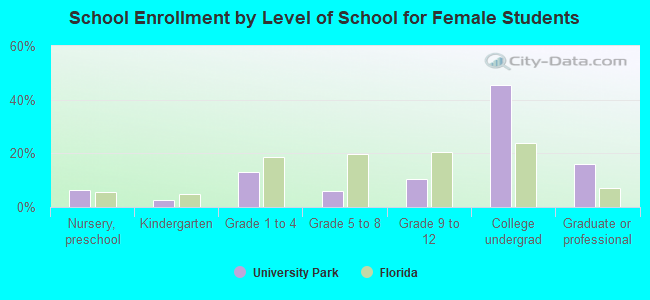
Private vs. public school enrollment:
| Here: | 20.0% |
| Florida: | 15.8% |
| Here: | 13.1% |
| Florida: | 12.9% |
| Here: | 34.4% |
| Florida: | 23.6% |