Races in University Park, Florida (FL) Detailed Stats
Data:
Races - White alone (%)
Races - White alone (% change since 2000)
Races - Black alone (%)
Races - Black alone (% change since 2000)
Races - American Indian alone (%)
Races - American Indian alone (% change since 2000)
Races - Asian alone (%)
Races - Asian alone (% change since 2000)
Races - Hispanic (%)
Races - Hispanic (% change since 2000)
Races - Native Hawaiian and Other Pacific Islander alone (%)
Races - Native Hawaiian and Other Pacific Islander alone (% change since 2000)
Races - Two or more races(%)
Races - Two or more races(% change since 2000)
Races - Other race alone (%)
Races - Other race alone (% change since 2000)
Racial diversity
Place of birth - Born in state of residence (%)
Place of birth - Born in state of residence (%) - White
Place of birth - Born in state of residence (%) - Black or African American
Place of birth - Born in state of residence (%) - Asian
Place of birth - Born in state of residence (%) - Hispanic or Latino
Place of birth - Born in state of residence (%) - American Indian and Alaska Native
Place of birth - Born in state of residence (%) - Multirace
Place of birth - Born in state of residence (%) - Other Race
Place of birth - Born in other state (%)
Place of birth - Born in other state (%) - White
Place of birth - Born in other state (%) - Black or African American
Place of birth - Born in other state (%) - Asian
Place of birth - Born in other state (%) - Hispanic or Latino
Place of birth - Born in other state (%) - American Indian and Alaska Native
Place of birth - Born in other state (%) - Multirace
Place of birth - Born in other state (%) - Other Race
Place of birth - Native, outside of US (%)
Place of birth - Native, outside of US (%) - White
Place of birth - Native, outside of US (%) - Black or African American
Place of birth - Native, outside of US (%) - Asian
Place of birth - Native, outside of US (%) - Hispanic or Latino
Place of birth - Native, outside of US (%) - American Indian and Alaska Native
Place of birth - Native, outside of US (%) - Multirace
Place of birth - Native, outside of US (%) - Other Race
Place of birth - Foreign born (%)
Place of birth - Foreign born (%) - White
Place of birth - Foreign born (%) - Black or African American
Place of birth - Foreign born (%) - Asian
Place of birth - Foreign born (%) - Hispanic or Latino
Place of birth - Foreign born (%) - American Indian and Alaska Native
Place of birth - Foreign born (%) - Multirace
Place of birth - Foreign born (%) - Other Race
Residents speaking English at home (%)
Residents speaking English at home - Born in the United States (%)
Residents speaking English at home - Native, born elsewhere (%)
Residents speaking English at home - Foreign born (%)
Residents speaking Spanish at home (%)
Residents speaking Spanish at home - Born in the United States (%)
Residents speaking Spanish at home - Native, born elsewhere (%)
Residents speaking Spanish at home - Foreign born (%)
Residents speaking other language at home (%)
Residents speaking other language at home - Born in the United States (%)
Residents speaking other language at home - Native, born elsewhere (%)
Residents speaking other language at home - Foreign born (%)
Marital status - Never married (%)
Marital status - Now married (%)
Marital status - Separated (%)
Marital status - Widowed (%)
Marital status - Divorced (%)
Ancestries Reported - Arab (%)
Ancestries Reported - Czech (%)
Ancestries Reported - Danish (%)
Ancestries Reported - Dutch (%)
Ancestries Reported - English (%)
Ancestries Reported - French (%)
Ancestries Reported - French Canadian (%)
Ancestries Reported - German (%)
Ancestries Reported - Greek (%)
Ancestries Reported - Hungarian (%)
Ancestries Reported - Irish (%)
Ancestries Reported - Italian (%)
Ancestries Reported - Lithuanian (%)
Ancestries Reported - Norwegian (%)
Ancestries Reported - Polish (%)
Ancestries Reported - Portuguese (%)
Ancestries Reported - Russian (%)
Ancestries Reported - Scotch-Irish (%)
Ancestries Reported - Scottish (%)
Ancestries Reported - Slovak (%)
Ancestries Reported - Subsaharan African (%)
Ancestries Reported - Swedish (%)
Ancestries Reported - Swiss (%)
Ancestries Reported - Ukrainian (%)
Ancestries Reported - United States (%)
Ancestries Reported - Welsh (%)
Ancestries Reported - West Indian (%)
Ancestries Reported - Other (%)
Geographical mobility - Same house 1 year ago (%)
Geographical mobility - Same house 1 year ago (%) - White
Geographical mobility - Same house 1 year ago (%) - Black or African American
Geographical mobility - Same house 1 year ago (%) - Asian
Geographical mobility - Same house 1 year ago (%) - Hispanic or Latino
Geographical mobility - Same house 1 year ago (%) - American Indian and Alaska Native
Geographical mobility - Same house 1 year ago (%) - Multirace
Geographical mobility - Same house 1 year ago (%) - Other Race
Geographical mobility - Moved within same county (%)
Geographical mobility - Moved within same county (%) - White
Geographical mobility - Moved within same county (%) - Black or African American
Geographical mobility - Moved within same county (%) - Asian
Geographical mobility - Moved within same county (%) - Hispanic or Latino
Geographical mobility - Moved within same county (%) - American Indian and Alaska Native
Geographical mobility - Moved within same county (%) - Multirace
Geographical mobility - Moved within same county (%) - Other Race
Geographical mobility - Moved from different county within same state (%)
Geographical mobility - Moved from different county within same state (%) - White
Geographical mobility - Moved from different county within same state (%) - Black or African American
Geographical mobility - Moved from different county within same state (%) - Asian
Geographical mobility - Moved from different county within same state (%) - Hispanic or Latino
Geographical mobility - Moved from different county within same state (%) - American Indian and Alaska Native
Geographical mobility - Moved from different county within same state (%) - Multirace
Geographical mobility - Moved from different county within same state (%) - Other Race
Geographical mobility - Moved from different state (%)
Geographical mobility - Moved from different state (%) - White
Geographical mobility - Moved from different state (%) - Black or African American
Geographical mobility - Moved from different state (%) - Asian
Geographical mobility - Moved from different state (%) - Hispanic or Latino
Geographical mobility - Moved from different state (%) - American Indian and Alaska Native
Geographical mobility - Moved from different state (%) - Multirace
Geographical mobility - Moved from different state (%) - Other Race
Geographical mobility - Moved from abroad (%)
Geographical mobility - Moved from abroad (%) - White
Geographical mobility - Moved from abroad (%) - Black or African American
Geographical mobility - Moved from abroad (%) - Asian
Geographical mobility - Moved from abroad (%) - Hispanic or Latino
Geographical mobility - Moved from abroad (%) - American Indian and Alaska Native
Geographical mobility - Moved from abroad (%) - Multirace
Geographical mobility - Moved from abroad (%) - Other Race
Place of birth for the foreign-born population - Ireland (%)
Place of birth for the foreign-born population - Denmark (%)
Place of birth for the foreign-born population - Norway (%)
Place of birth for the foreign-born population - Sweden (%)
Place of birth for the foreign-born population - United Kingdom (%)
Place of birth for the foreign-born population - England (%)
Place of birth for the foreign-born population - Scotland (%)
Place of birth for the foreign-born population - Other Northern Europe (%)
Place of birth for the foreign-born population - Austria (%)
Place of birth for the foreign-born population - Belgium (%)
Place of birth for the foreign-born population - France (%)
Place of birth for the foreign-born population - Germany (%)
Place of birth for the foreign-born population - Netherlands (%)
Place of birth for the foreign-born population - Switzerland (%)
Place of birth for the foreign-born population - Other Western Europe (%)
Place of birth for the foreign-born population - Greece (%)
Place of birth for the foreign-born population - Italy (%)
Place of birth for the foreign-born population - Portugal (%)
Place of birth for the foreign-born population - Spain (%)
Place of birth for the foreign-born population - Other Southern Europe (%)
Place of birth for the foreign-born population - Albania (%)
Place of birth for the foreign-born population - Belarus (%)
Place of birth for the foreign-born population - Bosnia and Herzegovina (%)
Place of birth for the foreign-born population - Bulgaria (%)
Place of birth for the foreign-born population - Croatia (%)
Place of birth for the foreign-born population - Czechoslovakia (%)
Place of birth for the foreign-born population - Hungary (%)
Place of birth for the foreign-born population - Latvia (%)
Place of birth for the foreign-born population - Lithuania (%)
Place of birth for the foreign-born population - North Macedonia (Macedonia) (%)
Place of birth for the foreign-born population - Moldova (%)
Place of birth for the foreign-born population - Poland (%)
Place of birth for the foreign-born population - Romania (%)
Place of birth for the foreign-born population - Russia (%)
Place of birth for the foreign-born population - Serbia (%)
Place of birth for the foreign-born population - Ukraine (%)
Place of birth for the foreign-born population - Other Eastern Europe (%)
Place of birth for the foreign-born population - China (%)
Place of birth for the foreign-born population - Hong Kong (%)
Place of birth for the foreign-born population - Taiwan (%)
Place of birth for the foreign-born population - Japan (%)
Place of birth for the foreign-born population - Korea (%)
Place of birth for the foreign-born population - Other Eastern Asia (%)
Place of birth for the foreign-born population - Afghanistan (%)
Place of birth for the foreign-born population - Bangladesh (%)
Place of birth for the foreign-born population - India (%)
Place of birth for the foreign-born population - Iran (%)
Place of birth for the foreign-born population - Kazakhstan (%)
Place of birth for the foreign-born population - Nepal (%)
Place of birth for the foreign-born population - Pakistan (%)
Place of birth for the foreign-born population - Sri Lanka (%)
Place of birth for the foreign-born population - Uzbekistan (%)
Place of birth for the foreign-born population - Other South Central Asia (%)
Place of birth for the foreign-born population - Burma (%)
Place of birth for the foreign-born population - Cambodia (%)
Place of birth for the foreign-born population - Indonesia (%)
Place of birth for the foreign-born population - Laos (%)
Place of birth for the foreign-born population - Malaysia (%)
Place of birth for the foreign-born population - Philippines (%)
Place of birth for the foreign-born population - Singapore (%)
Place of birth for the foreign-born population - Thailand (%)
Place of birth for the foreign-born population - Vietnam (%)
Place of birth for the foreign-born population - Other South Eastern Asia (%)
Place of birth for the foreign-born population - Armenia (%)
Place of birth for the foreign-born population - Iraq (%)
Place of birth for the foreign-born population - Israel (%)
Place of birth for the foreign-born population - Jordan (%)
Place of birth for the foreign-born population - Kuwait (%)
Place of birth for the foreign-born population - Lebanon (%)
Place of birth for the foreign-born population - Saudi Arabia (%)
Place of birth for the foreign-born population - Syria (%)
Place of birth for the foreign-born population - Turkey (%)
Place of birth for the foreign-born population - Yemen (%)
Place of birth for the foreign-born population - Other Western Asia (%)
Place of birth for the foreign-born population - Eritrea (%)
Place of birth for the foreign-born population - Ethiopia (%)
Place of birth for the foreign-born population - Kenya (%)
Place of birth for the foreign-born population - Somalia (%)
Place of birth for the foreign-born population - Uganda (%)
Place of birth for the foreign-born population - Zimbabwe (%)
Place of birth for the foreign-born population - Other Eastern Africa (%)
Place of birth for the foreign-born population - Cameroon (%)
Place of birth for the foreign-born population - Congo (%)
Place of birth for the foreign-born population - Democratic Republic of Congo (Zaire) (%)
Place of birth for the foreign-born population - Other Middle Africa (%)
Place of birth for the foreign-born population - Egypt (%)
Place of birth for the foreign-born population - Morocco (%)
Place of birth for the foreign-born population - Sudan (%)
Place of birth for the foreign-born population - Other Northern Africa (%)
Place of birth for the foreign-born population - South Africa (%)
Place of birth for the foreign-born population - Other Southern Africa (%)
Place of birth for the foreign-born population - Cabo Verde (%)
Place of birth for the foreign-born population - Ghana (%)
Place of birth for the foreign-born population - Liberia (%)
Place of birth for the foreign-born population - Nigeria (%)
Place of birth for the foreign-born population - Senegal (%)
Place of birth for the foreign-born population - Sierra Leone (%)
Place of birth for the foreign-born population - Other Western Africa (%)
Place of birth for the foreign-born population - Australia (%)
Place of birth for the foreign-born population - New Zealand (%)
Place of birth for the foreign-born population - Fiji (%)
Place of birth for the foreign-born population - Micronesia (%)
Place of birth for the foreign-born population - Bahamas (%)
Place of birth for the foreign-born population - Barbados (%)
Place of birth for the foreign-born population - Cuba (%)
Place of birth for the foreign-born population - Dominica (%)
Place of birth for the foreign-born population - Dominican Republic (%)
Place of birth for the foreign-born population - Grenada (%)
Place of birth for the foreign-born population - Haiti (%)
Place of birth for the foreign-born population - Jamaica (%)
Place of birth for the foreign-born population - St. Vincent and the Grenadines (%)
Place of birth for the foreign-born population - Trinidad and Tobago (%)
Place of birth for the foreign-born population - West Indies (%)
Place of birth for the foreign-born population - Other Caribbean (%)
Place of birth for the foreign-born population - Belize (%)
Place of birth for the foreign-born population - Costa Rica (%)
Place of birth for the foreign-born population - El Salvador (%)
Place of birth for the foreign-born population - Guatemala (%)
Place of birth for the foreign-born population - Honduras (%)
Place of birth for the foreign-born population - Mexico (%)
Place of birth for the foreign-born population - Nicaragua (%)
Place of birth for the foreign-born population - Panama (%)
Place of birth for the foreign-born population - Other Central America (%)
Place of birth for the foreign-born population - Argentina (%)
Place of birth for the foreign-born population - Bolivia (%)
Place of birth for the foreign-born population - Brazil (%)
Place of birth for the foreign-born population - Chile (%)
Place of birth for the foreign-born population - Colombia (%)
Place of birth for the foreign-born population - Ecuador (%)
Place of birth for the foreign-born population - Guyana (%)
Place of birth for the foreign-born population - Peru (%)
Place of birth for the foreign-born population - Uruguay (%)
Place of birth for the foreign-born population - Venezuela (%)
Place of birth for the foreign-born population - Other South America (%)
Place of birth for the foreign-born population - Canada (%)
Place of birth for the foreign-born population - Other Northern America (%)
Place of birth for the foreign-born population - Other (%)
Beertopia, Parrish Heritage Days, Art in the Park, Gamble Plantation Open House & more, all this weekend! (2 replies)Billionaire Ken Griffin says Miami could unseat New York as the world's financial center (67 replies)County Fair, Corvettes, Jazz, Elvis, Lido Beach Party, St. Pat Parade & more, all this weekend! (1 reply)Is Sarasota in a bubble (860 replies)What all communities have drinks inside gates/boundaries? (8 replies)I'm thinking tourism is taking a hit this summer. (17 replies)
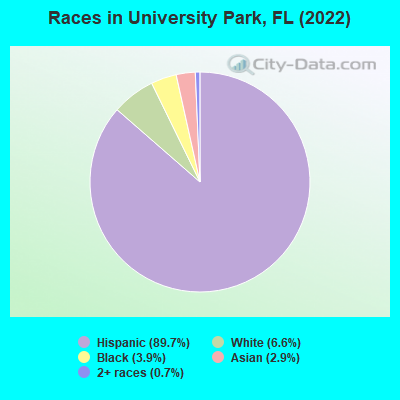
According to 2022 data, the most numerous races in University Park, FL are White alone (1,830 residents), Hispanic (24,866 residents), and Black alone (1,074 residents). 12.3% of University Park residents speak English at home. 60.8% of University Park, FL residents are foreign-born (55.7% born in Latin America), which is 65.4% greater than the foreign-born rate of 21.0% across the entire state of Florida.
Race distribution in University Park
2000 2022
10,458,509 65.4% White alone 2,682,715 16.8% Hispanic 2,264,268 14.2% Black alone 261,693 1.6% Asian alone 236,954 1.5% Two or more races 42,358 0.3% American Indian alone 28,994 0.2% Other race alone 6,887 0.04% Native Hawaiian and Other
11,309,403 50.8% White alone 6,025,039 27.1% Hispanic 3,241,015 14.6% Black alone 861,630 3.9% Two or more races 623,692 2.8% Asian alone 152,054 0.7% Other race alone 22,504 0.1% American Indian alone 9,486 0.04% Native Hawaiian and Other
Income and house value in University Park Median household income in 2022 $120,789 White non-Hispanic householders$25,738 Black householders$62,375 American Indian and Alaska Native householders$81,969 Asian householders$97,548 Some other race householders$86,261 Two or more races householders$73,120 Hispanic or Latino race householdersMedian 2022 house value $578,638 White Non-Hispanic householders$525,779 Black or African American householders $550,607 Asian householders$398,039 Some other race householders$544,200 Two or more races householders$596,658 Hispanic or Latino householders
Median age by race in University Park
46.8 Median age for White residents44.5 50.8 22.0 Median age for Black or African American residents23.1 21.8 42.3 Median age for American Indian / Alaska Native residents27.4 Median age for Asian residents27.7 28.6 28.3 Median age for Other race residents48.3 27.4 30.9 Median age for Two or more races residents35.6 15.7 22.2 Median age for White alone residents23.0 21.4 47.0 Median age for Hispanic or Latino residents44.8 50.7
Owner/renter occupied households by race in University Park
House owners and renters - White residents 4,684 68.7% Owner occupied2,136 31.3% Renter occupiedHouse owners and renters - Black or African American residents 128 68.9% Owner occupied58 31.1% Renter occupiedHouse owners and renters - American Indian / Alaska Native residents 8 100.0% Renter occupiedHouse owners and renters - Asian residents 26 14.7% Owner occupied148 85.3% Renter occupiedHouse owners and renters - Other race residents 111 100.0% Owner occupiedHouse owners and renters - Two or more races residents 73 22.4% Owner occupied253 77.6% Renter occupiedHouse owners and renters - White alone residents 297 81.6% Owner occupied67 18.4% Renter occupiedHouse owners and renters - Hispanic or Latino residents 5,797 67.8% Owner occupied2,751 32.2% Renter occupied
Language usage in University Park
English speakers - Total 12.3% of residents of University Park speak English at home.
84.8% of residents speak Spanish at home 11,824 53.1% Speak English very well10,435 46.9% Speak English less than very well4.1% of residents speak other language at home 714 66.8% Speak English very well355 33.2% Speak English less than very well
English speakers - Born in the United States 36.6% of residents of University Park speak English at home.
62.9% of residents speak Spanish at home 919 85.6% Speak English very well154 14.4% Speak English less than very well1.4% of residents speak other language at home 24 100.0% Speak English very well
English speakers - Native, born elsewhere 0.0% of residents of University Park speak English at home.
96.9% of residents speak Spanish at home 343 90.7% Speak English very well35 9.3% Speak English less than very well3.1% of residents speak other language at home 12 100.0% Speak English very well
English speakers - Foreign-born 2.7% of residents of University Park speak English at home.
91.8% of residents speak Spanish at home 5,639 35.9% Speak English very well10,076 64.1% Speak English less than very well5.6% of residents speak other language at home 609 63.4% Speak English very well352 36.6% Speak English less than very well
White (Caucasian) - Speak only English Native:
21.2% (1,515)Foreign-born:
3.3% (328)
White (Caucasian) - Speak another language Native:
56.6% (4,049)Foreign-born:
92.2% (9,283)
Black or African American - Speak only English Native:
89.6% (950)Foreign-born:
17.1% (53)
Black or African American - Speak another language Native:
8.2% (87)Foreign-born:
83.0% (259)
Asian - Speak only English Native:
47.6% (59)Foreign-born:
6.5% (45)
Asian - Speak another language Native:
51.3% (63)Foreign-born:
89.5% (613)
Other race - Speak another language Native:
99.1% (53)Foreign-born:
93.2% (198)
Two or more races - Speak another language Native:
100.0% (308)Foreign-born:
68.2% (730)
White alone - Speak only English Native:
67.3% (977)Foreign-born:
17.9% (47)
White alone - Speak another language Native:
32.3% (469)Foreign-born:
82.0% (215)
Hispanic or Latino - Speak only English Native:
9.8% (686)Foreign-born:
2.2% (362)
Hispanic or Latino - Speak another language Native:
87.6% (6,151)Foreign-born:
97.6% (16,242)
Foreign-born residents in University Park 16,851 residents are foreign born (55.7% Latin America ).
This city:
60.8%Florida:
100.0%
Marital status for residents in University Park Marital status - White (Caucasian) population 15 years and over
Males 38.3% Never married46.1% Now married1.2% Separated1.8% Widowed12.6% DivorcedFemales 32.2% Never married38.3% Now married3.3% Separated12.3% Widowed13.9% DivorcedWomen who gave birth in the past 12 months Now married:
30.8% (58)Unmarried:
69.2% (129)
Women who did not give birth in the past 12 months Now married:
37.2% (1,647)Unmarried:
62.8% (2,777)
Marital status - Black or African American population 15 years and over
Males 82.9% Never married9.7% Now married0.0% Separated5.4% Widowed2.0% DivorcedFemales 83.5% Never married6.0% Now married5.4% Separated0.0% Widowed5.1% DivorcedWomen who gave birth in the past 12 months Now married:
100.0% (7)Unmarried:
0.0% (0)
Women who did not give birth in the past 12 months Now married:
4.3% (23)Unmarried:
95.7% (517)
Marital status - Asian population 15 years and over
Males 82.7% Never married17.3% Now married0.0% Separated0.0% Widowed0.0% DivorcedFemales 63.1% Never married34.2% Now married0.0% Separated0.0% Widowed2.7% DivorcedWomen who did not give birth in the past 12 months Now married:
23.7% (95)Unmarried:
76.3% (304)
Marital status - Other race population 15 years and over
Males 38.5% Never married61.5% Now married0.0% Separated0.0% Widowed0.0% DivorcedFemales 52.2% Never married20.0% Now married0.0% Separated27.8% Widowed0.0% DivorcedWomen who did not give birth in the past 12 months Now married:
17.8% (20)Unmarried:
82.2% (92)
Marital status - Two or more races population 15 years and over
Males 47.0% Never married53.0% Now married0.0% Separated0.0% Widowed0.0% DivorcedFemales 81.0% Never married17.5% Now married0.0% Separated0.0% Widowed1.6% DivorcedWomen who gave birth in the past 12 months Now married:
100.0% (71)Unmarried:
0.0% (0)
Women who did not give birth in the past 12 months Now married:
0.0% (0)Unmarried:
100.0% (335)
Marital status - White alone, not Hispanic / Latino population 15 years and over
Males 61.7% Never married22.1% Now married0.9% Separated1.5% Widowed13.8% DivorcedFemales 55.8% Never married28.6% Now married0.0% Separated4.9% Widowed10.7% DivorcedWomen who gave birth in the past 12 months Now married:
100.0% (8)Unmarried:
0.0% (0)
Women who did not give birth in the past 12 months Now married:
23.4% (114)Unmarried:
76.6% (373)
Marital status - Hispanic or Latino population 15 years and over
Males 36.1% Never married48.4% Now married1.2% Separated2.1% Widowed12.1% DivorcedFemales 30.6% Never married38.8% Now married3.7% Separated12.8% Widowed14.1% DivorcedWomen who gave birth in the past 12 months Now married:
30.8% (73)Unmarried:
69.2% (164)
Women who did not give birth in the past 12 months Now married:
38.6% (2,015)Unmarried:
61.4% (3,205)
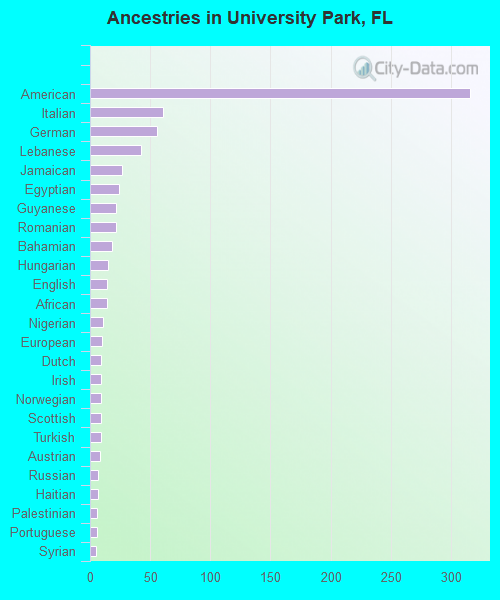
Ancestries in University Park
316 1.6% American61 0.3% Italian56 0.3% German42 0.2% Lebanese27 0.1% Jamaican24 0.1% Egyptian22 0.1% Guyanese22 0.1% Romanian18 0.09% Bahamian15 0.08% Hungarian14 0.07% English14 0.07% African11 0.06% Nigerian10 0.05% European9 0.05% Dutch9 0.05% Irish9 0.05% Norwegian9 0.05% Scottish9 0.05% Turkish8 0.04% Austrian7 0.04% Russian7 0.04% Haitian6 0.03% Palestinian6 0.03% Portuguese5 0.03% Syrian5 0.03% Arab4 0.02% Scotch-Irish
Children Nativity (place of birth) in University Park
Children under 6 years - Living with two parents Both parents native 361 100.0% NativeBoth parents foreign-born 407 100.0% NativeOne native, one foreign-born parent 232 100.0% NativeChildren under 6 years - Living with one parent Native parent 111 100.0% NativeForeign-born parent 388 95.9% Native16 4.1% Foreign-bornChildren 6 to 17 years - Living with two parents Both parents native 266 100.0% NativeBoth parents foreign-born 358 41.2% Native512 58.8% Foreign-bornOne native, one foreign-born parent 325 100.0% NativeChildren 6 to 17 years - Living with one parent Foreign-born parent 393 59.5% Native267 40.5% Foreign-born
Grandparents responsible for own grandchildren in University Park
Grandparents (30 to 59 years) White / Caucasian 17 5.7% Responsible for grandchildren285 94.3% Not responsible for grandchildrenWhite alone, not Hispanic / Latino 5 100.0% Responsible for grandchildrenHispanic or Latino 16 4.2% Responsible for grandchildren372 95.8% Not responsible for grandchildren
Grandparents (60 years and over) White / Caucasian 4 1.8% Responsible for grandchildren210 98.2% Not responsible for grandchildrenWhite alone, not Hispanic / Latino 11 100.0% Not responsible for grandchildrenHispanic or Latino 3 1.0% Responsible for grandchildren347 99.0% Not responsible for grandchildren