St. Cloud, FL (Florida) Houses and Residents
Estimated median house or condo value in 2022: $352,130 (it was $86,200 in 2000 )
St. Cloud:
$352,130Florida:
$354,100
Lower value quartile - upper value quartile: $263,464 - $430,810Mean price in 2022: Detached houses: $242,322 Here:
$242,322State:
$500,941
Townhouses or other attached units: $204,037 Here:
$204,037State:
$370,869
In 2-unit structures: $360,801 Here:
$360,801State:
$423,188
In 3-to-4-unit structures: $145,118 Here:
$145,118State:
$309,944
In 5-or-more-unit structures: $131,057 Here:
$131,057State:
$447,145
Mobile homes: $82,939 Here:
$82,939State:
$113,202
Total population: 43,005 (Urban population: 20,093, Rural population: 7 (all nonfarm) )
Houses: 22,944 (19,570 occupied: 16,037 owner occupied, 6,540 renter occupied )
% of renters here:
29%State:
33%
Housing density: 2,504 houses/condos per square mile
Median price asked for vacant for-sale houses and condos in 2022: $163,508.
Median contract rent in 2022: $1,358 (lower quartile is $1,034, upper quartile is $1,867)
Median rent asked for vacant for-rent units in 2022: $858
Median gross rent in St. Cloud, FL in 2022: $1,573
Housing units in St. Cloud with a mortgage: 11,487 (403 second mortgage, 14 home equity loan, 236 both second mortgage and home equity loan )Houses without a mortgage: 21
Median household income for houses/condos with a mortgage: $89,091
Median household income for apartments without a mortgage: $53,705
Median monthly housing costs: $1,503
Data:
Median house or condo value ($)
Median house or condo value ($ change since 2000)
Median house or condo value ($) - White
Median house or condo value ($) - Black or African American
Median house or condo value ($) - Asian
Median house or condo value ($) - Hispanic or Latino
Median house or condo value ($) - American Indian and Alaska Native
Median house or condo value ($) - Multirace
Median house or condo value ($) - Other Race
Median price asked for mobile homes ($)
Household density (households per square mile)
Mean house or condo value by units in structure - 1, detached ($)
Mean house or condo value by units in structure - 1, attached ($)
Mean house or condo value by units in structure - 2 ($)
Mean house or condo value by units in structure by units in structure - 3 or 4 ($)
Mean house or condo value by units in structure - 5 or more ($)
Mean house or condo value by units in structure - Boat, RV, van, etc. ($)
Mean house or condo value by units in structure - Mobile home ($)
Median contract rent ($)
Median contract rent - Lower quartile ($)
Median contract rent - Upper quartile ($)
Median gross rent ($)
Urban houses (%)
Rural houses (%)
Houses occupied (%)
Houses occupied (% change since 2000)
Houses owner occupied (%)
Houses owner occupied (% change since 2000)
Houses renter occupied (%)
Houses renter occupied (% change since 2000)
Vacant housing units - For rent (%)
Vacant housing units - For rent (% change since 2000)
Vacant housing units - For sale only (%)
Vacant housing units - For sale only (% change since 2000)
Vacant housing units - Rented or sold, not occupied (%)
Vacant housing units - Rented or sold, not occupied (% change since 2000)
Vacant housing units - For seasonal, recreational, or occasional use (%)
Vacant housing units - For seasonal, recreational, or occasional use (% change since 2000)
Vacant housing units - For migrant workers (%)
Vacant housing units - For migrant workers (% change since 2000)
Vacant housing units - Other vacant (%)
Vacant housing units - Other vacant (% change since 2000)
Median monthly housing costs ($)
Median household income for houses/condos with a mortgage ($)
Median household income for houses/condos without a mortgage ($)
Median household income ($)
Median household income ($) - White
Median household income ($) - Black or African American
Median household income ($) - Asian
Median household income ($) - Hispanic or Latino
Median household income ($) - American Indian and Alaska Native
Median household income ($) - Multirace
Median household income ($) - Other Race
Mortgage status - with mortgage (%)
Mortgage status - with second mortgage (%)
Mortgage status - with home equity loan (%)
Mortgage status - with both second mortgage and home equity loan (%)
Mortgage status - without a mortgage (%)
Median year house/condo built
Median year apartment built
Household type by relationship - Male householder living alone (%)
Household type by relationship - Male householder not living alone (%)
Household type by relationship - Female householder living alone (%)
Household type by relationship - Female householder not living alone (%)
Household type by relationship - Opposite-Sex spouse (%)
Household type by relationship - Same-Sex spouse (%)
Household type by relationship - Opposite-Sex unmarried partner (%)
Household type by relationship - Same-Sex unmarried partner (%)
Household type by relationship - In group quarters (%)
Size of family households - 2-person household (%)
Size of family households - 3-person household (%)
Size of family households - 4-person household (%)
Size of family households - 5-person household (%)
Size of family households - 6-person household (%)
Size of family households - 7-or-more-person household (%)
Size of nonfamily households - 1-person household (%)
Size of nonfamily households - 2-person household (%)
Size of nonfamily households - 3-person household (%)
Size of nonfamily households - 4-person household (%)
Size of nonfamily households - 5-person household (%)
Size of nonfamily households - 6-person household (%)
Size of nonfamily households - 7-or-moreperson household (%)
Year house built - Built 2010 or later (%)
Year house built - Built 2000 to 2009 (%)
Year house built - Built 1990 to 1999 (%)
Year house built - Built 1980 to 1989 (%)
Year house built - Built 1970 to 1979 (%)
Year house built - Built 1960 to 1969 (%)
Year house built - Built 1950 to 1959 (%)
Year house built - Built 1940 to 1949 (%)
Year house built - Built 1939 or earlier (%)
Median number of rooms in houses and condos
Median number of rooms in apartments
Median number of bedrooms in owner occupied houses
Mean number of bedrooms in owner occupied houses
Median number of bedrooms in renter occupied houses
Mean number of bedrooms in renter occupied houses
Median number of vehichles in owner occupied houses
Mean number of vehichles in owner occupied houses
Median number of vehichles in renter occupied houses
Mean number of vehichles in renter occupied houses
Rooms in owner-occupied houses - 1 room (%)
Rooms in owner-occupied houses - 2 rooms (%)
Rooms in owner-occupied houses - 3 rooms (%)
Rooms in owner-occupied houses - 4 rooms (%)
Rooms in owner-occupied houses - 5 rooms (%)
Rooms in owner-occupied houses - 6 rooms (%)
Rooms in owner-occupied houses - 7 rooms (%)
Rooms in owner-occupied houses - 8 rooms (%)
Rooms in owner-occupied houses - 9+ rooms (%)
Rooms in renter-occupied houses - 1 room (%)
Rooms in renter-occupied houses - 2 rooms (%)
Rooms in renter-occupied houses - 3 rooms (%)
Rooms in renter-occupied houses - 4 rooms (%)
Rooms in renter-occupied houses - 5 rooms (%)
Rooms in renter-occupied houses - 6 rooms (%)
Rooms in renter-occupied houses - 7 rooms (%)
Rooms in renter-occupied houses - 8 rooms (%)
Rooms in renter-occupied houses - 9+ rooms (%)
Bedrooms in owner-occupied houses - no bedrooms (%)
Bedrooms in owner-occupied houses - 1 bedroom (%)
Bedrooms in owner-occupied houses - 2 bedrooms (%)
Bedrooms in owner-occupied houses - 3 bedrooms (%)
Bedrooms in owner-occupied houses - 4 bedrooms (%)
Bedrooms in owner-occupied houses - 5+ bedrooms (%)
Bedrooms in renter-occupied houses - no bedrooms (%)
Bedrooms in renter-occupied houses - 1 bedroom (%)
Bedrooms in renter-occupied houses - 2 bedrooms (%)
Bedrooms in renter-occupied houses - 3 bedrooms (%)
Bedrooms in renter-occupied houses - 4 bedrooms (%)
Bedrooms in renter-occupied houses - 5+ bedrooms (%)
Vehicles available in owner-occupied houses - no vehicle available (%)
Vehicles available in owner-occupied houses - 1 vehicle available(%)
Vehicles available in owner-occupied houses - 2 Vehicles available (%)
Vehicles available in owner-occupied houses - 3 Vehicles available (%)
Vehicles available in owner-occupied houses - 4 Vehicles available (%)
Vehicles available in owner-occupied houses - 5+ Vehicles available (%)
Vehicles available in renter-occupied houses - no vehicle available (%)
Vehicles available in renter-occupied houses - 1 vehicle available (%)
Vehicles available in renter-occupied houses - 2 Vehicles available (%)
Vehicles available in renter-occupied houses - 3 Vehicles available (%)
Vehicles available in renter-occupied houses - 4 Vehicles available (%)
Vehicles available in renter-occupied houses - 5+ Vehicles available (%)
Housing units in structures - 1, detached (%)
Housing units in structures - 1, attached (%)
Housing units in structures - 2 (%)
Housing units in structures - 3 or 4 (%)
Housing units in structures - 5 to 9 (%)
Housing units in structures - 10 to 19 (%)
Housing units in structures - 20 to 49 (%)
Housing units in structures - 50 or more (%)
Housing units in structures - Mobile home (%)
Housing units in structures - Boat, RV, van, etc. (%)
Housing units in structures - Owners - 1, detached (%)
Housing units in structures - Owners - 1, attached (%)
Housing units in structures - Owners - 2 (%)
Housing units in structures - Owners - 3 or 4 (%)
Housing units in structures - Owners - 5 to 9 (%)
Housing units in structures - Owners - 10 to 19 (%)
Housing units in structures - Owners - 20 to 49 (%)
Housing units in structures - Owners - 50 or more (%)
Housing units in structures - Owners - Mobile home (%)
Housing units in structures - Owners - Boat, RV, van, etc. (%)
Housing units in structures - Renters - 1, detached (%)
Housing units in structures - Renters - 1, attached (%)
Housing units in structures - Renters - 2 (%)
Housing units in structures - Renters - 3 or 4 (%)
Housing units in structures - Renters - 5 to 9 (%)
Housing units in structures - Renters - 10 to 19 (%)
Housing units in structures - Renters - 20 to 49 (%)
Housing units in structures - Renters - 50 or more (%)
Housing units in structures - Renters - Mobile home (%)
Housing units in structures - Renters - Boat, RV, van, etc. (%)
House/condo owner moved in on average (years ago)
Renter moved in on average (years ago)
Year householder moved into unit - Moved in 1999 to March 2000 (%)
Year householder moved into unit - Moved in 1999 to March 2000 (%) - White
Year householder moved into unit - Moved in 1999 to March 2000 (%) - Black or African American
Year householder moved into unit - Moved in 1999 to March 2000 (%) - Asian
Year householder moved into unit - Moved in 1999 to March 2000 (%) - Hispanic or Latino
Year householder moved into unit - Moved in 1999 to March 2000 (%) - American Indian and Alaska Native
Year householder moved into unit - Moved in 1999 to March 2000 (%) - Multirace
Year householder moved into unit - Moved in 1999 to March 2000 (%) - Other Race
Year householder moved into unit - Moved in 1995 to 1998 (%)
Year householder moved into unit - Moved in 1995 to 1998 (%) - White
Year householder moved into unit - Moved in 1995 to 1998 (%) - Black or African American
Year householder moved into unit - Moved in 1995 to 1998 (%) - Asian
Year householder moved into unit - Moved in 1995 to 1998 (%) - Hispanic or Latino
Year householder moved into unit - Moved in 1995 to 1998 (%) - American Indian and Alaska Native
Year householder moved into unit - Moved in 1995 to 1998 (%) - Multirace
Year householder moved into unit - Moved in 1995 to 1998 (%) - Other Race
Year householder moved into unit - Moved in 1990 to 1994 (%)
Year householder moved into unit - Moved in 1990 to 1994 (%) - White
Year householder moved into unit - Moved in 1990 to 1994 (%) - Black or African American
Year householder moved into unit - Moved in 1990 to 1994 (%) - Asian
Year householder moved into unit - Moved in 1990 to 1994 (%) - Hispanic or Latino
Year householder moved into unit - Moved in 1990 to 1994 (%) - American Indian and Alaska Native
Year householder moved into unit - Moved in 1990 to 1994 (%) - Multirace
Year householder moved into unit - Moved in 1990 to 1994 (%) - Other Race
Year householder moved into unit - Moved in 1980 to 1989 (%)
Year householder moved into unit - Moved in 1980 to 1989 (%) - White
Year householder moved into unit - Moved in 1980 to 1989 (%) - Black or African American
Year householder moved into unit - Moved in 1980 to 1989 (%) - Asian
Year householder moved into unit - Moved in 1980 to 1989 (%) - Hispanic or Latino
Year householder moved into unit - Moved in 1980 to 1989 (%) - American Indian and Alaska Native
Year householder moved into unit - Moved in 1980 to 1989 (%) - Multirace
Year householder moved into unit - Moved in 1980 to 1989 (%) - Other Race
Year householder moved into unit - Moved in 1970 to 1979 (%)
Year householder moved into unit - Moved in 1970 to 1979 (%) - White
Year householder moved into unit - Moved in 1970 to 1979 (%) - Black or African American
Year householder moved into unit - Moved in 1970 to 1979 (%) - Asian
Year householder moved into unit - Moved in 1970 to 1979 (%) - Hispanic or Latino
Year householder moved into unit - Moved in 1970 to 1979 (%) - American Indian and Alaska Native
Year householder moved into unit - Moved in 1970 to 1979 (%) - Multirace
Year householder moved into unit - Moved in 1970 to 1979 (%) - Other Race
Year householder moved into unit - Moved in 1969 or earlier (%)
Year householder moved into unit - Moved in 1969 or earlier (%) - White
Year householder moved into unit - Moved in 1969 or earlier (%) - Black or African American
Year householder moved into unit - Moved in 1969 or earlier (%) - Asian
Year householder moved into unit - Moved in 1969 or earlier (%) - Hispanic or Latino
Year householder moved into unit - Moved in 1969 or earlier (%) - American Indian and Alaska Native
Year householder moved into unit - Moved in 1969 or earlier (%) - Multirace
Year householder moved into unit - Moved in 1969 or earlier (%) - Other Race
Housing units lacking complete plumbing facilities (%)
Housing units lacking complete kitchen facilities (%)
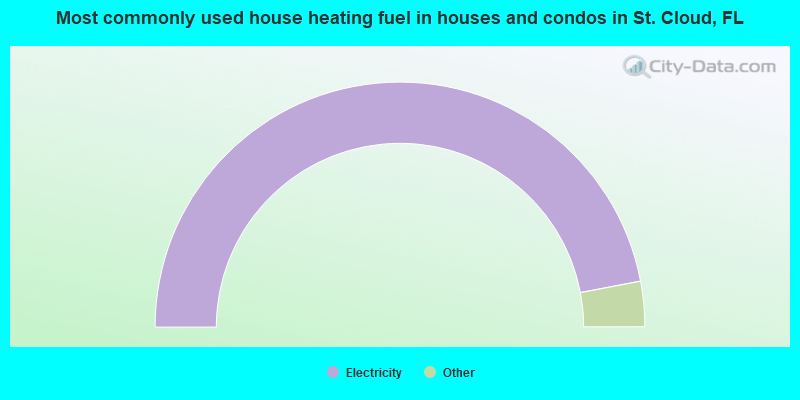
House heating fuel used in houses and condos - Utility gas (%)
House heating fuel used in houses and condos - Bottled, tank, or LP gas (%)
House heating fuel used in houses and condos - Electricity (%)
House heating fuel used in houses and condos - Fuel oil, kerosene, etc. (%)
House heating fuel used in houses and condos - Coal or coke (%)
House heating fuel used in houses and condos - Wood (%)
House heating fuel used in houses and condos - Solar energy (%)
House heating fuel used in houses and condos - Other fuel (%)
House heating fuel used in houses and condos - No fuel used (%)
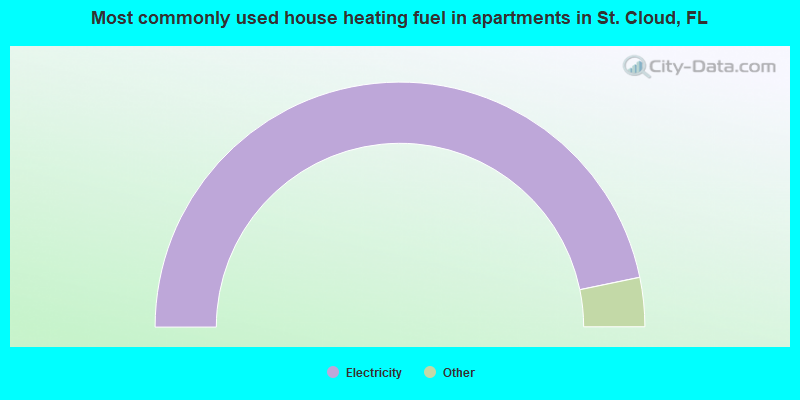
House heating fuel used in apartments - Utility gas (%)
House heating fuel used in apartments - Bottled, tank, or LP gas (%)
House heating fuel used in apartments - Electricity (%)
House heating fuel used in apartments - Fuel oil, kerosene, etc. (%)
House heating fuel used in apartments - Coal or coke (%)
House heating fuel used in apartments - Wood (%)
House heating fuel used in apartments - Solar energy (%)
House heating fuel used in apartments - Other fuel (%)
House heating fuel used in apartments - No fuel used (%)
Median year house/condo built: 2005Median year apartment built: 1996Household type by relationship:
Households: 64,228
Male householders: 9,400 (1,662 living alone ), Female householders: 9,747 (2,392 living alone )9,460 spouses (9,355 opposite-sex spouses ), 1,736 unmarried partners , (1,691 opposite-sex unmarried partners ), 23,262 children (21,251 natural , 613 adopted , 1,397 stepchildren ), 1,826 grandchildren , 1,024 brothers or sisters , 2,302 parents , 22 foster children , 2,693 other relatives , 2,005 non-relatives In group quarters: 744
Size of family households: 4,499 2-persons , 5,105 3-persons , 3,502 4-persons , 1,333 5-persons , 858 6-persons , 565 7-or-more-persons .
Size of nonfamily households: 5,433 1-person , 1,170 2-persons , 61 3-persons , 94 4-persons .
10,941 married couples with children. single-parent households (936 men , 3,138 women ).
57.7% of residents of St. Cloud speak English at home. of residents speak Spanish at home (65% speak English very well , 19% speak English well , 12% speak English not well , 4% don't speak English at all ).of residents speak other Indo-European language at home (68% speak English very well , 16% speak English well , 16% speak English not well ).of residents speak Asian or Pacific Island language at home (42% speak English very well , 36% speak English well , 22% speak English not well ).of residents speak other language at home (35% speak English well , 54% speak English not well , 11% don't speak English at all ).
Foreign born population: 8,854 (13.8%)of them are naturalized citizens )
Median number of rooms in houses and condos:
Median number of rooms in apartments
Owner-occupied Renter-occupied
Rooms in owner-occupied houses in St. Cloud, Florida
53 1 room 71 2 rooms 227 3 rooms 1,388 4 rooms 3,525 5 rooms 4,361 6 rooms 2,984 7 rooms 1,740 8 rooms 1,689 9+ rooms
Rooms in renter-occupied apartments in St. Cloud, Florida
249 1 room 84 2 rooms 406 3 rooms 1,397 4 rooms 1,353 5 rooms 1,319 6 rooms 886 7 rooms 625 8 rooms 223 9+ rooms
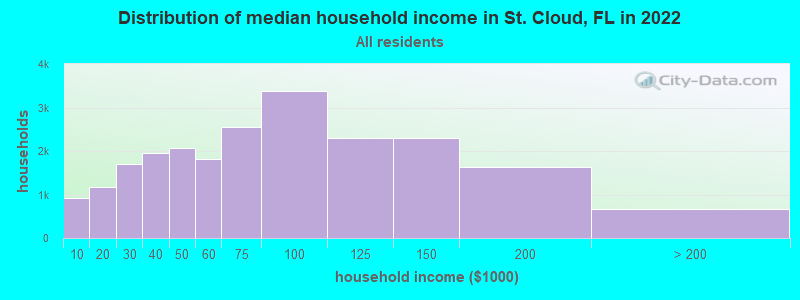
St. Cloud, FL household income distribution 920 Less than $10,0001,176 $10,000 to $19,9991,690 $20,000 to $29,9991,944 $30,000 to $39,9992,072 $40,000 to $49,9991,817 $50,000 to $59,9992,544 $60,000 to $74,9993,388 $75,000 to $99,9992,299 $100,000 to $124,9992,295 $125,000 to $149,9991,637 $150,000 to $199,999656 $200,000 or more
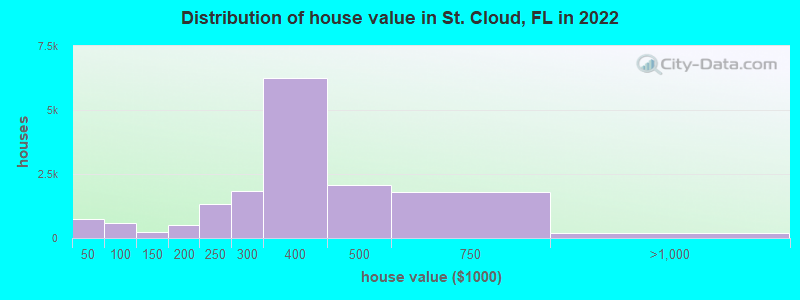
Home value of owner - occupied houses in 2022 in St. Cloud, FL 272 Less than $10,00045 $10,000 to $14,99994 $15,000 to $19,99979 $20,000 to $24,999125 $25,000 to $29,99939 $30,000 to $34,99949 $35,000 to $39,99946 $40,000 to $49,99997 $50,000 to $59,99920 $60,000 to $69,999152 $70,000 to $79,999210 $80,000 to $89,99950 $90,000 to $99,999132 $100,000 to $124,99996 $125,000 to $149,999253 $150,000 to $174,999250 $175,000 to $199,9991,344 $200,000 to $249,9991,851 $250,000 to $299,9996,247 $300,000 to $399,9992,057 $400,000 to $499,9991,787 $500,000 to $749,999146 $750,000 to $999,99954 $1,000,000 to $1,499,999Rent paid by renters in 2022 in St. Cloud, FL 17 $100 to $14964 $150 to $19979 $350 to $39977 $400 to $44995 $450 to $49924 $500 to $54964 $550 to $59951 $600 to $64926 $650 to $69927 $700 to $749115 $750 to $799305 $800 to $899192 $900 to $9991,132 $1,000 to $1,249769 $1,250 to $1,4991,266 $1,500 to $1,999648 $2,000 to $2,49997 $2,500 to $2,999270 No cash rent
Percentage of workers working in this county: 55.2%Number of people working at home: 3,694 (13.2% of all workers )
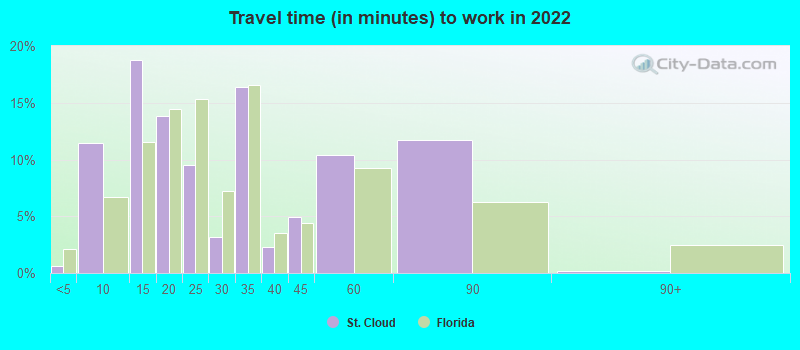
Travel time to work (commute)
Less than 5 minutes: 805 to 9 minutes: 1,54310 to 14 minutes: 2,07915 to 19 minutes: 1,76720 to 24 minutes: 1,62725 to 29 minutes: 1,29230 to 34 minutes: 3,74135 to 39 minutes: 95840 to 44 minutes: 1,70645 to 59 minutes: 5,62160 to 89 minutes: 2,94990 or more minutes: 752
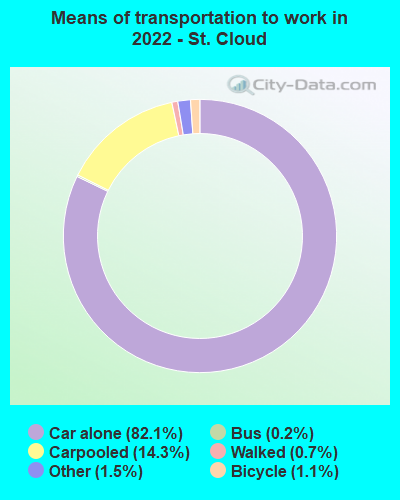
Means of transportation to work:
Drove a car alone: 11,334 (66.9%)Carpooled: 2,104 (12.4%)Bus : 27 (0.2%)Taxi: 235 (1.4%)Bicycle: 160 (0.9%)Walked: 108 (0.6%)Worked at home: 3,079 (18.2%)
Unemployment by race in 2022
Unemployment rate for White non-Hispanic residents 6.1% Males2.4% FemalesUnemployment rate for Black residents 0.5% Males8.0% FemalesUnemployment rate for American Indian and Alaska Native residents 7.4% FemalesUnemployment rate for Asian residents 1.2% Males3.7% FemalesUnemployment rate for other race residents 9.1% Males1.5% FemalesUnemployment rate for two or more race residents 14.3% Males4.1% FemalesUnemployment rate for Hispanic or Latino residents 5.7% Males1.6% Females
Year of entry for the foreign-born population in St. Cloud, Florida
2,884 2010 or later 1,355 2000 to 2009 1,814 1990 to 1999 276 1980 to 1989 154 1970 to 1979 421 Before 1970
First ancestries reported:
Irish: 2,241 (7.8%)
American: 2,144 (7.5%)
English: 1,220 (4.3%)
German: 1,192 (4.2%)
Italian: 794 (2.8%)
French: 308 (1.1%)
Polish: 299 (1.0%)
Trinidadian and Tobagonian: 287 (1.0%)
Scottish: 241 (0.8%)
Portuguese: 186 (0.6%)
Jamaican: 141 (0.5%)
British: 132 (0.5%)
Ukrainian: 125 (0.4%)
Dutch: 123 (0.4%)
Russian: 97 (0.3%)
Norwegian: 93 (0.3%)
Romanian: 86 (0.3%)
Guyanese: 83 (0.3%)
Haitian: 83 (0.3%)
Bulgarian: 71 (0.2%)
European: 64 (0.2%)
Kenyan: 57 (0.2%)
Brazilian: 55 (0.2%)
Greek: 48 (0.2%)
Hungarian: 47 (0.2%)
West Indian: 45 (0.2%)
Welsh: 38 (0.1%)
Eastern European: 31 (0.1%)
Moroccan: 30 (0.1%)
Belgian: 27 (0.09%)
French Canadian: 23 (0.08%)
Scotch-Irish: 21 (0.07%)
Armenian: 19 (0.07%)
Palestinian: 19 (0.07%)
Croatian: 17 (0.06%)
Austrian: 14 (0.05%)
Turkish: 13 (0.05%)
Slovak: 12 (0.04%)
Iranian: 11 (0.04%)
Northern European: 9 (0.03%)
African: 2 (0.01%) Most common places of birth for foreign-born residents (%): Dominican Republic St. Cloud:
27.5% (2,199)Florida:
3.0% (137,727)
Colombia St. Cloud:
8.4% (675)Florida:
6.5% (298,669)
Panama St. Cloud:
6.4% (515)Florida:
0.5% (22,972)
Venezuela St. Cloud:
4.0% (319)Florida:
5.7% (262,042)
Brazil St. Cloud:
4.0% (316)Florida:
2.7% (122,906)
Honduras St. Cloud:
3.9% (314)Florida:
2.3% (107,160)
Jamaica St. Cloud:
3.8% (303)Florida:
5.0% (227,319)
Trinidad and Tobago St. Cloud:
3.2% (253)Florida:
1.0% (43,642)
Peru St. Cloud:
3.2% (252)Florida:
2.1% (96,693)
Guyana St. Cloud:
2.9% (232)Florida:
0.7% (33,556)
Grenada St. Cloud:
2.7% (217)Florida:
0.1% (3,183)
Cuba St. Cloud:
2.5% (198)Florida:
22.0% (1,006,576)
Philippines St. Cloud:
2.1% (164)Florida:
1.8% (84,403)
Mexico St. Cloud:
2.0% (157)Florida:
5.6% (257,152)
Bolivia St. Cloud:
1.9% (154)Florida:
0.2% (10,861)
Ukraine St. Cloud:
1.7% (134)Florida:
0.5% (21,886)
Ecuador St. Cloud:
1.6% (131)Florida:
1.2% (54,585)
Chile St. Cloud:
1.6% (129)Florida:
0.5% (22,715)
Haiti St. Cloud:
1.6% (128)Florida:
7.5% (342,375)
Place of birth for U.S.-born residents:
This state: 20,548Other state: 26,107Northeast: 13,551Midwest: 7,066South: 4,084West: 1,491 85.1% of St. Cloud residents lived in the same house 1 years ago.
Out of people who lived in different houses, 24.2% lived in this county.
Out of people who lived in different counties, 60.1% lived in Florida.
St. Cloud:
85.1%State average:
86.3%
Education attainment for males 25 years and older:
No schooling: 197Nursery to 4th grade: 675th and 6th grade: 787th and 8th grade: 4709th grade: 37710th grade: 24611th grade: 16112th grade, no diploma: 552High school graduate (or equivalency): 7,002Less than 1 year of college: 1,338Some college more than 1 year, no degree: 2,668Associate degree: 2,318Bachelor's degree: 4,481Master's degree: 677Professional school degree: 184Doctorate degree: 125
Education attainment for females 25 years and older:
No schooling: 244Nursery to 4th grade: 405th and 6th grade: 327th and 8th grade: 489th grade: 16210th grade: 19711th grade: 21012th grade, no diploma: 397High school graduate (or equivalency): 6,158Less than 1 year of college: 1,704Some college more than 1 year, no degree: 2,347Associate degree: 3,245Bachelor's degree: 4,774Master's degree: 1,705Professional school degree: 60Doctorate degree: 158
Housing units in structures:
One, detached: 15,833One, attached: 2,396Two: 8143 or 4: 6805 to 9: 59710 to 19: 43320 to 49: 24450 or more: 107Mobile homes: 1,822Boats, RVs, vans, etc.: 13Median worth of mobile homes: $92,972
Housing units lacking complete plumbing facilities in 2022: 0.3%Housing units lacking complete kitchen facilities in 2022: 1.1%House/condo owner moved in on average 4 years ago
Renter moved in on average 4 years ago
Private vs. public school enrollment:
Students in private schools in grades 1 to 8 (elementary and middle school): 1,032 Students in private schools in grades 9 to 12 (high school): 218 Students in private undergraduate colleges: 476