Races in St. Cloud, Florida (FL) Detailed Stats
Data:
Races - White alone (%)
Races - White alone (% change since 2000)
Races - Black alone (%)
Races - Black alone (% change since 2000)
Races - American Indian alone (%)
Races - American Indian alone (% change since 2000)
Races - Asian alone (%)
Races - Asian alone (% change since 2000)
Races - Hispanic (%)
Races - Hispanic (% change since 2000)
Races - Native Hawaiian and Other Pacific Islander alone (%)
Races - Native Hawaiian and Other Pacific Islander alone (% change since 2000)
Races - Two or more races(%)
Races - Two or more races(% change since 2000)
Races - Other race alone (%)
Races - Other race alone (% change since 2000)
Racial diversity
Place of birth - Born in state of residence (%)
Place of birth - Born in state of residence (%) - White
Place of birth - Born in state of residence (%) - Black or African American
Place of birth - Born in state of residence (%) - Asian
Place of birth - Born in state of residence (%) - Hispanic or Latino
Place of birth - Born in state of residence (%) - American Indian and Alaska Native
Place of birth - Born in state of residence (%) - Multirace
Place of birth - Born in state of residence (%) - Other Race
Place of birth - Born in other state (%)
Place of birth - Born in other state (%) - White
Place of birth - Born in other state (%) - Black or African American
Place of birth - Born in other state (%) - Asian
Place of birth - Born in other state (%) - Hispanic or Latino
Place of birth - Born in other state (%) - American Indian and Alaska Native
Place of birth - Born in other state (%) - Multirace
Place of birth - Born in other state (%) - Other Race
Place of birth - Native, outside of US (%)
Place of birth - Native, outside of US (%) - White
Place of birth - Native, outside of US (%) - Black or African American
Place of birth - Native, outside of US (%) - Asian
Place of birth - Native, outside of US (%) - Hispanic or Latino
Place of birth - Native, outside of US (%) - American Indian and Alaska Native
Place of birth - Native, outside of US (%) - Multirace
Place of birth - Native, outside of US (%) - Other Race
Place of birth - Foreign born (%)
Place of birth - Foreign born (%) - White
Place of birth - Foreign born (%) - Black or African American
Place of birth - Foreign born (%) - Asian
Place of birth - Foreign born (%) - Hispanic or Latino
Place of birth - Foreign born (%) - American Indian and Alaska Native
Place of birth - Foreign born (%) - Multirace
Place of birth - Foreign born (%) - Other Race
Residents speaking English at home (%)
Residents speaking English at home - Born in the United States (%)
Residents speaking English at home - Native, born elsewhere (%)
Residents speaking English at home - Foreign born (%)
Residents speaking Spanish at home (%)
Residents speaking Spanish at home - Born in the United States (%)
Residents speaking Spanish at home - Native, born elsewhere (%)
Residents speaking Spanish at home - Foreign born (%)
Residents speaking other language at home (%)
Residents speaking other language at home - Born in the United States (%)
Residents speaking other language at home - Native, born elsewhere (%)
Residents speaking other language at home - Foreign born (%)
Marital status - Never married (%)
Marital status - Now married (%)
Marital status - Separated (%)
Marital status - Widowed (%)
Marital status - Divorced (%)
Ancestries Reported - Arab (%)
Ancestries Reported - Czech (%)
Ancestries Reported - Danish (%)
Ancestries Reported - Dutch (%)
Ancestries Reported - English (%)
Ancestries Reported - French (%)
Ancestries Reported - French Canadian (%)
Ancestries Reported - German (%)
Ancestries Reported - Greek (%)
Ancestries Reported - Hungarian (%)
Ancestries Reported - Irish (%)
Ancestries Reported - Italian (%)
Ancestries Reported - Lithuanian (%)
Ancestries Reported - Norwegian (%)
Ancestries Reported - Polish (%)
Ancestries Reported - Portuguese (%)
Ancestries Reported - Russian (%)
Ancestries Reported - Scotch-Irish (%)
Ancestries Reported - Scottish (%)
Ancestries Reported - Slovak (%)
Ancestries Reported - Subsaharan African (%)
Ancestries Reported - Swedish (%)
Ancestries Reported - Swiss (%)
Ancestries Reported - Ukrainian (%)
Ancestries Reported - United States (%)
Ancestries Reported - Welsh (%)
Ancestries Reported - West Indian (%)
Ancestries Reported - Other (%)
Geographical mobility - Same house 1 year ago (%)
Geographical mobility - Same house 1 year ago (%) - White
Geographical mobility - Same house 1 year ago (%) - Black or African American
Geographical mobility - Same house 1 year ago (%) - Asian
Geographical mobility - Same house 1 year ago (%) - Hispanic or Latino
Geographical mobility - Same house 1 year ago (%) - American Indian and Alaska Native
Geographical mobility - Same house 1 year ago (%) - Multirace
Geographical mobility - Same house 1 year ago (%) - Other Race
Geographical mobility - Moved within same county (%)
Geographical mobility - Moved within same county (%) - White
Geographical mobility - Moved within same county (%) - Black or African American
Geographical mobility - Moved within same county (%) - Asian
Geographical mobility - Moved within same county (%) - Hispanic or Latino
Geographical mobility - Moved within same county (%) - American Indian and Alaska Native
Geographical mobility - Moved within same county (%) - Multirace
Geographical mobility - Moved within same county (%) - Other Race
Geographical mobility - Moved from different county within same state (%)
Geographical mobility - Moved from different county within same state (%) - White
Geographical mobility - Moved from different county within same state (%) - Black or African American
Geographical mobility - Moved from different county within same state (%) - Asian
Geographical mobility - Moved from different county within same state (%) - Hispanic or Latino
Geographical mobility - Moved from different county within same state (%) - American Indian and Alaska Native
Geographical mobility - Moved from different county within same state (%) - Multirace
Geographical mobility - Moved from different county within same state (%) - Other Race
Geographical mobility - Moved from different state (%)
Geographical mobility - Moved from different state (%) - White
Geographical mobility - Moved from different state (%) - Black or African American
Geographical mobility - Moved from different state (%) - Asian
Geographical mobility - Moved from different state (%) - Hispanic or Latino
Geographical mobility - Moved from different state (%) - American Indian and Alaska Native
Geographical mobility - Moved from different state (%) - Multirace
Geographical mobility - Moved from different state (%) - Other Race
Geographical mobility - Moved from abroad (%)
Geographical mobility - Moved from abroad (%) - White
Geographical mobility - Moved from abroad (%) - Black or African American
Geographical mobility - Moved from abroad (%) - Asian
Geographical mobility - Moved from abroad (%) - Hispanic or Latino
Geographical mobility - Moved from abroad (%) - American Indian and Alaska Native
Geographical mobility - Moved from abroad (%) - Multirace
Geographical mobility - Moved from abroad (%) - Other Race
Place of birth for the foreign-born population - Ireland (%)
Place of birth for the foreign-born population - Denmark (%)
Place of birth for the foreign-born population - Norway (%)
Place of birth for the foreign-born population - Sweden (%)
Place of birth for the foreign-born population - United Kingdom (%)
Place of birth for the foreign-born population - England (%)
Place of birth for the foreign-born population - Scotland (%)
Place of birth for the foreign-born population - Other Northern Europe (%)
Place of birth for the foreign-born population - Austria (%)
Place of birth for the foreign-born population - Belgium (%)
Place of birth for the foreign-born population - France (%)
Place of birth for the foreign-born population - Germany (%)
Place of birth for the foreign-born population - Netherlands (%)
Place of birth for the foreign-born population - Switzerland (%)
Place of birth for the foreign-born population - Other Western Europe (%)
Place of birth for the foreign-born population - Greece (%)
Place of birth for the foreign-born population - Italy (%)
Place of birth for the foreign-born population - Portugal (%)
Place of birth for the foreign-born population - Spain (%)
Place of birth for the foreign-born population - Other Southern Europe (%)
Place of birth for the foreign-born population - Albania (%)
Place of birth for the foreign-born population - Belarus (%)
Place of birth for the foreign-born population - Bosnia and Herzegovina (%)
Place of birth for the foreign-born population - Bulgaria (%)
Place of birth for the foreign-born population - Croatia (%)
Place of birth for the foreign-born population - Czechoslovakia (%)
Place of birth for the foreign-born population - Hungary (%)
Place of birth for the foreign-born population - Latvia (%)
Place of birth for the foreign-born population - Lithuania (%)
Place of birth for the foreign-born population - North Macedonia (Macedonia) (%)
Place of birth for the foreign-born population - Moldova (%)
Place of birth for the foreign-born population - Poland (%)
Place of birth for the foreign-born population - Romania (%)
Place of birth for the foreign-born population - Russia (%)
Place of birth for the foreign-born population - Serbia (%)
Place of birth for the foreign-born population - Ukraine (%)
Place of birth for the foreign-born population - Other Eastern Europe (%)
Place of birth for the foreign-born population - China (%)
Place of birth for the foreign-born population - Hong Kong (%)
Place of birth for the foreign-born population - Taiwan (%)
Place of birth for the foreign-born population - Japan (%)
Place of birth for the foreign-born population - Korea (%)
Place of birth for the foreign-born population - Other Eastern Asia (%)
Place of birth for the foreign-born population - Afghanistan (%)
Place of birth for the foreign-born population - Bangladesh (%)
Place of birth for the foreign-born population - India (%)
Place of birth for the foreign-born population - Iran (%)
Place of birth for the foreign-born population - Kazakhstan (%)
Place of birth for the foreign-born population - Nepal (%)
Place of birth for the foreign-born population - Pakistan (%)
Place of birth for the foreign-born population - Sri Lanka (%)
Place of birth for the foreign-born population - Uzbekistan (%)
Place of birth for the foreign-born population - Other South Central Asia (%)
Place of birth for the foreign-born population - Burma (%)
Place of birth for the foreign-born population - Cambodia (%)
Place of birth for the foreign-born population - Indonesia (%)
Place of birth for the foreign-born population - Laos (%)
Place of birth for the foreign-born population - Malaysia (%)
Place of birth for the foreign-born population - Philippines (%)
Place of birth for the foreign-born population - Singapore (%)
Place of birth for the foreign-born population - Thailand (%)
Place of birth for the foreign-born population - Vietnam (%)
Place of birth for the foreign-born population - Other South Eastern Asia (%)
Place of birth for the foreign-born population - Armenia (%)
Place of birth for the foreign-born population - Iraq (%)
Place of birth for the foreign-born population - Israel (%)
Place of birth for the foreign-born population - Jordan (%)
Place of birth for the foreign-born population - Kuwait (%)
Place of birth for the foreign-born population - Lebanon (%)
Place of birth for the foreign-born population - Saudi Arabia (%)
Place of birth for the foreign-born population - Syria (%)
Place of birth for the foreign-born population - Turkey (%)
Place of birth for the foreign-born population - Yemen (%)
Place of birth for the foreign-born population - Other Western Asia (%)
Place of birth for the foreign-born population - Eritrea (%)
Place of birth for the foreign-born population - Ethiopia (%)
Place of birth for the foreign-born population - Kenya (%)
Place of birth for the foreign-born population - Somalia (%)
Place of birth for the foreign-born population - Uganda (%)
Place of birth for the foreign-born population - Zimbabwe (%)
Place of birth for the foreign-born population - Other Eastern Africa (%)
Place of birth for the foreign-born population - Cameroon (%)
Place of birth for the foreign-born population - Congo (%)
Place of birth for the foreign-born population - Democratic Republic of Congo (Zaire) (%)
Place of birth for the foreign-born population - Other Middle Africa (%)
Place of birth for the foreign-born population - Egypt (%)
Place of birth for the foreign-born population - Morocco (%)
Place of birth for the foreign-born population - Sudan (%)
Place of birth for the foreign-born population - Other Northern Africa (%)
Place of birth for the foreign-born population - South Africa (%)
Place of birth for the foreign-born population - Other Southern Africa (%)
Place of birth for the foreign-born population - Cabo Verde (%)
Place of birth for the foreign-born population - Ghana (%)
Place of birth for the foreign-born population - Liberia (%)
Place of birth for the foreign-born population - Nigeria (%)
Place of birth for the foreign-born population - Senegal (%)
Place of birth for the foreign-born population - Sierra Leone (%)
Place of birth for the foreign-born population - Other Western Africa (%)
Place of birth for the foreign-born population - Australia (%)
Place of birth for the foreign-born population - New Zealand (%)
Place of birth for the foreign-born population - Fiji (%)
Place of birth for the foreign-born population - Micronesia (%)
Place of birth for the foreign-born population - Bahamas (%)
Place of birth for the foreign-born population - Barbados (%)
Place of birth for the foreign-born population - Cuba (%)
Place of birth for the foreign-born population - Dominica (%)
Place of birth for the foreign-born population - Dominican Republic (%)
Place of birth for the foreign-born population - Grenada (%)
Place of birth for the foreign-born population - Haiti (%)
Place of birth for the foreign-born population - Jamaica (%)
Place of birth for the foreign-born population - St. Vincent and the Grenadines (%)
Place of birth for the foreign-born population - Trinidad and Tobago (%)
Place of birth for the foreign-born population - West Indies (%)
Place of birth for the foreign-born population - Other Caribbean (%)
Place of birth for the foreign-born population - Belize (%)
Place of birth for the foreign-born population - Costa Rica (%)
Place of birth for the foreign-born population - El Salvador (%)
Place of birth for the foreign-born population - Guatemala (%)
Place of birth for the foreign-born population - Honduras (%)
Place of birth for the foreign-born population - Mexico (%)
Place of birth for the foreign-born population - Nicaragua (%)
Place of birth for the foreign-born population - Panama (%)
Place of birth for the foreign-born population - Other Central America (%)
Place of birth for the foreign-born population - Argentina (%)
Place of birth for the foreign-born population - Bolivia (%)
Place of birth for the foreign-born population - Brazil (%)
Place of birth for the foreign-born population - Chile (%)
Place of birth for the foreign-born population - Colombia (%)
Place of birth for the foreign-born population - Ecuador (%)
Place of birth for the foreign-born population - Guyana (%)
Place of birth for the foreign-born population - Peru (%)
Place of birth for the foreign-born population - Uruguay (%)
Place of birth for the foreign-born population - Venezuela (%)
Place of birth for the foreign-born population - Other South America (%)
Place of birth for the foreign-born population - Canada (%)
Place of birth for the foreign-born population - Other Northern America (%)
Place of birth for the foreign-born population - Other (%)
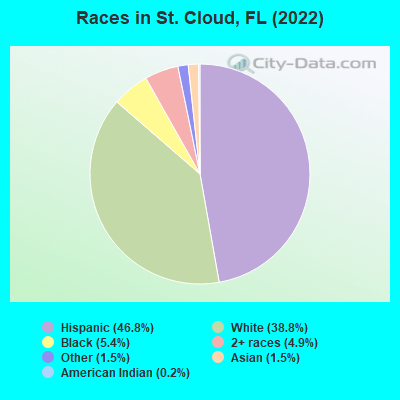
According to 2022 data, the most numerous races in St. Cloud, FL are White alone (24,889 residents), Hispanic (30,073 residents), and Black alone (3,479 residents). 57.7% of St. Cloud residents speak English at home. 12.5% of St. Cloud, FL residents are foreign-born (10.5% born in Latin America), which is 68.7% less than the foreign-born rate of 21.0% across the entire state of Florida.
Race distribution in St. Cloud
2000 2022
10,458,509 65.4% White alone 2,682,715 16.8% Hispanic 2,264,268 14.2% Black alone 261,693 1.6% Asian alone 236,954 1.5% Two or more races 42,358 0.3% American Indian alone 28,994 0.2% Other race alone 6,887 0.04% Native Hawaiian and Other
11,309,403 50.8% White alone 6,025,039 27.1% Hispanic 3,241,015 14.6% Black alone 861,630 3.9% Two or more races 623,692 2.8% Asian alone 152,054 0.7% Other race alone 22,504 0.1% American Indian alone 9,486 0.04% Native Hawaiian and Other
Income and house value in St. Cloud Median household income in 2022 $69,880 White non-Hispanic householders$61,915 Black householdersover $200,000 American Indian and Alaska Native householders$123,016 Asian householders$79,274 Some other race householders$72,153 Two or more races householders$65,951 Hispanic or Latino race householdersMedian 2022 house value $361,934 White Non-Hispanic householders$459,566 Black or African American householders$224,677 American Indian or Alaska Native householders $388,078 Asian householders$406,461 Some other race householders$461,609 Two or more races householders$384,402 Hispanic or Latino householders
Median age by race in St. Cloud
40.1 Median age for White residents39.8 40.2 34.8 Median age for Black or African American residents31.6 36.5 48.6 Median age for American Indian / Alaska Native residents35.6 53.6 34.2 Median age for Asian residents33.7 35.3 42.4 Median age for Native Hawaiian / Pacific Islander residents-858,307,848.3 -666,666,666.0 34.3 Median age for Other race residents37.8 33.1 29.0 Median age for Two or more races residents29.8 29.5 40.4 Median age for White alone residents39.3 43.1 32.3 Median age for Hispanic or Latino residents31.5 32.8
Owner/renter occupied households by race in St. Cloud
House owners and renters - White residents 7,245 73.3% Owner occupied2,641 26.7% Renter occupiedHouse owners and renters - Black or African American residents 1,019 62.2% Owner occupied620 37.8% Renter occupiedHouse owners and renters - American Indian / Alaska Native residents 103 100.0% Owner occupiedHouse owners and renters - Asian residents 279 93.7% Owner occupied19 6.3% Renter occupiedHouse owners and renters - Native Hawaiian / Pacific Islander residents 63 100.0% Renter occupiedHouse owners and renters - Other race residents 3,335 68.0% Owner occupied1,568 32.0% Renter occupiedHouse owners and renters - Two or more races residents 2,894 61.8% Owner occupied1,786 38.2% Renter occupiedHouse owners and renters - White alone residents 6,995 69.0% Owner occupied3,142 31.0% Renter occupiedHouse owners and renters - Hispanic or Latino residents 6,580 68.7% Owner occupied2,994 31.3% Renter occupied
Language usage in St. Cloud
English speakers - Total 57.7% of residents of St. Cloud speak English at home.
39.2% of residents speak Spanish at home 15,144 64.9% Speak English very well8,194 35.1% Speak English less than very well3.0% of residents speak other language at home 1,069 60.4% Speak English very well700 39.6% Speak English less than very well
English speakers - Born in the United States 73.6% of residents of St. Cloud speak English at home.
24.1% of residents speak Spanish at home 4,731 79.4% Speak English very well1,226 20.6% Speak English less than very well1.9% of residents speak other language at home 263 56.7% Speak English very well201 43.3% Speak English less than very well
English speakers - Native, born elsewhere 4.7% of residents of St. Cloud speak English at home.
94.8% of residents speak Spanish at home 4,961 62.6% Speak English very well2,961 37.4% Speak English less than very well
English speakers - Foreign-born 19.9% of residents of St. Cloud speak English at home.
66.5% of residents speak Spanish at home 2,708 45.7% Speak English very well3,222 54.3% Speak English less than very well12.8% of residents speak other language at home 641 56.4% Speak English very well496 43.6% Speak English less than very well
White (Caucasian) - Speak only English Native:
99.3% (21,961)Foreign-born:
26.8% (310)
White (Caucasian) - Speak another language Native:
10.8% (2,377)Foreign-born:
72.5% (836)
Black or African American - Speak only English Native:
68.8% (2,785)Foreign-born:
39.2% (369)
Black or African American - Speak another language Native:
28.7% (1,163)Foreign-born:
58.2% (547)
American Indian / Alaska Native - Speak another language Native:
34.0% (127)Foreign-born:
100.0% (56)
Asian - Speak only English Native:
74.5% (269)Foreign-born:
34.4% (219)
Asian - Speak another language Native:
25.4% (92)Foreign-born:
61.9% (393)
Other race - Speak only English Native:
22.1% (2,529)Foreign-born:
4.5% (146)
Other race - Speak another language Native:
77.4% (8,872)Foreign-born:
92.2% (2,968)
Two or more races - Speak only English Native:
37.2% (3,739)Foreign-born:
20.6% (624)
Two or more races - Speak another language Native:
62.9% (6,325)Foreign-born:
73.3% (2,221)
White alone - Speak only English Native:
98.2% (22,716)Foreign-born:
45.3% (291)
White alone - Speak another language Native:
2.6% (605)Foreign-born:
54.5% (351)
Hispanic or Latino - Speak only English Native:
20.8% (4,312)Foreign-born:
6.2% (388)
Hispanic or Latino - Speak another language Native:
79.2% (16,413)Foreign-born:
93.9% (5,839)
Foreign-born residents in St. Cloud 7,997 residents are foreign born (10.5% Latin America ).
This city:
12.5%Florida:
21.1%
Marital status for residents in St. Cloud Marital status - White (Caucasian) population 15 years and over
Males 32.6% Never married45.9% Now married4.0% Separated4.8% Widowed12.8% DivorcedFemales 27.1% Never married39.9% Now married2.4% Separated9.9% Widowed20.7% DivorcedWomen who gave birth in the past 12 months Now married:
57.9% (166)Unmarried:
42.1% (120)
Women who did not give birth in the past 12 months Now married:
44.6% (2,188)Unmarried:
55.4% (2,721)
Marital status - Black or African American population 15 years and over
Males 39.5% Never married38.5% Now married2.2% Separated7.9% Widowed11.9% DivorcedFemales 30.7% Never married39.8% Now married3.7% Separated15.3% Widowed10.4% DivorcedWomen who gave birth in the past 12 months Now married:
0.0% (0)Unmarried:
100.0% (112)
Women who did not give birth in the past 12 months Now married:
44.1% (457)Unmarried:
55.9% (580)
Marital status - American Indian / Alaska Native population 15 years and over
Males 20.1% Never married79.9% Now married0.0% Separated0.0% Widowed0.0% DivorcedFemales 33.3% Never married57.1% Now married0.0% Separated0.0% Widowed9.6% DivorcedWomen who did not give birth in the past 12 months Now married:
27.8% (33)Unmarried:
72.2% (85)
Marital status - Asian population 15 years and over
Males 23.4% Never married71.5% Now married0.0% Separated5.1% Widowed0.0% DivorcedFemales 45.2% Never married47.4% Now married0.0% Separated3.1% Widowed4.3% DivorcedWomen who gave birth in the past 12 months Now married:
0.0% (0)Unmarried:
100.0% (6)
Women who did not give birth in the past 12 months Now married:
39.2% (154)Unmarried:
60.8% (239)
Marital status - Native Hawaiian / Pacific Islander population 15 years and over
Males 0.0% Never married100.0% Now married0.0% Separated0.0% Widowed0.0% DivorcedFemales 0.0% Never married100.0% Now married0.0% Separated0.0% Widowed0.0% DivorcedWomen who did not give birth in the past 12 months Now married:
100.0% (35)Unmarried:
0.0% (0)
Marital status - Other race population 15 years and over
Males 39.8% Never married52.7% Now married1.9% Separated1.0% Widowed4.6% DivorcedFemales 33.2% Never married49.0% Now married1.4% Separated4.1% Widowed12.3% DivorcedWomen who gave birth in the past 12 months Now married:
69.1% (176)Unmarried:
30.9% (79)
Women who did not give birth in the past 12 months Now married:
43.6% (1,891)Unmarried:
56.4% (2,442)
Marital status - Two or more races population 15 years and over
Males 41.1% Never married45.6% Now married0.5% Separated0.0% Widowed12.8% DivorcedFemales 26.9% Never married36.8% Now married7.3% Separated4.4% Widowed24.6% DivorcedWomen who gave birth in the past 12 months Now married:
29.4% (48)Unmarried:
70.6% (116)
Women who did not give birth in the past 12 months Now married:
42.9% (1,269)Unmarried:
57.1% (1,688)
Marital status - White alone, not Hispanic / Latino population 15 years and over
Males 31.3% Never married45.0% Now married4.8% Separated4.8% Widowed14.2% DivorcedFemales 25.9% Never married41.4% Now married0.6% Separated12.0% Widowed20.1% DivorcedWomen who gave birth in the past 12 months Now married:
27.3% (63)Unmarried:
72.7% (167)
Women who did not give birth in the past 12 months Now married:
45.7% (2,071)Unmarried:
54.3% (2,462)
Marital status - Hispanic or Latino population 15 years and over
Males 41.4% Never married48.8% Now married1.0% Separated2.9% Widowed5.8% DivorcedFemales 32.2% Never married40.3% Now married5.0% Separated4.5% Widowed18.0% DivorcedWomen who gave birth in the past 12 months Now married:
51.7% (232)Unmarried:
48.3% (217)
Women who did not give birth in the past 12 months Now married:
43.5% (3,396)Unmarried:
56.5% (4,411)
Ancestries in St. Cloud
2,241 7.8% Irish2,144 7.5% American1,220 4.3% English1,192 4.2% German794 2.8% Italian308 1.1% French299 1.0% Polish287 1.0% Trinidadian and Tobagonian241 0.8% Scottish186 0.6% Portuguese141 0.5% Jamaican132 0.5% British125 0.4% Ukrainian123 0.4% Dutch97 0.3% Russian93 0.3% Norwegian86 0.3% Romanian83 0.3% Guyanese83 0.3% Haitian71 0.2% Bulgarian64 0.2% European57 0.2% Kenyan55 0.2% Brazilian48 0.2% Greek47 0.2% Hungarian45 0.2% West Indian38 0.1% Welsh31 0.1% Eastern European30 0.1% Moroccan27 0.09% Belgian23 0.08% French Canadian21 0.07% Scotch-Irish19 0.07% Armenian19 0.07% Palestinian17 0.06% Croatian14 0.05% Austrian13 0.05% Turkish12 0.04% Slovak11 0.04% Iranian9 0.03% Northern European2 0.01% African
Geographical mobility in St. Cloud Same house 1 year ago 19,730 82.6% White (Caucasian)4,952 94.5% Black or African American432 90.4% American Indian / Alaska Native1,120 91.0% Asian161 100.0% Native Hawaiian / Pacific Islander14,298 91.0% Other race11,276 77.4% Two or more races20,701 83.3% White alone, not Hispanic / Latino24,693 83.8% Hispanic or LatinoMoved within same county 1,150 4.8% White / Caucasian171 3.3% Black or African American45 3.7% Asian171 1.1% Other race1,415 9.7% Two or more races1,768 7.1% White alone, not Hispanic / Latino994 3.4% Hispanic or LatinoMoved within same state 1,447 6.1% White / Caucasian90 1.7% Black or African American20 4.1% American Indian / Alaska Native67 5.5% Asian612 3.9% Other race1,363 9.4% Two or more races891 3.6% White alone, not Hispanic / Latino2,273 7.7% Hispanic or LatinoMoved from different state 1,507 6.3% White / Caucasian80 1.5% Black or African American342 2.2% Other race158 1.1% Two or more races1,547 6.2% White alone, not Hispanic / Latino727 2.5% Hispanic or LatinoMoved from abroad 351 1.5% White13 0.2% Black or African American47 9.8% American Indian / Alaska Native299 2.1% Two or more races717 2.4% Hispanic or Latino
Children Nativity (place of birth) in St. Cloud
Children under 6 years - Living with two parents Both parents native 3,040 100.0% NativeBoth parents foreign-born 514 100.0% NativeOne native, one foreign-born parent 185 100.0% NativeChildren under 6 years - Living with one parent Native parent 1,172 100.0% NativeForeign-born parent 295 100.0% NativeChildren 6 to 17 years - Living with two parents Both parents native 5,926 100.0% NativeBoth parents foreign-born 640 65.6% Native336 34.4% Foreign-bornOne native, one foreign-born parent 727 100.0% NativeChildren 6 to 17 years - Living with one parent Native parent 3,103 100.0% NativeForeign-born parent 892 49.1% Native926 50.9% Foreign-born
Grandparents responsible for own grandchildren in St. Cloud
Grandparents (30 to 59 years) White / Caucasian 64 25.2% Responsible for grandchildren189 74.8% Not responsible for grandchildrenBlack or African American 17 12.6% Responsible for grandchildren116 87.4% Not responsible for grandchildrenOther race 109 100.0% Not responsible for grandchildrenTwo or more races 154 36.4% Responsible for grandchildren268 63.6% Not responsible for grandchildrenWhite alone, not Hispanic / Latino 87 15.8% Responsible for grandchildren460 84.2% Not responsible for grandchildrenHispanic or Latino 96 32.5% Responsible for grandchildren200 67.5% Not responsible for grandchildrenGrandparents (60 years and over) White / Caucasian 28 16.4% Responsible for grandchildren144 83.6% Not responsible for grandchildrenBlack or African American 79 100.0% Not responsible for grandchildrenOther race 183 100.0% Not responsible for grandchildrenTwo or more races 5 3.4% Responsible for grandchildren127 96.6% Not responsible for grandchildrenWhite alone, not Hispanic / Latino 41 17.8% Responsible for grandchildren188 82.2% Not responsible for grandchildrenHispanic or Latino 197 100.0% Not responsible for grandchildren