Sarasota, FL (Florida) Houses and Residents
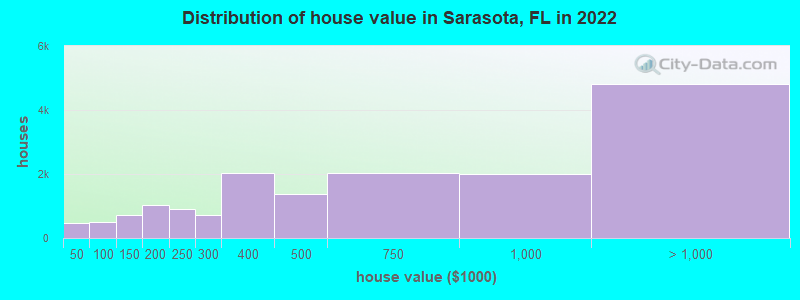
Estimated median house or condo value in 2022: $446,949 (it was $95,600 in 2000 )
Sarasota:
$446,949Florida:
$354,100
Lower value quartile - upper value quartile: $257,798 - $1,125,147Mean price in 2022: Detached houses: $850,886 Here:
$850,886State:
$500,941
Townhouses or other attached units: $354,275 Here:
$354,275State:
$370,869
In 2-unit structures: $567,804 Here:
$567,804State:
$423,188
In 3-to-4-unit structures: $290,876 Here:
$290,876State:
$309,944
In 5-or-more-unit structures: $966,885 Here:
$966,885State:
$447,145
Mobile homes: $106,510 Here:
$106,510State:
$113,202
Total population: 54,214 (Urban population: 52,537, Rural population: 0)
Houses: 33,200 (26,010 occupied: 15,229 owner occupied, 11,622 renter occupied )
% of renters here:
43%State:
33%
Housing density: 2,229 houses/condos per square mile
Median price asked for vacant for-sale houses and condos in 2022: $332,416.
Median contract rent in 2022: $1,373 (lower quartile is $1,017, upper quartile is $1,957)
Median rent asked for vacant for-rent units in 2022: $2,160
Median gross rent in Sarasota, FL in 2022: $1,504
Housing units in Sarasota with a mortgage: 6,796 (606 second mortgage, 11 home equity loan, 415 both second mortgage and home equity loan )Houses without a mortgage: 243
Median household income for houses/condos with a mortgage: $96,322
Median household income for apartments without a mortgage: $83,509
Median monthly housing costs: $1,426
Data:
Median house or condo value ($)
Median house or condo value ($ change since 2000)
Median house or condo value ($) - White
Median house or condo value ($) - Black or African American
Median house or condo value ($) - Asian
Median house or condo value ($) - Hispanic or Latino
Median house or condo value ($) - American Indian and Alaska Native
Median house or condo value ($) - Multirace
Median house or condo value ($) - Other Race
Median price asked for mobile homes ($)
Household density (households per square mile)
Mean house or condo value by units in structure - 1, detached ($)
Mean house or condo value by units in structure - 1, attached ($)
Mean house or condo value by units in structure - 2 ($)
Mean house or condo value by units in structure by units in structure - 3 or 4 ($)
Mean house or condo value by units in structure - 5 or more ($)
Mean house or condo value by units in structure - Boat, RV, van, etc. ($)
Mean house or condo value by units in structure - Mobile home ($)
Median contract rent ($)
Median contract rent - Lower quartile ($)
Median contract rent - Upper quartile ($)
Median gross rent ($)
Urban houses (%)
Rural houses (%)
Houses occupied (%)
Houses occupied (% change since 2000)
Houses owner occupied (%)
Houses owner occupied (% change since 2000)
Houses renter occupied (%)
Houses renter occupied (% change since 2000)
Vacant housing units - For rent (%)
Vacant housing units - For rent (% change since 2000)
Vacant housing units - For sale only (%)
Vacant housing units - For sale only (% change since 2000)
Vacant housing units - Rented or sold, not occupied (%)
Vacant housing units - Rented or sold, not occupied (% change since 2000)
Vacant housing units - For seasonal, recreational, or occasional use (%)
Vacant housing units - For seasonal, recreational, or occasional use (% change since 2000)
Vacant housing units - For migrant workers (%)
Vacant housing units - For migrant workers (% change since 2000)
Vacant housing units - Other vacant (%)
Vacant housing units - Other vacant (% change since 2000)
Median monthly housing costs ($)
Median household income for houses/condos with a mortgage ($)
Median household income for houses/condos without a mortgage ($)
Median household income ($)
Median household income ($) - White
Median household income ($) - Black or African American
Median household income ($) - Asian
Median household income ($) - Hispanic or Latino
Median household income ($) - American Indian and Alaska Native
Median household income ($) - Multirace
Median household income ($) - Other Race
Mortgage status - with mortgage (%)
Mortgage status - with second mortgage (%)
Mortgage status - with home equity loan (%)
Mortgage status - with both second mortgage and home equity loan (%)
Mortgage status - without a mortgage (%)
Median year house/condo built
Median year apartment built
Household type by relationship - Male householder living alone (%)
Household type by relationship - Male householder not living alone (%)
Household type by relationship - Female householder living alone (%)
Household type by relationship - Female householder not living alone (%)
Household type by relationship - Opposite-Sex spouse (%)
Household type by relationship - Same-Sex spouse (%)
Household type by relationship - Opposite-Sex unmarried partner (%)
Household type by relationship - Same-Sex unmarried partner (%)
Household type by relationship - In group quarters (%)
Size of family households - 2-person household (%)
Size of family households - 3-person household (%)
Size of family households - 4-person household (%)
Size of family households - 5-person household (%)
Size of family households - 6-person household (%)
Size of family households - 7-or-more-person household (%)
Size of nonfamily households - 1-person household (%)
Size of nonfamily households - 2-person household (%)
Size of nonfamily households - 3-person household (%)
Size of nonfamily households - 4-person household (%)
Size of nonfamily households - 5-person household (%)
Size of nonfamily households - 6-person household (%)
Size of nonfamily households - 7-or-moreperson household (%)
Year house built - Built 2010 or later (%)
Year house built - Built 2000 to 2009 (%)
Year house built - Built 1990 to 1999 (%)
Year house built - Built 1980 to 1989 (%)
Year house built - Built 1970 to 1979 (%)
Year house built - Built 1960 to 1969 (%)
Year house built - Built 1950 to 1959 (%)
Year house built - Built 1940 to 1949 (%)
Year house built - Built 1939 or earlier (%)
Median number of rooms in houses and condos
Median number of rooms in apartments
Median number of bedrooms in owner occupied houses
Mean number of bedrooms in owner occupied houses
Median number of bedrooms in renter occupied houses
Mean number of bedrooms in renter occupied houses
Median number of vehichles in owner occupied houses
Mean number of vehichles in owner occupied houses
Median number of vehichles in renter occupied houses
Mean number of vehichles in renter occupied houses
Rooms in owner-occupied houses - 1 room (%)
Rooms in owner-occupied houses - 2 rooms (%)
Rooms in owner-occupied houses - 3 rooms (%)
Rooms in owner-occupied houses - 4 rooms (%)
Rooms in owner-occupied houses - 5 rooms (%)
Rooms in owner-occupied houses - 6 rooms (%)
Rooms in owner-occupied houses - 7 rooms (%)
Rooms in owner-occupied houses - 8 rooms (%)
Rooms in owner-occupied houses - 9+ rooms (%)
Rooms in renter-occupied houses - 1 room (%)
Rooms in renter-occupied houses - 2 rooms (%)
Rooms in renter-occupied houses - 3 rooms (%)
Rooms in renter-occupied houses - 4 rooms (%)
Rooms in renter-occupied houses - 5 rooms (%)
Rooms in renter-occupied houses - 6 rooms (%)
Rooms in renter-occupied houses - 7 rooms (%)
Rooms in renter-occupied houses - 8 rooms (%)
Rooms in renter-occupied houses - 9+ rooms (%)
Bedrooms in owner-occupied houses - no bedrooms (%)
Bedrooms in owner-occupied houses - 1 bedroom (%)
Bedrooms in owner-occupied houses - 2 bedrooms (%)
Bedrooms in owner-occupied houses - 3 bedrooms (%)
Bedrooms in owner-occupied houses - 4 bedrooms (%)
Bedrooms in owner-occupied houses - 5+ bedrooms (%)
Bedrooms in renter-occupied houses - no bedrooms (%)
Bedrooms in renter-occupied houses - 1 bedroom (%)
Bedrooms in renter-occupied houses - 2 bedrooms (%)
Bedrooms in renter-occupied houses - 3 bedrooms (%)
Bedrooms in renter-occupied houses - 4 bedrooms (%)
Bedrooms in renter-occupied houses - 5+ bedrooms (%)
Vehicles available in owner-occupied houses - no vehicle available (%)
Vehicles available in owner-occupied houses - 1 vehicle available(%)
Vehicles available in owner-occupied houses - 2 Vehicles available (%)
Vehicles available in owner-occupied houses - 3 Vehicles available (%)
Vehicles available in owner-occupied houses - 4 Vehicles available (%)
Vehicles available in owner-occupied houses - 5+ Vehicles available (%)
Vehicles available in renter-occupied houses - no vehicle available (%)
Vehicles available in renter-occupied houses - 1 vehicle available (%)
Vehicles available in renter-occupied houses - 2 Vehicles available (%)
Vehicles available in renter-occupied houses - 3 Vehicles available (%)
Vehicles available in renter-occupied houses - 4 Vehicles available (%)
Vehicles available in renter-occupied houses - 5+ Vehicles available (%)
Housing units in structures - 1, detached (%)
Housing units in structures - 1, attached (%)
Housing units in structures - 2 (%)
Housing units in structures - 3 or 4 (%)
Housing units in structures - 5 to 9 (%)
Housing units in structures - 10 to 19 (%)
Housing units in structures - 20 to 49 (%)
Housing units in structures - 50 or more (%)
Housing units in structures - Mobile home (%)
Housing units in structures - Boat, RV, van, etc. (%)
Housing units in structures - Owners - 1, detached (%)
Housing units in structures - Owners - 1, attached (%)
Housing units in structures - Owners - 2 (%)
Housing units in structures - Owners - 3 or 4 (%)
Housing units in structures - Owners - 5 to 9 (%)
Housing units in structures - Owners - 10 to 19 (%)
Housing units in structures - Owners - 20 to 49 (%)
Housing units in structures - Owners - 50 or more (%)
Housing units in structures - Owners - Mobile home (%)
Housing units in structures - Owners - Boat, RV, van, etc. (%)
Housing units in structures - Renters - 1, detached (%)
Housing units in structures - Renters - 1, attached (%)
Housing units in structures - Renters - 2 (%)
Housing units in structures - Renters - 3 or 4 (%)
Housing units in structures - Renters - 5 to 9 (%)
Housing units in structures - Renters - 10 to 19 (%)
Housing units in structures - Renters - 20 to 49 (%)
Housing units in structures - Renters - 50 or more (%)
Housing units in structures - Renters - Mobile home (%)
Housing units in structures - Renters - Boat, RV, van, etc. (%)
House/condo owner moved in on average (years ago)
Renter moved in on average (years ago)
Year householder moved into unit - Moved in 1999 to March 2000 (%)
Year householder moved into unit - Moved in 1999 to March 2000 (%) - White
Year householder moved into unit - Moved in 1999 to March 2000 (%) - Black or African American
Year householder moved into unit - Moved in 1999 to March 2000 (%) - Asian
Year householder moved into unit - Moved in 1999 to March 2000 (%) - Hispanic or Latino
Year householder moved into unit - Moved in 1999 to March 2000 (%) - American Indian and Alaska Native
Year householder moved into unit - Moved in 1999 to March 2000 (%) - Multirace
Year householder moved into unit - Moved in 1999 to March 2000 (%) - Other Race
Year householder moved into unit - Moved in 1995 to 1998 (%)
Year householder moved into unit - Moved in 1995 to 1998 (%) - White
Year householder moved into unit - Moved in 1995 to 1998 (%) - Black or African American
Year householder moved into unit - Moved in 1995 to 1998 (%) - Asian
Year householder moved into unit - Moved in 1995 to 1998 (%) - Hispanic or Latino
Year householder moved into unit - Moved in 1995 to 1998 (%) - American Indian and Alaska Native
Year householder moved into unit - Moved in 1995 to 1998 (%) - Multirace
Year householder moved into unit - Moved in 1995 to 1998 (%) - Other Race
Year householder moved into unit - Moved in 1990 to 1994 (%)
Year householder moved into unit - Moved in 1990 to 1994 (%) - White
Year householder moved into unit - Moved in 1990 to 1994 (%) - Black or African American
Year householder moved into unit - Moved in 1990 to 1994 (%) - Asian
Year householder moved into unit - Moved in 1990 to 1994 (%) - Hispanic or Latino
Year householder moved into unit - Moved in 1990 to 1994 (%) - American Indian and Alaska Native
Year householder moved into unit - Moved in 1990 to 1994 (%) - Multirace
Year householder moved into unit - Moved in 1990 to 1994 (%) - Other Race
Year householder moved into unit - Moved in 1980 to 1989 (%)
Year householder moved into unit - Moved in 1980 to 1989 (%) - White
Year householder moved into unit - Moved in 1980 to 1989 (%) - Black or African American
Year householder moved into unit - Moved in 1980 to 1989 (%) - Asian
Year householder moved into unit - Moved in 1980 to 1989 (%) - Hispanic or Latino
Year householder moved into unit - Moved in 1980 to 1989 (%) - American Indian and Alaska Native
Year householder moved into unit - Moved in 1980 to 1989 (%) - Multirace
Year householder moved into unit - Moved in 1980 to 1989 (%) - Other Race
Year householder moved into unit - Moved in 1970 to 1979 (%)
Year householder moved into unit - Moved in 1970 to 1979 (%) - White
Year householder moved into unit - Moved in 1970 to 1979 (%) - Black or African American
Year householder moved into unit - Moved in 1970 to 1979 (%) - Asian
Year householder moved into unit - Moved in 1970 to 1979 (%) - Hispanic or Latino
Year householder moved into unit - Moved in 1970 to 1979 (%) - American Indian and Alaska Native
Year householder moved into unit - Moved in 1970 to 1979 (%) - Multirace
Year householder moved into unit - Moved in 1970 to 1979 (%) - Other Race
Year householder moved into unit - Moved in 1969 or earlier (%)
Year householder moved into unit - Moved in 1969 or earlier (%) - White
Year householder moved into unit - Moved in 1969 or earlier (%) - Black or African American
Year householder moved into unit - Moved in 1969 or earlier (%) - Asian
Year householder moved into unit - Moved in 1969 or earlier (%) - Hispanic or Latino
Year householder moved into unit - Moved in 1969 or earlier (%) - American Indian and Alaska Native
Year householder moved into unit - Moved in 1969 or earlier (%) - Multirace
Year householder moved into unit - Moved in 1969 or earlier (%) - Other Race
Housing units lacking complete plumbing facilities (%)
Housing units lacking complete kitchen facilities (%)
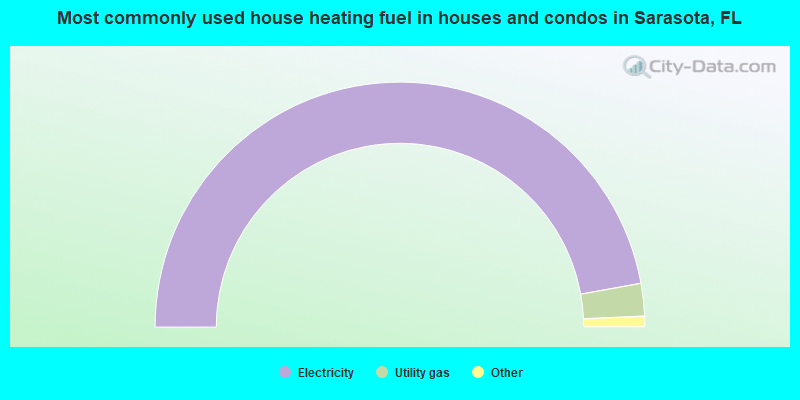
House heating fuel used in houses and condos - Utility gas (%)
House heating fuel used in houses and condos - Bottled, tank, or LP gas (%)
House heating fuel used in houses and condos - Electricity (%)
House heating fuel used in houses and condos - Fuel oil, kerosene, etc. (%)
House heating fuel used in houses and condos - Coal or coke (%)
House heating fuel used in houses and condos - Wood (%)
House heating fuel used in houses and condos - Solar energy (%)
House heating fuel used in houses and condos - Other fuel (%)
House heating fuel used in houses and condos - No fuel used (%)
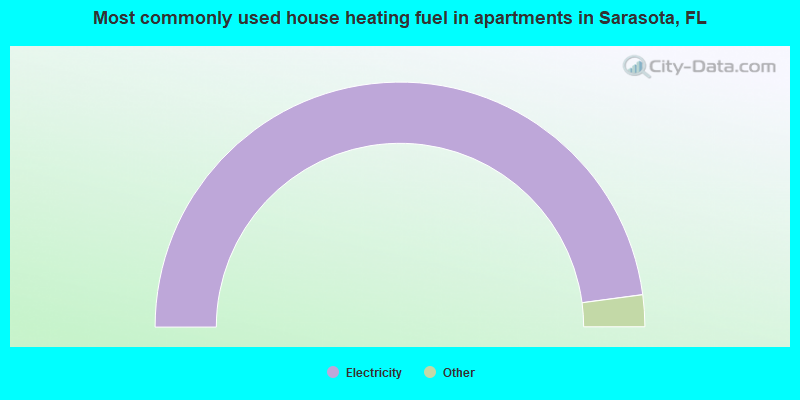
House heating fuel used in apartments - Utility gas (%)
House heating fuel used in apartments - Bottled, tank, or LP gas (%)
House heating fuel used in apartments - Electricity (%)
House heating fuel used in apartments - Fuel oil, kerosene, etc. (%)
House heating fuel used in apartments - Coal or coke (%)
House heating fuel used in apartments - Wood (%)
House heating fuel used in apartments - Solar energy (%)
House heating fuel used in apartments - Other fuel (%)
House heating fuel used in apartments - No fuel used (%)
Latest news about housing in Sarasota, FL collected exclusively by city-data.com from local newspapers, TV, and radio stations
Median year house/condo built: 1975Median year apartment built: 1978Household type by relationship:
Households: 58,400
Male householders: 11,636 (3,906 living alone ), Female householders: 14,542 (6,459 living alone )9,784 spouses (9,674 opposite-sex spouses ), 1,752 unmarried partners , (1,530 opposite-sex unmarried partners ), 10,283 children (9,653 natural , 127 adopted , 502 stepchildren ), 1,119 grandchildren , 861 brothers or sisters , 621 parents , 0 foster children , 721 other relatives , 2,708 non-relatives In group quarters: 4,368
Size of family households: 8,390 2-persons , 2,525 3-persons , 2,097 4-persons , 471 5-persons , 153 6-persons , 230 7-or-more-persons .
Size of nonfamily households: 10,467 1-person , 2,036 2-persons , 259 3-persons , 61 4-persons , 71 5-persons , 131 7-or-more-persons .
3,750 married couples with children. single-parent households (287 men , 2,571 women ).
81.6% of residents of Sarasota speak English at home. of residents speak Spanish at home (55% speak English very well , 29% speak English well , 11% speak English not well , 5% don't speak English at all ).of residents speak other Indo-European language at home (59% speak English very well , 29% speak English well , 11% speak English not well , 1% don't speak English at all ).of residents speak Asian or Pacific Island language at home (58% speak English very well , 27% speak English well , 14% speak English not well ).of residents speak other language at home (73% speak English very well , 20% speak English well , 7% speak English not well ).
Foreign born population: 9,117 (15.6%)of them are naturalized citizens )
Median number of rooms in houses and condos:
Median number of rooms in apartments
Owner-occupied Renter-occupied
Rooms in owner-occupied houses in Sarasota, Florida
19 1 room 160 2 rooms 799 3 rooms 3,452 4 rooms 3,772 5 rooms 3,449 6 rooms 1,554 7 rooms 946 8 rooms 1,078 9+ rooms
Rooms in renter-occupied apartments in Sarasota, Florida
444 1 room 744 2 rooms 1,963 3 rooms 4,435 4 rooms 2,274 5 rooms 1,143 6 rooms 382 7 rooms 136 8 rooms 103 9+ rooms
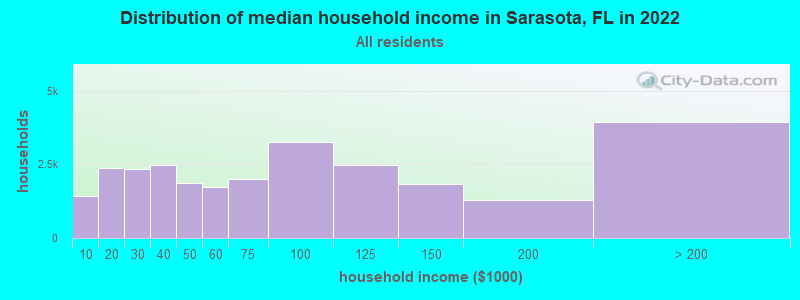
Sarasota, FL household income distribution 1,435 Less than $10,0002,391 $10,000 to $19,9992,346 $20,000 to $29,9992,485 $30,000 to $39,9991,878 $40,000 to $49,9991,720 $50,000 to $59,9992,004 $60,000 to $74,9993,252 $75,000 to $99,9992,486 $100,000 to $124,9991,838 $125,000 to $149,9991,308 $150,000 to $199,9993,943 $200,000 or more
Home value of owner - occupied houses in 2022 in Sarasota, FL 139 Less than $10,00036 $10,000 to $14,99940 $15,000 to $19,9996 $20,000 to $24,99939 $25,000 to $29,99963 $30,000 to $34,999109 $35,000 to $39,99947 $40,000 to $49,99929 $50,000 to $59,99937 $60,000 to $69,999235 $70,000 to $79,99935 $80,000 to $89,999113 $90,000 to $99,999417 $100,000 to $124,999301 $125,000 to $149,999636 $150,000 to $174,999391 $175,000 to $199,999897 $200,000 to $249,999704 $250,000 to $299,9992,021 $300,000 to $399,9991,368 $400,000 to $499,9992,028 $500,000 to $749,9992,003 $750,000 to $999,9991,631 $1,000,000 to $1,499,999441 $1,500,000 to $1,999,9992,739 $2,000,000 or moreRent paid by renters in 2022 in Sarasota, FL 19 Less than $10050 $100 to $14941 $150 to $19975 $200 to $249100 $250 to $299106 $300 to $34969 $400 to $44945 $450 to $499217 $500 to $549145 $550 to $599351 $600 to $649269 $650 to $699113 $700 to $749208 $750 to $799545 $800 to $899525 $900 to $9991,963 $1,000 to $1,2491,273 $1,250 to $1,4991,978 $1,500 to $1,999751 $2,000 to $2,499815 $2,500 to $2,999609 $3,000 to $3,499550 $3,500 or more742 No cash rent
Percentage of workers working in this county: 87.5%Number of people working at home: 4,429 (17.1% of all workers )
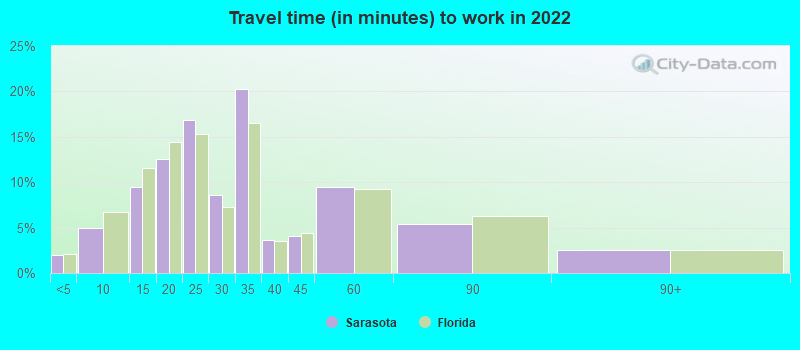
Travel time to work (commute)
Less than 5 minutes: 6435 to 9 minutes: 1,65310 to 14 minutes: 3,58315 to 19 minutes: 3,93520 to 24 minutes: 4,39025 to 29 minutes: 1,13630 to 34 minutes: 3,50735 to 39 minutes: 36040 to 44 minutes: 22645 to 59 minutes: 35860 to 89 minutes: 1,07590 or more minutes: 197
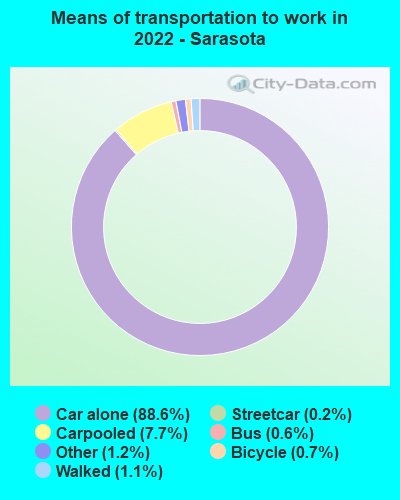
Means of transportation to work:
Drove a car alone: 48,580 (78.4%)Carpooled: 4,914 (7.9%)Bus : 125 (0.2%)Subway or elevated rail : 93 (0.1%)Light rail, streetcar or trolley : 11 (0.0%)Taxi: 992 (1.6%)Bicycle: 392 (0.6%)Walked: 1,043 (1.7%)Worked at home: 4,429 (7.1%)
Unemployment by race in 2022
Unemployment rate for White non-Hispanic residents 1.9% Males2.0% FemalesUnemployment rate for Black residents 3.5% Males11.8% FemalesUnemployment rate for Asian residents 1.9% FemalesUnemployment rate for two or more race residents 3.0% Males1.7% FemalesUnemployment rate for Hispanic or Latino residents 1.3% Males1.2% Females
Year of entry for the foreign-born population in Sarasota, Florida
2,470 2010 or later 2,375 2000 to 2009 1,948 1990 to 1999 1,385 1980 to 1989 628 1970 to 1979 1,418 Before 1970
First ancestries reported:
American: 7,414 (22.7%)
German: 2,138 (6.5%)
English: 2,090 (6.4%)
Irish: 1,651 (5.0%)
Italian: 1,362 (4.2%)
Polish: 517 (1.6%)
European: 489 (1.5%)
Russian: 270 (0.8%)
Scottish: 264 (0.8%)
French Canadian: 215 (0.7%)
Eastern European: 212 (0.6%)
Swedish: 202 (0.6%)
Lebanese: 198 (0.6%)
Canadian: 193 (0.6%)
Scotch-Irish: 186 (0.6%)
African: 168 (0.5%)
Turkish: 162 (0.5%)
British: 157 (0.5%)
Hungarian: 140 (0.4%)
French: 128 (0.4%)
Iranian: 109 (0.3%)
Dutch: 102 (0.3%)
Danish: 88 (0.3%)
Brazilian: 85 (0.3%)
Portuguese: 83 (0.3%)
Swiss: 79 (0.2%)
Austrian: 72 (0.2%)
Haitian: 71 (0.2%)
Scandinavian: 68 (0.2%)
Lithuanian: 62 (0.2%)
Norwegian: 58 (0.2%)
Czech: 57 (0.2%)
Greek: 56 (0.2%)
Serbian: 54 (0.2%)
Jamaican: 51 (0.2%)
Basque: 45 (0.1%)
Northern European: 44 (0.1%)
Bulgarian: 41 (0.1%)
Czechoslovakian: 38 (0.1%)
Welsh: 37 (0.1%)
Yugoslavian: 36 (0.1%)
Ukrainian: 34 (0.1%)
Romanian: 32 (0.10%)
Egyptian: 27 (0.08%)
Croatian: 27 (0.08%)
Palestinian: 25 (0.08%)
Slovak: 25 (0.08%)
Cape Verdean: 23 (0.07%)
Zimbabwean: 23 (0.07%)
Barbadian: 15 (0.05%)
Moroccan: 15 (0.05%)
Finnish: 13 (0.04%)
Slovene: 11 (0.03%)
Assyrian: 10 (0.03%)
Armenian: 9 (0.03%)
Dutch West Indian: 9 (0.03%)
Slavic: 8 (0.02%)
Most common places of birth for foreign-born residents (%): Mexico Sarasota:
19.5% (1,565)Florida:
5.6% (257,152)
Cuba Sarasota:
8.1% (653)Florida:
22.0% (1,006,576)
Peru Sarasota:
6.4% (513)Florida:
2.1% (96,693)
Canada Sarasota:
5.8% (463)Florida:
2.4% (109,132)
Nicaragua Sarasota:
5.1% (413)Florida:
2.3% (105,066)
Venezuela Sarasota:
3.4% (270)Florida:
5.7% (262,042)
El Salvador Sarasota:
3.3% (269)Florida:
1.1% (49,838)
Brazil Sarasota:
3.0% (242)Florida:
2.7% (122,906)
China, excluding Hong Kong and Taiwan Sarasota:
2.6% (209)Florida:
1.2% (56,071)
Colombia Sarasota:
2.4% (194)Florida:
6.5% (298,669)
Germany Sarasota:
2.2% (174)Florida:
1.2% (54,272)
Philippines Sarasota:
1.8% (145)Florida:
1.8% (84,403)
Italy Sarasota:
1.8% (144)Florida:
0.7% (30,755)
England Sarasota:
1.6% (127)Florida:
0.8% (37,723)
India Sarasota:
1.5% (123)Florida:
2.1% (94,349)
Place of birth for U.S.-born residents:
This state: 17,733Other state: 30,268Northeast: 11,369Midwest: 9,534South: 7,294West: 2,171 81.9% of Sarasota residents lived in the same house 1 years ago.
Out of people who lived in different houses, 30.1% lived in this county.
Out of people who lived in different counties, 51.8% lived in Florida.
Sarasota:
81.9%State average:
86.3%
Education attainment for males 25 years and older:
No schooling: 397Nursery to 4th grade: 305th and 6th grade: 2207th and 8th grade: 1809th grade: 15910th grade: 42111th grade: 51612th grade, no diploma: 171High school graduate (or equivalency): 6,068Less than 1 year of college: 967Some college more than 1 year, no degree: 2,258Associate degree: 1,193Bachelor's degree: 4,392Master's degree: 2,552Professional school degree: 1,232Doctorate degree: 676
Education attainment for females 25 years and older:
No schooling: 180Nursery to 4th grade: 385th and 6th grade: 767th and 8th grade: 1909th grade: 3910th grade: 28111th grade: 20812th grade, no diploma: 636High school graduate (or equivalency): 5,785Less than 1 year of college: 1,111Some college more than 1 year, no degree: 2,637Associate degree: 2,129Bachelor's degree: 6,499Master's degree: 2,877Professional school degree: 808Doctorate degree: 587
Housing units in structures:
One, detached: 13,618One, attached: 2,770Two: 5663 or 4: 1,5365 to 9: 1,90310 to 19: 2,34020 to 49: 2,70950 or more: 6,532Mobile homes: 1,173Boats, RVs, vans, etc.: 48Median worth of mobile homes: $121,976
Housing units lacking complete plumbing facilities in 2022: 0.7%Housing units lacking complete kitchen facilities in 2022: 1.8%House/condo owner moved in on average 10 years ago
Renter moved in on average 3 years ago
Private vs. public school enrollment:
Students in private schools in grades 1 to 8 (elementary and middle school): 404 Students in private schools in grades 9 to 12 (high school): 187 Students in private undergraduate colleges: 2,090