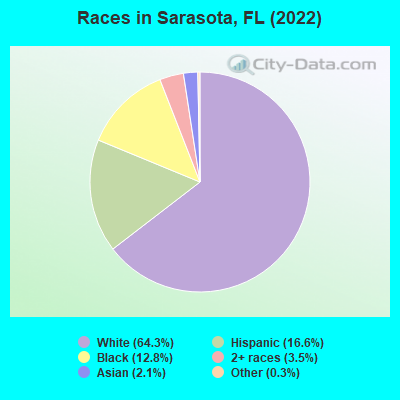
Races in Sarasota, Florida (FL) Detailed Stats
Data:
Races - White alone (%)
Races - White alone (% change since 2000)
Races - Black alone (%)
Races - Black alone (% change since 2000)
Races - American Indian alone (%)
Races - American Indian alone (% change since 2000)
Races - Asian alone (%)
Races - Asian alone (% change since 2000)
Races - Hispanic (%)
Races - Hispanic (% change since 2000)
Races - Native Hawaiian and Other Pacific Islander alone (%)
Races - Native Hawaiian and Other Pacific Islander alone (% change since 2000)
Races - Two or more races(%)
Races - Two or more races(% change since 2000)
Races - Other race alone (%)
Races - Other race alone (% change since 2000)
Racial diversity
Place of birth - Born in state of residence (%)
Place of birth - Born in state of residence (%) - White
Place of birth - Born in state of residence (%) - Black or African American
Place of birth - Born in state of residence (%) - Asian
Place of birth - Born in state of residence (%) - Hispanic or Latino
Place of birth - Born in state of residence (%) - American Indian and Alaska Native
Place of birth - Born in state of residence (%) - Multirace
Place of birth - Born in state of residence (%) - Other Race
Place of birth - Born in other state (%)
Place of birth - Born in other state (%) - White
Place of birth - Born in other state (%) - Black or African American
Place of birth - Born in other state (%) - Asian
Place of birth - Born in other state (%) - Hispanic or Latino
Place of birth - Born in other state (%) - American Indian and Alaska Native
Place of birth - Born in other state (%) - Multirace
Place of birth - Born in other state (%) - Other Race
Place of birth - Native, outside of US (%)
Place of birth - Native, outside of US (%) - White
Place of birth - Native, outside of US (%) - Black or African American
Place of birth - Native, outside of US (%) - Asian
Place of birth - Native, outside of US (%) - Hispanic or Latino
Place of birth - Native, outside of US (%) - American Indian and Alaska Native
Place of birth - Native, outside of US (%) - Multirace
Place of birth - Native, outside of US (%) - Other Race
Place of birth - Foreign born (%)
Place of birth - Foreign born (%) - White
Place of birth - Foreign born (%) - Black or African American
Place of birth - Foreign born (%) - Asian
Place of birth - Foreign born (%) - Hispanic or Latino
Place of birth - Foreign born (%) - American Indian and Alaska Native
Place of birth - Foreign born (%) - Multirace
Place of birth - Foreign born (%) - Other Race
Residents speaking English at home (%)
Residents speaking English at home - Born in the United States (%)
Residents speaking English at home - Native, born elsewhere (%)
Residents speaking English at home - Foreign born (%)
Residents speaking Spanish at home (%)
Residents speaking Spanish at home - Born in the United States (%)
Residents speaking Spanish at home - Native, born elsewhere (%)
Residents speaking Spanish at home - Foreign born (%)
Residents speaking other language at home (%)
Residents speaking other language at home - Born in the United States (%)
Residents speaking other language at home - Native, born elsewhere (%)
Residents speaking other language at home - Foreign born (%)
Marital status - Never married (%)
Marital status - Now married (%)
Marital status - Separated (%)
Marital status - Widowed (%)
Marital status - Divorced (%)
Ancestries Reported - Arab (%)
Ancestries Reported - Czech (%)
Ancestries Reported - Danish (%)
Ancestries Reported - Dutch (%)
Ancestries Reported - English (%)
Ancestries Reported - French (%)
Ancestries Reported - French Canadian (%)
Ancestries Reported - German (%)
Ancestries Reported - Greek (%)
Ancestries Reported - Hungarian (%)
Ancestries Reported - Irish (%)
Ancestries Reported - Italian (%)
Ancestries Reported - Lithuanian (%)
Ancestries Reported - Norwegian (%)
Ancestries Reported - Polish (%)
Ancestries Reported - Portuguese (%)
Ancestries Reported - Russian (%)
Ancestries Reported - Scotch-Irish (%)
Ancestries Reported - Scottish (%)
Ancestries Reported - Slovak (%)
Ancestries Reported - Subsaharan African (%)
Ancestries Reported - Swedish (%)
Ancestries Reported - Swiss (%)
Ancestries Reported - Ukrainian (%)
Ancestries Reported - United States (%)
Ancestries Reported - Welsh (%)
Ancestries Reported - West Indian (%)
Ancestries Reported - Other (%)
Geographical mobility - Same house 1 year ago (%)
Geographical mobility - Same house 1 year ago (%) - White
Geographical mobility - Same house 1 year ago (%) - Black or African American
Geographical mobility - Same house 1 year ago (%) - Asian
Geographical mobility - Same house 1 year ago (%) - Hispanic or Latino
Geographical mobility - Same house 1 year ago (%) - American Indian and Alaska Native
Geographical mobility - Same house 1 year ago (%) - Multirace
Geographical mobility - Same house 1 year ago (%) - Other Race
Geographical mobility - Moved within same county (%)
Geographical mobility - Moved within same county (%) - White
Geographical mobility - Moved within same county (%) - Black or African American
Geographical mobility - Moved within same county (%) - Asian
Geographical mobility - Moved within same county (%) - Hispanic or Latino
Geographical mobility - Moved within same county (%) - American Indian and Alaska Native
Geographical mobility - Moved within same county (%) - Multirace
Geographical mobility - Moved within same county (%) - Other Race
Geographical mobility - Moved from different county within same state (%)
Geographical mobility - Moved from different county within same state (%) - White
Geographical mobility - Moved from different county within same state (%) - Black or African American
Geographical mobility - Moved from different county within same state (%) - Asian
Geographical mobility - Moved from different county within same state (%) - Hispanic or Latino
Geographical mobility - Moved from different county within same state (%) - American Indian and Alaska Native
Geographical mobility - Moved from different county within same state (%) - Multirace
Geographical mobility - Moved from different county within same state (%) - Other Race
Geographical mobility - Moved from different state (%)
Geographical mobility - Moved from different state (%) - White
Geographical mobility - Moved from different state (%) - Black or African American
Geographical mobility - Moved from different state (%) - Asian
Geographical mobility - Moved from different state (%) - Hispanic or Latino
Geographical mobility - Moved from different state (%) - American Indian and Alaska Native
Geographical mobility - Moved from different state (%) - Multirace
Geographical mobility - Moved from different state (%) - Other Race
Geographical mobility - Moved from abroad (%)
Geographical mobility - Moved from abroad (%) - White
Geographical mobility - Moved from abroad (%) - Black or African American
Geographical mobility - Moved from abroad (%) - Asian
Geographical mobility - Moved from abroad (%) - Hispanic or Latino
Geographical mobility - Moved from abroad (%) - American Indian and Alaska Native
Geographical mobility - Moved from abroad (%) - Multirace
Geographical mobility - Moved from abroad (%) - Other Race
Place of birth for the foreign-born population - Ireland (%)
Place of birth for the foreign-born population - Denmark (%)
Place of birth for the foreign-born population - Norway (%)
Place of birth for the foreign-born population - Sweden (%)
Place of birth for the foreign-born population - United Kingdom (%)
Place of birth for the foreign-born population - England (%)
Place of birth for the foreign-born population - Scotland (%)
Place of birth for the foreign-born population - Other Northern Europe (%)
Place of birth for the foreign-born population - Austria (%)
Place of birth for the foreign-born population - Belgium (%)
Place of birth for the foreign-born population - France (%)
Place of birth for the foreign-born population - Germany (%)
Place of birth for the foreign-born population - Netherlands (%)
Place of birth for the foreign-born population - Switzerland (%)
Place of birth for the foreign-born population - Other Western Europe (%)
Place of birth for the foreign-born population - Greece (%)
Place of birth for the foreign-born population - Italy (%)
Place of birth for the foreign-born population - Portugal (%)
Place of birth for the foreign-born population - Spain (%)
Place of birth for the foreign-born population - Other Southern Europe (%)
Place of birth for the foreign-born population - Albania (%)
Place of birth for the foreign-born population - Belarus (%)
Place of birth for the foreign-born population - Bosnia and Herzegovina (%)
Place of birth for the foreign-born population - Bulgaria (%)
Place of birth for the foreign-born population - Croatia (%)
Place of birth for the foreign-born population - Czechoslovakia (%)
Place of birth for the foreign-born population - Hungary (%)
Place of birth for the foreign-born population - Latvia (%)
Place of birth for the foreign-born population - Lithuania (%)
Place of birth for the foreign-born population - North Macedonia (Macedonia) (%)
Place of birth for the foreign-born population - Moldova (%)
Place of birth for the foreign-born population - Poland (%)
Place of birth for the foreign-born population - Romania (%)
Place of birth for the foreign-born population - Russia (%)
Place of birth for the foreign-born population - Serbia (%)
Place of birth for the foreign-born population - Ukraine (%)
Place of birth for the foreign-born population - Other Eastern Europe (%)
Place of birth for the foreign-born population - China (%)
Place of birth for the foreign-born population - Hong Kong (%)
Place of birth for the foreign-born population - Taiwan (%)
Place of birth for the foreign-born population - Japan (%)
Place of birth for the foreign-born population - Korea (%)
Place of birth for the foreign-born population - Other Eastern Asia (%)
Place of birth for the foreign-born population - Afghanistan (%)
Place of birth for the foreign-born population - Bangladesh (%)
Place of birth for the foreign-born population - India (%)
Place of birth for the foreign-born population - Iran (%)
Place of birth for the foreign-born population - Kazakhstan (%)
Place of birth for the foreign-born population - Nepal (%)
Place of birth for the foreign-born population - Pakistan (%)
Place of birth for the foreign-born population - Sri Lanka (%)
Place of birth for the foreign-born population - Uzbekistan (%)
Place of birth for the foreign-born population - Other South Central Asia (%)
Place of birth for the foreign-born population - Burma (%)
Place of birth for the foreign-born population - Cambodia (%)
Place of birth for the foreign-born population - Indonesia (%)
Place of birth for the foreign-born population - Laos (%)
Place of birth for the foreign-born population - Malaysia (%)
Place of birth for the foreign-born population - Philippines (%)
Place of birth for the foreign-born population - Singapore (%)
Place of birth for the foreign-born population - Thailand (%)
Place of birth for the foreign-born population - Vietnam (%)
Place of birth for the foreign-born population - Other South Eastern Asia (%)
Place of birth for the foreign-born population - Armenia (%)
Place of birth for the foreign-born population - Iraq (%)
Place of birth for the foreign-born population - Israel (%)
Place of birth for the foreign-born population - Jordan (%)
Place of birth for the foreign-born population - Kuwait (%)
Place of birth for the foreign-born population - Lebanon (%)
Place of birth for the foreign-born population - Saudi Arabia (%)
Place of birth for the foreign-born population - Syria (%)
Place of birth for the foreign-born population - Turkey (%)
Place of birth for the foreign-born population - Yemen (%)
Place of birth for the foreign-born population - Other Western Asia (%)
Place of birth for the foreign-born population - Eritrea (%)
Place of birth for the foreign-born population - Ethiopia (%)
Place of birth for the foreign-born population - Kenya (%)
Place of birth for the foreign-born population - Somalia (%)
Place of birth for the foreign-born population - Uganda (%)
Place of birth for the foreign-born population - Zimbabwe (%)
Place of birth for the foreign-born population - Other Eastern Africa (%)
Place of birth for the foreign-born population - Cameroon (%)
Place of birth for the foreign-born population - Congo (%)
Place of birth for the foreign-born population - Democratic Republic of Congo (Zaire) (%)
Place of birth for the foreign-born population - Other Middle Africa (%)
Place of birth for the foreign-born population - Egypt (%)
Place of birth for the foreign-born population - Morocco (%)
Place of birth for the foreign-born population - Sudan (%)
Place of birth for the foreign-born population - Other Northern Africa (%)
Place of birth for the foreign-born population - South Africa (%)
Place of birth for the foreign-born population - Other Southern Africa (%)
Place of birth for the foreign-born population - Cabo Verde (%)
Place of birth for the foreign-born population - Ghana (%)
Place of birth for the foreign-born population - Liberia (%)
Place of birth for the foreign-born population - Nigeria (%)
Place of birth for the foreign-born population - Senegal (%)
Place of birth for the foreign-born population - Sierra Leone (%)
Place of birth for the foreign-born population - Other Western Africa (%)
Place of birth for the foreign-born population - Australia (%)
Place of birth for the foreign-born population - New Zealand (%)
Place of birth for the foreign-born population - Fiji (%)
Place of birth for the foreign-born population - Micronesia (%)
Place of birth for the foreign-born population - Bahamas (%)
Place of birth for the foreign-born population - Barbados (%)
Place of birth for the foreign-born population - Cuba (%)
Place of birth for the foreign-born population - Dominica (%)
Place of birth for the foreign-born population - Dominican Republic (%)
Place of birth for the foreign-born population - Grenada (%)
Place of birth for the foreign-born population - Haiti (%)
Place of birth for the foreign-born population - Jamaica (%)
Place of birth for the foreign-born population - St. Vincent and the Grenadines (%)
Place of birth for the foreign-born population - Trinidad and Tobago (%)
Place of birth for the foreign-born population - West Indies (%)
Place of birth for the foreign-born population - Other Caribbean (%)
Place of birth for the foreign-born population - Belize (%)
Place of birth for the foreign-born population - Costa Rica (%)
Place of birth for the foreign-born population - El Salvador (%)
Place of birth for the foreign-born population - Guatemala (%)
Place of birth for the foreign-born population - Honduras (%)
Place of birth for the foreign-born population - Mexico (%)
Place of birth for the foreign-born population - Nicaragua (%)
Place of birth for the foreign-born population - Panama (%)
Place of birth for the foreign-born population - Other Central America (%)
Place of birth for the foreign-born population - Argentina (%)
Place of birth for the foreign-born population - Bolivia (%)
Place of birth for the foreign-born population - Brazil (%)
Place of birth for the foreign-born population - Chile (%)
Place of birth for the foreign-born population - Colombia (%)
Place of birth for the foreign-born population - Ecuador (%)
Place of birth for the foreign-born population - Guyana (%)
Place of birth for the foreign-born population - Peru (%)
Place of birth for the foreign-born population - Uruguay (%)
Place of birth for the foreign-born population - Venezuela (%)
Place of birth for the foreign-born population - Other South America (%)
Place of birth for the foreign-born population - Canada (%)
Place of birth for the foreign-born population - Other Northern America (%)
Place of birth for the foreign-born population - Other (%)
Sarasota Powerboat Grand Prix Races moving to September! (0 replies)Beertopia, Parrish Heritage Days, Art in the Park, Gamble Plantation Open House & more, all this weekend! (2 replies)Irish Celtic Festival, Palmetto Heritage Festival, Festival of the Arts, Paul Anka & Baseball, all this weekend! (0 replies)River Regatta, Cortez Fishing Festival, Greek Festival, Thunder by the Bay, Circus Sarasota & more, all this weekend! (1 reply)Sarasota County breaks ground on new $75 million administration center off Fruitville Road (0 replies)SAFE rental house in Sarasota-what areas "unsafe?" (9 replies)
Latest news about races in Sarasota, FL collected exclusively by city-data.com from local newspapers, TV, and radio stations
According to 2022 data, the most numerous races in Sarasota, FL are White alone (37,574 residents), Hispanic (9,723 residents), and Black alone (7,447 residents). 81.7% of Sarasota residents speak English at home. 13.8% of Sarasota, FL residents are foreign-born (8.0% born in Latin America, 2.6% born in Europe, 1.9% born in Asia), which is 52.5% less than the foreign-born rate of 21.0% across the entire state of Florida.
Race distribution in Sarasota
2000 2022
10,458,509 65.4% White alone 2,682,715 16.8% Hispanic 2,264,268 14.2% Black alone 261,693 1.6% Asian alone 236,954 1.5% Two or more races 42,358 0.3% American Indian alone 28,994 0.2% Other race alone 6,887 0.04% Native Hawaiian and Other
11,309,403 50.8% White alone 6,025,039 27.1% Hispanic 3,241,015 14.6% Black alone 861,630 3.9% Two or more races 623,692 2.8% Asian alone 152,054 0.7% Other race alone 22,504 0.1% American Indian alone 9,486 0.04% Native Hawaiian and Other
Income and house value in Sarasota Median household income in 2022 $79,045 White non-Hispanic householders$37,139 Black householders$43,114 Asian householders$73,380 Some other race householders$58,666 Two or more races householders$59,296 Hispanic or Latino race householdersMedian 2022 house value $484,351 White Non-Hispanic householders$312,771 Black or African American householders$415,158 American Indian or Alaska Native householders $405,340 Asian householders$431,521 Some other race householders$518,480 Two or more races householders$396,457 Hispanic or Latino householders
Median age by race in Sarasota
57.9 Median age for White residents54.0 60.3 40.9 Median age for Black or African American residents45.2 34.8 95.0 Median age for American Indian / Alaska Native residents63.4 -594,925,633.7 37.3 Median age for Asian residents44.8 32.7 -679,849,340.2 Median age for Native Hawaiian / Pacific Islander residents-858,307,848.3 -443,298,968.6 35.5 Median age for Other race residents37.2 37.4 27.5 Median age for Two or more races residents26.0 27.0 59.5 Median age for White alone residents55.3 62.2 32.9 Median age for Hispanic or Latino residents34.2 31.8
Owner/renter occupied households by race in Sarasota
House owners and renters - White residents 13,219 62.8% Owner occupied7,832 37.2% Renter occupiedHouse owners and renters - Black or African American residents 651 28.4% Owner occupied1,644 71.6% Renter occupiedHouse owners and renters - American Indian / Alaska Native residents 47 100.0% Renter occupiedHouse owners and renters - Asian residents 250 55.9% Owner occupied197 44.1% Renter occupiedHouse owners and renters - Other race residents 349 57.4% Owner occupied259 42.6% Renter occupiedHouse owners and renters - Two or more races residents 803 33.1% Owner occupied1,619 66.9% Renter occupiedHouse owners and renters - White alone residents 12,862 63.5% Owner occupied7,399 36.5% Renter occupiedHouse owners and renters - Hispanic or Latino residents 1,057 36.9% Owner occupied1,805 63.1% Renter occupied
Language usage in Sarasota
English speakers - Total 81.7% of residents of Sarasota speak English at home.
12.3% of residents speak Spanish at home 3,781 54.0% Speak English very well3,216 46.0% Speak English less than very well5.8% of residents speak other language at home 2,009 61.5% Speak English very well1,256 38.5% Speak English less than very well
English speakers - Born in the United States 94.1% of residents of Sarasota speak English at home.
4.1% of residents speak Spanish at home 1,098 89.0% Speak English very well136 11.0% Speak English less than very well1.7% of residents speak other language at home 395 76.3% Speak English very well123 23.7% Speak English less than very well
English speakers - Native, born elsewhere 48.2% of residents of Sarasota speak English at home.
41.3% of residents speak Spanish at home 354 75.2% Speak English very well117 24.8% Speak English less than very well9.8% of residents speak other language at home 97 86.6% Speak English very well15 13.4% Speak English less than very well
English speakers - Foreign-born 25.6% of residents of Sarasota speak English at home.
45.4% of residents speak Spanish at home 1,350 32.5% Speak English very well2,802 67.5% Speak English less than very well28.0% of residents speak other language at home 1,442 56.3% Speak English very well1,118 43.7% Speak English less than very well
White (Caucasian) - Speak only English Native:
94.6% (33,515)Foreign-born:
32.4% (1,341)
White (Caucasian) - Speak another language Native:
5.0% (1,787)Foreign-born:
67.9% (2,814)
Black or African American - Speak only English Native:
90.1% (5,906)Foreign-born:
31.6% (151)
Black or African American - Speak another language Native:
5.1% (336)Foreign-born:
64.8% (309)
Asian - Speak only English Native:
84.0% (192)Foreign-born:
26.9% (273)
Asian - Speak another language Native:
21.9% (50)Foreign-born:
70.1% (710)
Other race - Speak only English Native:
49.8% (439)Foreign-born:
35.4% (275)
Other race - Speak another language Native:
49.2% (432)Foreign-born:
68.6% (533)
Two or more races - Speak only English Native:
73.5% (3,661)Foreign-born:
12.3% (398)
Two or more races - Speak another language Native:
24.8% (1,235)Foreign-born:
86.9% (2,814)
White alone - Speak only English Native:
96.8% (33,058)Foreign-born:
46.8% (1,359)
White alone - Speak another language Native:
3.2% (1,100)Foreign-born:
52.1% (1,514)
Hispanic or Latino - Speak only English Native:
52.2% (2,499)Foreign-born:
7.4% (328)
Hispanic or Latino - Speak another language Native:
46.2% (2,213)Foreign-born:
92.5% (4,098)
Foreign-born residents in Sarasota 8,042 residents are foreign born (8.0% Latin America , 2.6% Europe , 1.9% Asia ).
This city:
13.8%Florida:
21.1%
Marital status for residents in Sarasota Marital status - White (Caucasian) population 15 years and over
Males 31.0% Never married48.7% Now married1.1% Separated3.8% Widowed15.5% DivorcedFemales 23.0% Never married41.4% Now married1.1% Separated14.8% Widowed19.7% DivorcedWomen who gave birth in the past 12 months Now married:
87.2% (185)Unmarried:
12.8% (27)
Women who did not give birth in the past 12 months Now married:
34.7% (2,247)Unmarried:
65.3% (4,223)
Marital status - Black or African American population 15 years and over
Males 61.0% Never married19.1% Now married1.6% Separated2.9% Widowed15.4% DivorcedFemales 48.0% Never married18.0% Now married5.5% Separated13.2% Widowed15.3% DivorcedWomen who gave birth in the past 12 months Now married:
0.0% (0)Unmarried:
100.0% (147)
Women who did not give birth in the past 12 months Now married:
20.5% (345)Unmarried:
79.5% (1,337)
Marital status - American Indian / Alaska Native population 15 years and over
Males 23.7% Never married57.9% Now married0.0% Separated18.4% Widowed0.0% DivorcedFemales 0.0% Never married100.0% Now married0.0% Separated0.0% Widowed0.0% DivorcedMarital status - Asian population 15 years and over
Males 48.4% Never married43.3% Now married0.0% Separated0.0% Widowed8.3% DivorcedFemales 56.3% Never married28.1% Now married2.4% Separated4.2% Widowed8.9% DivorcedWomen who did not give birth in the past 12 months Now married:
17.2% (72)Unmarried:
82.8% (349)
Marital status - Other race population 15 years and over
Males 28.1% Never married58.4% Now married0.0% Separated0.0% Widowed13.5% DivorcedFemales 19.2% Never married60.3% Now married0.0% Separated1.6% Widowed19.0% DivorcedWomen who gave birth in the past 12 months Now married:
13.3% (6)Unmarried:
86.7% (37)
Women who did not give birth in the past 12 months Now married:
70.9% (331)Unmarried:
29.1% (136)
Marital status - Two or more races population 15 years and over
Males 47.3% Never married42.8% Now married2.9% Separated0.4% Widowed6.6% DivorcedFemales 41.7% Never married40.2% Now married3.8% Separated5.2% Widowed9.1% DivorcedWomen who gave birth in the past 12 months Now married:
30.4% (23)Unmarried:
69.6% (53)
Women who did not give birth in the past 12 months Now married:
38.9% (866)Unmarried:
61.1% (1,363)
Marital status - White alone, not Hispanic / Latino population 15 years and over
Males 30.9% Never married48.1% Now married1.0% Separated4.2% Widowed15.9% DivorcedFemales 22.1% Never married41.2% Now married0.9% Separated15.6% Widowed20.1% DivorcedWomen who gave birth in the past 12 months Now married:
82.8% (138)Unmarried:
17.2% (29)
Women who did not give birth in the past 12 months Now married:
34.3% (1,960)Unmarried:
65.7% (3,755)
Marital status - Hispanic or Latino population 15 years and over
Males 43.8% Never married44.3% Now married2.4% Separated0.0% Widowed9.5% DivorcedFemales 36.8% Never married42.8% Now married2.9% Separated4.0% Widowed13.5% DivorcedWomen who gave birth in the past 12 months Now married:
57.0% (78)Unmarried:
43.0% (59)
Women who did not give birth in the past 12 months Now married:
40.3% (1,118)Unmarried:
59.7% (1,653)
Ancestries in Sarasota
7,414 22.7% American2,138 6.5% German2,090 6.4% English1,651 5.0% Irish1,362 4.2% Italian517 1.6% Polish489 1.5% European270 0.8% Russian264 0.8% Scottish215 0.7% French Canadian212 0.6% Eastern European202 0.6% Swedish198 0.6% Lebanese193 0.6% Canadian186 0.6% Scotch-Irish168 0.5% African162 0.5% Turkish157 0.5% British140 0.4% Hungarian128 0.4% French109 0.3% Iranian102 0.3% Dutch88 0.3% Danish85 0.3% Brazilian83 0.3% Portuguese79 0.2% Swiss72 0.2% Austrian71 0.2% Haitian68 0.2% Scandinavian62 0.2% Lithuanian58 0.2% Norwegian57 0.2% Czech56 0.2% Greek54 0.2% Serbian51 0.2% Jamaican45 0.1% Basque44 0.1% Northern European41 0.1% Bulgarian38 0.1% Czechoslovakian37 0.1% Welsh36 0.1% Yugoslavian34 0.1% Ukrainian32 0.10% Romanian27 0.08% Egyptian27 0.08% Croatian25 0.08% Palestinian25 0.08% Slovak23 0.07% Cape Verdean23 0.07% Zimbabwean15 0.05% Barbadian15 0.05% Moroccan13 0.04% Finnish11 0.03% Slovene10 0.03% Assyrian9 0.03% Armenian9 0.03% Dutch West Indian8 0.02% Slavic
Geographical mobility in Sarasota Same house 1 year ago 32,861 81.8% White (Caucasian)5,529 75.2% Black or African American60 87.2% American Indian / Alaska Native881 71.4% Asian1,331 76.3% Other race7,993 94.4% Two or more races30,500 81.4% White alone, not Hispanic / Latino8,687 90.1% Hispanic or LatinoMoved within same county 2,877 7.2% White / Caucasian1,295 17.6% Black or African American8 12.0% American Indian / Alaska Native64 5.2% Asian189 10.9% Other race195 2.3% Two or more races2,823 7.5% White alone, not Hispanic / Latino344 3.6% Hispanic or LatinoMoved within same state 1,837 4.6% White / Caucasian307 4.2% Black or African American95 7.7% Asian106 6.1% Other race333 3.9% Two or more races1,776 4.7% White alone, not Hispanic / Latino461 4.8% Hispanic or LatinoMoved from different state 2,134 5.3% White / Caucasian221 3.0% Black or African American65 5.3% Asian38 2.2% Other race105 1.2% Two or more races1,944 5.2% White alone, not Hispanic / Latino224 2.3% Hispanic or LatinoMoved from abroad 301 0.7% White130 10.6% Asian34 2.0% Other race316 0.8% White alone, not Hispanic / Latino21 0.2% Hispanic or Latino
Children Nativity (place of birth) in Sarasota
Children under 6 years - Living with two parents Both parents native 540 100.0% NativeBoth parents foreign-born 365 100.0% NativeOne native, one foreign-born parent 144 100.0% NativeChildren under 6 years - Living with one parent Native parent 1,045 100.0% NativeForeign-born parent 136 100.0% NativeChildren 6 to 17 years - Living with two parents Both parents native 1,501 99.0% Native15 1.0% Foreign-bornBoth parents foreign-born 264 44.9% Native325 55.1% Foreign-bornOne native, one foreign-born parent 649 96.9% Native21 3.1% Foreign-bornChildren 6 to 17 years - Living with one parent Native parent 1,582 100.0% NativeForeign-born parent 548 59.7% Native369 40.3% Foreign-born
Place of birth for residents in Sarasota
Grandparents responsible for own grandchildren in Sarasota
Grandparents (30 to 59 years) White / Caucasian 61 16.2% Responsible for grandchildren314 83.8% Not responsible for grandchildrenBlack or African American 30 20.0% Responsible for grandchildren119 80.0% Not responsible for grandchildrenAsian 1 100.0% Not responsible for grandchildrenTwo or more races 45 100.0% Not responsible for grandchildrenWhite alone, not Hispanic / Latino 47 35.0% Responsible for grandchildren88 65.0% Not responsible for grandchildrenHispanic or Latino 25 13.2% Responsible for grandchildren167 86.8% Not responsible for grandchildrenGrandparents (60 years and over) White / Caucasian 93 62.4% Responsible for grandchildren56 37.6% Not responsible for grandchildrenBlack or African American 43 78.2% Responsible for grandchildren12 21.8% Not responsible for grandchildrenAsian 1 94.8% Not responsible for grandchildrenTwo or more races 75 58.2% Responsible for grandchildren54 41.8% Not responsible for grandchildrenWhite alone, not Hispanic / Latino 54 47.6% Responsible for grandchildren59 52.4% Not responsible for grandchildrenHispanic or Latino 83 72.4% Responsible for grandchildren32 27.6% Not responsible for grandchildren