Ocoee, FL (Florida) Houses and Residents
| Ocoee: | $373,717 |
| Florida: | $354,100 |
Total population: 41,073 (Urban population: 23,615, Rural population: 16 (all nonfarm))
Houses: 15,580 (14,696 occupied: 11,369 owner occupied, 4,318 renter occupied)
| % of renters here: | 28% |
| State: | 33% |
Housing density: 1,177 houses/condos per square mile
Median price asked for vacant for-sale houses and condos in 2022: $3,373,189.
Median contract rent in 2022: $1,593 (lower quartile is $1,177, upper quartile is $1,928)
Median rent asked for vacant for-rent units in 2022: $1,762
Median gross rent in Ocoee, FL in 2022: $1,836
Housing units in Ocoee with a mortgage: 7,894 (440 second mortgage, 0 home equity loan, 358 both second mortgage and home equity loan)
Houses without a mortgage: 452
Median household income for houses/condos with a mortgage: $104,200
Median household income for apartments without a mortgage: $75,117
Median monthly housing costs: $1,635
Compare current foreclosures in Ocoee, FL:
| Photo | Address | Area | Beds / Baths | Price | Details |
|---|---|---|---|---|---|

|
#1
Atmore Ter
Ocoee, FL 34761
|
3,076 sq. feet
|
4 baths 5 beds |
show details | |

|
#2
Palmerston Cir
Ocoee, FL 34761
|
2,177 sq. feet
|
3 baths 4 beds |
show details | |

|
#3
Kimberly St
Ocoee, FL 34761
|
1,272 sq. feet
|
2 baths 3 beds |
show details | |

|
#4
Nicole Blvd
Ocoee, FL 34761
|
1,066 sq. feet
|
2 baths 3 beds |
show details | |

|
#5
Robin Holly St
Ocoee, FL 34761
|
1,570 sq. feet
|
2 baths 3 beds |
show details | |

|
#6
Douglas Edward Dr
Ocoee, FL 34761
|
2,920 sq. feet
|
2 baths 4 beds |
show details | |

|
#7
Jamber Dr
Ocoee, FL 34761
|
2,573 sq. feet
|
3 baths 3 beds |
show details | |

|
#8
Olympia Park Cir
Ocoee, FL 34761
|
2,738 sq. feet
|
2 baths 4 beds |
show details | |

|
#9
Scarlatti Ct
Ocoee, FL 34761
|
1,526 sq. feet
|
2 baths 3 beds |
show details | |

|
#10
Fullers Cross Rd
Ocoee, FL 34761
|
1,620 sq. feet
|
2 baths 3 beds |
show details |
| Photo | Address | Area | Beds / Baths | Price | Details |
|---|---|---|---|---|---|

|
#11
Plumberry Ave
Ocoee, FL 34761
|
3,807 sq. feet
|
4 baths 5 beds |
show details | |

|
#12
Marotta Loop
Ocoee, FL 34761
|
1,551 sq. feet
|
2 baths 3 beds |
show details | |

|
#13
Forrest Crest Ct
Ocoee, FL 34761
|
2,445 sq. feet
|
2 baths 4 beds |
show details | |

|
#14
Sawmill Blvd
Ocoee, FL 34761
|
1,761 sq. feet
|
2 baths 4 beds |
show details | |

|
#15
10th Ave
Ocoee, FL 34761
|
1,262 sq. feet
|
2 baths 3 beds |
show details | |

|
#16
Bridge Creek Blvd
Ocoee, FL 34761
|
1,874 sq. feet
|
2 baths 4 beds |
show details | |

|
#17
Olympia Park Cir
Ocoee, FL 34761
|
2,333 sq. feet
|
3 baths 4 beds |
show details | |

|
#18
Otter Tail Ct
Ocoee, FL 34761
|
2,545 sq. feet
|
3 baths 4 beds |
show details | |

|
#19
Doreen Ave
Ocoee, FL 34761
|
1,247 sq. feet
|
1 baths 3 beds |
show details | |

|
#20
Fawnwood Dr
Ocoee, FL 34761
|
3,662 sq. feet
|
3 baths 4 beds |
show details |
| Photo | Address | Area | Beds / Baths | Price | Details |
|---|---|---|---|---|---|

|
#21
Tuscany Mill Way
Ocoee, FL 34761
|
3,234 sq. feet
|
4 baths 6 beds |
show details | |

|
#22
Timber Hawk Cir
Ocoee, FL 34761
|
1,510 sq. feet
|
2 baths 3 beds |
show details | |

|
#23
Fortanini Cir
Ocoee, FL 34761
|
1,656 sq. feet
|
2 baths 3 beds |
show details | |

|
#24
Palio Ct
Ocoee, FL 34761
|
3,227 sq. feet
|
3 baths 4 beds |
show details | |

|
#25
Cimarosa Ct
Ocoee, FL 34761
|
2,380 sq. feet
|
3 baths 4 beds |
show details | |

|
#26
Fortanini Cir
Ocoee, FL 34761
|
1,549 sq. feet
|
2 baths 3 beds |
show details | |

|
#27
Gretchen Drive
Ocoee, FL 34761
|
1,675 sq. feet
|
2 baths 3 beds |
show details | |

|
#28
Westyn Bay Blvd
Ocoee, FL 34761
|
3,919 sq. feet
|
3 baths 4 beds |
show details | |

|
#29
Olympia Park Cir
Ocoee, FL 34761
|
2,736 sq. feet
|
2 baths 4 beds |
show details | |

|
#30
Rachels Ridge Loop
Ocoee, FL 34761
|
2,746 sq. feet
|
3 baths 5 beds |
show details |
| Photo | Address | Area | Beds / Baths | Price | Details |
|---|---|---|---|---|---|

|
#31
Lady Ave
Ocoee, FL 34761
|
851 sq. feet
|
1 baths 3 beds |
show details | |

|
#32
Fortanini Cir
Ocoee, FL 34761
|
1,492 sq. feet
|
2 baths 3 beds |
show details | |

|
#33
Spruce Pine Rd
Ocoee, FL 34761
|
2,141 sq. feet
|
3 baths 3 beds |
show details | |

|
#34
Lake Johio Dr
Ocoee, FL 34761
|
2,977 sq. feet
|
2 baths 4 beds |
show details | |

|
#35
Darkwood Ave
Ocoee, FL 34761
|
1,770 sq. feet
|
2 baths 3 beds |
show details | |

|
#36
Roberts Rise Dr
Ocoee, FL 34761
|
1,672 sq. feet
|
2 baths 3 beds |
show details | |

|
#37
Sparrow Song Ln
Ocoee, FL 34761
|
2,928 sq. feet
|
2 baths 4 beds |
show details | |

|
#38
Kimball Dr
Ocoee, FL 34761
|
1,225 sq. feet
|
1 baths 3 beds |
show details | |

|
#39
Donahue Dr
Ocoee, FL 34761
|
1,874 sq. feet
|
2 baths 3 beds |
show details | |

|
#40
Log Jam Ct
Ocoee, FL 34761
|
1,587 sq. feet
|
2 baths 3 beds |
show details |
| Photo | Address | Area | Beds / Baths | Price | Details |
|---|---|---|---|---|---|

|
#41
Glenhaven Cir
Ocoee, FL 34761
|
2,288 sq. feet
|
2 baths 3 beds |
show details | |

|
#42
Ayden Oak Ln
Ocoee, FL 34761
|
2,706 sq. feet
|
4 baths 4 beds |
show details | |

|
#43
Misty Meadow Dr
Ocoee, FL 34761
|
2,068 sq. feet
|
2 baths 4 beds |
show details | |

|
#44
Plumberry Ave
Ocoee, FL 34761
|
4,279 sq. feet
|
5 baths 6 beds |
show details | |

|
#45
Quiet Waters Loop
Ocoee, FL 34761
|
1,611 sq. feet
|
2 baths 3 beds |
show details | |

|
#46
Lyman St
Ocoee, FL 34761
|
1,197 sq. feet
|
1 baths 3 beds |
show details | |

|
#47
Milkweed St
Ocoee, FL 34761
|
1,481 sq. feet
|
2 baths 3 beds |
show details | |

|
#48
Century Oak Dr
Ocoee, FL 34761
|
2,062 sq. feet
|
2 baths 3 beds |
show details | |

|
#49
Starbird Dr
Ocoee, FL 34761
|
2,064 sq. feet
|
2 baths 4 beds |
show details | |

|
Check over 1 million property listings on Foreclosure.com!
|
browse all offers | |||

Latest news about housing in Ocoee, FL collected exclusively by city-data.com from local newspapers, TV, and radio stations


Median year apartment built: 1997
Household type by relationship:
Households: 48,128- Male householders: 7,722 (1,247 living alone), Female householders: 6,652 (1,099 living alone)
8,331 spouses (8,262 opposite-sex spouses), 1,433 unmarried partners, (1,369 opposite-sex unmarried partners), 16,710 children (15,821 natural, 224 adopted, 663 stepchildren), 1,145 grandchildren, 914 brothers or sisters, 1,711 parents, 36 foster children, 1,176 other relatives, 2,000 non-relatives
- In group quarters: 291
Size of family households: 3,150 2-persons, 3,207 3-persons, 3,016 4-persons, 1,664 5-persons, 571 6-persons, 453 7-or-more-persons.
Size of nonfamily households: 2,592 1-person, 898 2-persons, 78 3-persons.
8,915 married couples with children.
2,033 single-parent households (696 men, 1,337 women).
69.6% of residents of Ocoee speak English at home.
19.9% of residents speak Spanish at home (63% speak English very well, 16% speak English well, 11% speak English not well, 10% don't speak English at all).
6.4% of residents speak other Indo-European language at home (75% speak English very well, 16% speak English well, 5% speak English not well, 4% don't speak English at all).
2.9% of residents speak Asian or Pacific Island language at home (38% speak English very well, 36% speak English well, 26% speak English not well, 1% don't speak English at all).
0.9% of residents speak other language at home (31% speak English very well, 60% speak English well, 5% speak English not well, 4% don't speak English at all).
Foreign born population: 11,571 (24.0%)
(61.5% of them are naturalized citizens)
| Here: | 6.6 |
| State: | 5.9 |
| Here: | 4.9 |
| State: | 4.2 |

- Bedrooms in owner-occupied houses and condos in Ocoee, Florida
- 0no bedroom
- 571 bedroom
- 7522 bedrooms
- 5,1273 bedrooms
- 4,2634 bedrooms
- 1,1725+ bedrooms

- Bedrooms in renter-occupied apartments in Ocoee, Florida
- 211no bedroom
- 6001 bedroom
- 1,1482 bedrooms
- 1,5163 bedrooms
- 7704 bedrooms
- 735+ bedrooms

- Cars and other vehicles available in Ocoee in owner-occupied houses/condos
- 144no vehicle
- 2,6181 vehicle
- 5,5172 vehicles
- 1,9513 vehicles
- 7804 vehicles
- 3605+ vehicles

- Cars and other vehicles available in Ocoee in renter-occupied apartments
- 311no vehicle
- 1,8041 vehicle
- 1,8232 vehicles
- 2803 vehicles
- 894 vehicles
- 125+ vehicles

- Rooms in owner-occupied houses in Ocoee, Florida
- 01 room
- 572 rooms
- 1933 rooms
- 5164 rooms
- 2,1415 rooms
- 2,6096 rooms
- 2,1887 rooms
- 1,7978 rooms
- 1,8689+ rooms

- Rooms in renter-occupied apartments in Ocoee, Florida
- 2111 room
- 2942 rooms
- 5593 rooms
- 6844 rooms
- 1,0805 rooms
- 7596 rooms
- 4727 rooms
- 1778 rooms
- 839+ rooms


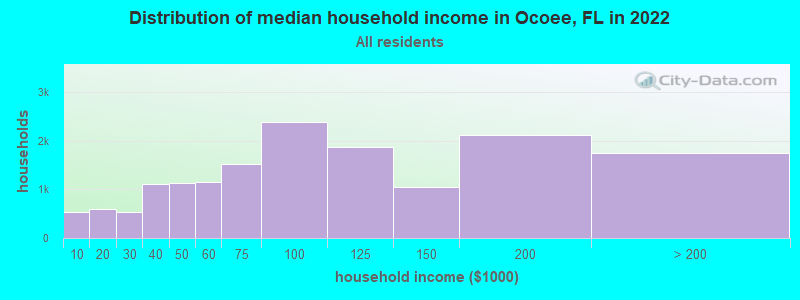
Ocoee, FL household income distribution

- 539Less than $10,000
- 594$10,000 to $19,999
- 543$20,000 to $29,999
- 1,117$30,000 to $39,999
- 1,136$40,000 to $49,999
- 1,140$50,000 to $59,999
- 1,521$60,000 to $74,999
- 2,380$75,000 to $99,999
- 1,860$100,000 to $124,999
- 1,043$125,000 to $149,999
- 2,104$150,000 to $199,999
- 1,737$200,000 or more
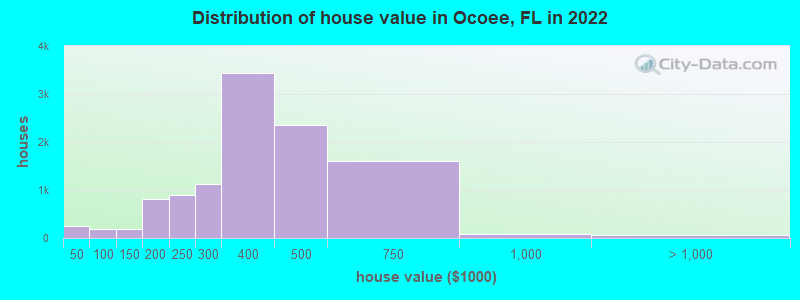
Home value of owner - occupied houses in 2022 in Ocoee, FL
-
- 67Less than $10,000
- 22$15,000 to $19,999
- 36$20,000 to $24,999
- 31$25,000 to $29,999
- 29$30,000 to $34,999
- 57$40,000 to $49,999
- 10$50,000 to $59,999
- 8$70,000 to $79,999
- 13$80,000 to $89,999
- 90$90,000 to $99,999
- 80$100,000 to $124,999
- 101$125,000 to $149,999
- 327$150,000 to $174,999
- 475$175,000 to $199,999
- 905$200,000 to $249,999
- 1,132$250,000 to $299,999
- 3,430$300,000 to $399,999
- 2,363$400,000 to $499,999
- 1,595$500,000 to $749,999
- 82$750,000 to $999,999
- 55$1,000,000 to $1,499,999
- 14$2,000,000 or more
Rent paid by renters in 2022 in Ocoee, FL
-
- 32$150 to $199
- 33$200 to $249
- 5$250 to $299
- 5$350 to $399
- 59$550 to $599
- 14$600 to $649
- 59$700 to $749
- 175$750 to $799
- 98$800 to $899
- 142$900 to $999
- 496$1,000 to $1,249
- 712$1,250 to $1,499
- 1,835$1,500 to $1,999
- 362$2,000 to $2,499
- 324$2,500 to $2,999
- 39No cash rent


Percentage of workers working in this county: 87.5%
Number of people working at home: 4,193 (16.8% of all workers)
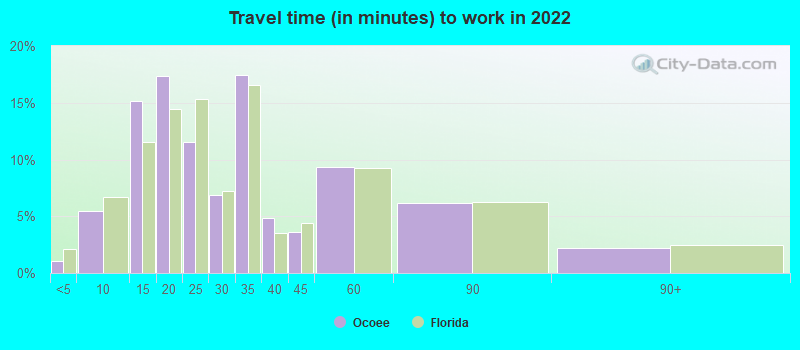
Travel time to work (commute)
- Less than 5 minutes: 216
- 5 to 9 minutes: 573
- 10 to 14 minutes: 2,177
- 15 to 19 minutes: 2,331
- 20 to 24 minutes: 3,016
- 25 to 29 minutes: 1,802
- 30 to 34 minutes: 4,536
- 35 to 39 minutes: 1,069
- 40 to 44 minutes: 833
- 45 to 59 minutes: 1,989
- 60 to 89 minutes: 690
- 90 or more minutes: 831
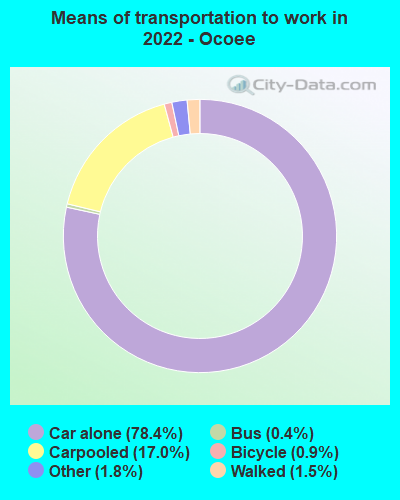
Means of transportation to work:
- Drove a car alone: 11,730 (62.1%)
- Carpooled: 2,705 (14.3%)
- Bus: 63 (0.3%)
- Taxi: 292 (1.5%)
- Bicycle: 88 (0.5%)
- Walked: 300 (1.6%)
- Worked at home: 4,193 (22.2%)

- Unemployment by race in 2022
- Unemployment rate for White non-Hispanic residents
- 0.9%Males
- 6.9%Females
- Unemployment rate for Black residents
- 4.1%Males
- 3.2%Females
- Unemployment rate for American Indian and Alaska Native residents
- 21.8%Males
- Unemployment rate for Asian residents
- 0.9%Males
- 5.4%Females
- Unemployment rate for other race residents
- 5.5%Males
- 1.0%Females
- Unemployment rate for two or more race residents
- 4.3%Males
- 3.9%Females
- Unemployment rate for Hispanic or Latino residents
- 4.4%Males
- 5.9%Females

- Year of entry for the foreign-born population in Ocoee, Florida
- 3,2852010 or later
- 3,1852000 to 2009
- 1,8021990 to 1999
- 8771980 to 1989
- 6141970 to 1979
- 392Before 1970

First ancestries reported:
- American: 3,207 (11.7%)
- Haitian: 1,953 (7.1%)
- Italian: 1,412 (5.1%)
- English: 1,183 (4.3%)
- Jamaican: 1,158 (4.2%)
- Irish: 774 (2.8%)
- Brazilian: 628 (2.3%)
- German: 585 (2.1%)
- Guyanese: 396 (1.4%)
- Polish: 357 (1.3%)
- European: 326 (1.2%)
- African: 182 (0.7%)
- French Canadian: 136 (0.5%)
- West Indian: 121 (0.4%)
- Trinidadian and Tobagonian: 117 (0.4%)
- Greek: 105 (0.4%)
- Barbadian: 104 (0.4%)
- Slovak: 89 (0.3%)
- Norwegian: 82 (0.3%)
- Nigerian: 78 (0.3%)
- Scottish: 76 (0.3%)
- Scotch-Irish: 71 (0.3%)
- Russian: 65 (0.2%)
- French: 64 (0.2%)
- British: 61 (0.2%)
- Portuguese: 49 (0.2%)
- Dutch: 30 (0.1%)
- Scandinavian: 26 (0.09%)
- Northern European: 24 (0.09%)
- Lebanese: 23 (0.08%)
- Eastern European: 23 (0.08%)
- Swedish: 21 (0.08%)
- Egyptian: 21 (0.08%)
- Danish: 20 (0.07%)
- Canadian: 19 (0.07%)
- Serbian: 19 (0.07%)
- Lithuanian: 18 (0.07%)
- Ukrainian: 14 (0.05%)
- Iranian: 12 (0.04%)
- Syrian: 11 (0.04%)
- Belgian: 10 (0.04%)
- Bulgarian: 2 (0.01%)
Most common places of birth for foreign-born residents (%):
| Ocoee: | 13.3% (1,514) |
| Florida: | 5.6% (257,152) |
| Ocoee: | 11.1% (1,264) |
| Florida: | 2.1% (97,632) |
| Ocoee: | 10.1% (1,152) |
| Florida: | 7.5% (342,375) |
| Ocoee: | 8.8% (998) |
| Florida: | 5.0% (227,319) |
| Ocoee: | 6.8% (775) |
| Florida: | 0.7% (33,556) |
| Ocoee: | 5.7% (653) |
| Florida: | 5.7% (262,042) |
| Ocoee: | 5.4% (615) |
| Florida: | 3.0% (137,727) |
| Ocoee: | 5.4% (614) |
| Florida: | 2.7% (122,906) |
| Ocoee: | 3.8% (434) |
| Florida: | 1.3% (60,604) |
| Ocoee: | 2.7% (310) |
| Florida: | 1.2% (56,071) |
| Ocoee: | 2.7% (308) |
| Florida: | 6.5% (298,669) |
| Ocoee: | 2.6% (300) |
| Florida: | 2.1% (94,349) |
| Ocoee: | 2.3% (266) |
| Florida: | 1.0% (43,642) |
| Ocoee: | 2.2% (251) |
| Florida: | 1.8% (84,403) |
| Ocoee: | 1.9% (214) |
| Florida: | 0.5% (22,972) |
| Ocoee: | 1.8% (205) |
| Florida: | 1.1% (49,838) |
| Ocoee: | 1.5% (174) |
| Florida: | 0.1% (2,354) |
Place of birth for U.S.-born residents:
- This state: 19,933
- Other state: 15,126
- Northeast: 6,587
- Midwest: 3,461
- South: 3,697
- West: 1,366
87.7% of Ocoee residents lived in the same house 1 years ago.
Out of people who lived in different houses, 36.4% lived in this county.
Out of people who lived in different counties, 51.3% lived in Florida.
| Ocoee: | 87.7% |
| State average: | 86.3% |
Education attainment for males 25 years and older:
- No schooling: 423
- Nursery to 4th grade: 115
- 5th and 6th grade: 321
- 7th and 8th grade: 335
- 9th grade: 119
- 10th grade: 238
- 11th grade: 665
- 12th grade, no diploma: 441
- High school graduate (or equivalency): 3,244
- Less than 1 year of college: 1,469
- Some college more than 1 year, no degree: 1,804
- Associate degree: 1,463
- Bachelor's degree: 3,742
- Master's degree: 1,084
- Professional school degree: 185
- Doctorate degree: 69

Education attainment for females 25 years and older:
- No schooling: 472
- Nursery to 4th grade: 243
- 5th and 6th grade: 181
- 7th and 8th grade: 387
- 9th grade: 68
- 10th grade: 30
- 11th grade: 193
- 12th grade, no diploma: 625
- High school graduate (or equivalency): 3,811
- Less than 1 year of college: 1,149
- Some college more than 1 year, no degree: 1,756
- Associate degree: 1,540
- Bachelor's degree: 3,532
- Master's degree: 1,534
- Professional school degree: 199
- Doctorate degree: 91


Housing units in structures:
- One, detached: 12,356
- One, attached: 941
- Two: 11
- 3 or 4: 228
- 5 to 9: 298
- 10 to 19: 643
- 20 to 49: 361
- 50 or more: 356
- Mobile homes: 354
- Boats, RVs, vans, etc.: 27
Housing units lacking complete kitchen facilities in 2022: 0.6%
House/condo owner moved in on average 11 years ago
Renter moved in on average 4 years ago

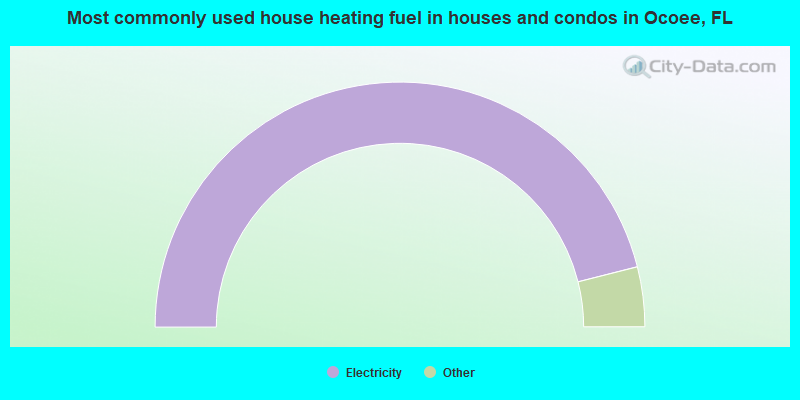
- 92.1%Electricity
- 3.0%Utility gas
- 2.0%Solar energy
- 1.6%Bottled, tank, or LP gas
- 1.4%No fuel used
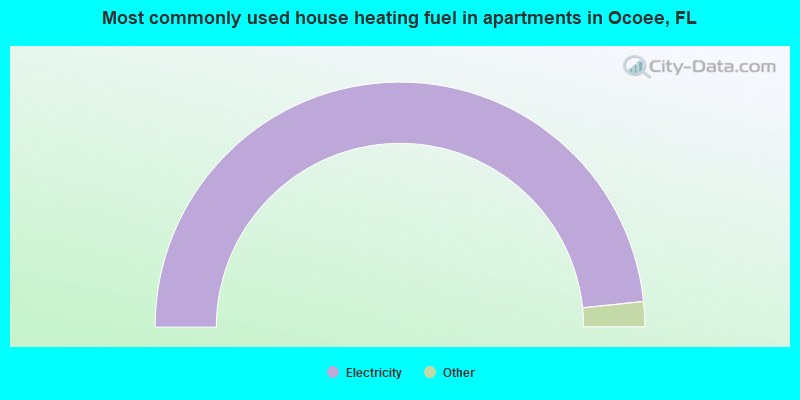
- 96.7%Electricity
- 2.0%No fuel used
- 1.3%Utility gas
Private vs. public school enrollment:
| Here: | 15.7% |
| Florida: | 15.8% |
| Here: | 12.3% |
| Florida: | 12.9% |
| Here: | 37.1% |
| Florida: | 23.6% |


