Races in Ocoee, Florida (FL) Detailed Stats
Data:
Races - White alone (%)
Races - White alone (% change since 2000)
Races - Black alone (%)
Races - Black alone (% change since 2000)
Races - American Indian alone (%)
Races - American Indian alone (% change since 2000)
Races - Asian alone (%)
Races - Asian alone (% change since 2000)
Races - Hispanic (%)
Races - Hispanic (% change since 2000)
Races - Native Hawaiian and Other Pacific Islander alone (%)
Races - Native Hawaiian and Other Pacific Islander alone (% change since 2000)
Races - Two or more races(%)
Races - Two or more races(% change since 2000)
Races - Other race alone (%)
Races - Other race alone (% change since 2000)
Racial diversity
Place of birth - Born in state of residence (%)
Place of birth - Born in state of residence (%) - White
Place of birth - Born in state of residence (%) - Black or African American
Place of birth - Born in state of residence (%) - Asian
Place of birth - Born in state of residence (%) - Hispanic or Latino
Place of birth - Born in state of residence (%) - American Indian and Alaska Native
Place of birth - Born in state of residence (%) - Multirace
Place of birth - Born in state of residence (%) - Other Race
Place of birth - Born in other state (%)
Place of birth - Born in other state (%) - White
Place of birth - Born in other state (%) - Black or African American
Place of birth - Born in other state (%) - Asian
Place of birth - Born in other state (%) - Hispanic or Latino
Place of birth - Born in other state (%) - American Indian and Alaska Native
Place of birth - Born in other state (%) - Multirace
Place of birth - Born in other state (%) - Other Race
Place of birth - Native, outside of US (%)
Place of birth - Native, outside of US (%) - White
Place of birth - Native, outside of US (%) - Black or African American
Place of birth - Native, outside of US (%) - Asian
Place of birth - Native, outside of US (%) - Hispanic or Latino
Place of birth - Native, outside of US (%) - American Indian and Alaska Native
Place of birth - Native, outside of US (%) - Multirace
Place of birth - Native, outside of US (%) - Other Race
Place of birth - Foreign born (%)
Place of birth - Foreign born (%) - White
Place of birth - Foreign born (%) - Black or African American
Place of birth - Foreign born (%) - Asian
Place of birth - Foreign born (%) - Hispanic or Latino
Place of birth - Foreign born (%) - American Indian and Alaska Native
Place of birth - Foreign born (%) - Multirace
Place of birth - Foreign born (%) - Other Race
Residents speaking English at home (%)
Residents speaking English at home - Born in the United States (%)
Residents speaking English at home - Native, born elsewhere (%)
Residents speaking English at home - Foreign born (%)
Residents speaking Spanish at home (%)
Residents speaking Spanish at home - Born in the United States (%)
Residents speaking Spanish at home - Native, born elsewhere (%)
Residents speaking Spanish at home - Foreign born (%)
Residents speaking other language at home (%)
Residents speaking other language at home - Born in the United States (%)
Residents speaking other language at home - Native, born elsewhere (%)
Residents speaking other language at home - Foreign born (%)
Marital status - Never married (%)
Marital status - Now married (%)
Marital status - Separated (%)
Marital status - Widowed (%)
Marital status - Divorced (%)
Ancestries Reported - Arab (%)
Ancestries Reported - Czech (%)
Ancestries Reported - Danish (%)
Ancestries Reported - Dutch (%)
Ancestries Reported - English (%)
Ancestries Reported - French (%)
Ancestries Reported - French Canadian (%)
Ancestries Reported - German (%)
Ancestries Reported - Greek (%)
Ancestries Reported - Hungarian (%)
Ancestries Reported - Irish (%)
Ancestries Reported - Italian (%)
Ancestries Reported - Lithuanian (%)
Ancestries Reported - Norwegian (%)
Ancestries Reported - Polish (%)
Ancestries Reported - Portuguese (%)
Ancestries Reported - Russian (%)
Ancestries Reported - Scotch-Irish (%)
Ancestries Reported - Scottish (%)
Ancestries Reported - Slovak (%)
Ancestries Reported - Subsaharan African (%)
Ancestries Reported - Swedish (%)
Ancestries Reported - Swiss (%)
Ancestries Reported - Ukrainian (%)
Ancestries Reported - United States (%)
Ancestries Reported - Welsh (%)
Ancestries Reported - West Indian (%)
Ancestries Reported - Other (%)
Geographical mobility - Same house 1 year ago (%)
Geographical mobility - Same house 1 year ago (%) - White
Geographical mobility - Same house 1 year ago (%) - Black or African American
Geographical mobility - Same house 1 year ago (%) - Asian
Geographical mobility - Same house 1 year ago (%) - Hispanic or Latino
Geographical mobility - Same house 1 year ago (%) - American Indian and Alaska Native
Geographical mobility - Same house 1 year ago (%) - Multirace
Geographical mobility - Same house 1 year ago (%) - Other Race
Geographical mobility - Moved within same county (%)
Geographical mobility - Moved within same county (%) - White
Geographical mobility - Moved within same county (%) - Black or African American
Geographical mobility - Moved within same county (%) - Asian
Geographical mobility - Moved within same county (%) - Hispanic or Latino
Geographical mobility - Moved within same county (%) - American Indian and Alaska Native
Geographical mobility - Moved within same county (%) - Multirace
Geographical mobility - Moved within same county (%) - Other Race
Geographical mobility - Moved from different county within same state (%)
Geographical mobility - Moved from different county within same state (%) - White
Geographical mobility - Moved from different county within same state (%) - Black or African American
Geographical mobility - Moved from different county within same state (%) - Asian
Geographical mobility - Moved from different county within same state (%) - Hispanic or Latino
Geographical mobility - Moved from different county within same state (%) - American Indian and Alaska Native
Geographical mobility - Moved from different county within same state (%) - Multirace
Geographical mobility - Moved from different county within same state (%) - Other Race
Geographical mobility - Moved from different state (%)
Geographical mobility - Moved from different state (%) - White
Geographical mobility - Moved from different state (%) - Black or African American
Geographical mobility - Moved from different state (%) - Asian
Geographical mobility - Moved from different state (%) - Hispanic or Latino
Geographical mobility - Moved from different state (%) - American Indian and Alaska Native
Geographical mobility - Moved from different state (%) - Multirace
Geographical mobility - Moved from different state (%) - Other Race
Geographical mobility - Moved from abroad (%)
Geographical mobility - Moved from abroad (%) - White
Geographical mobility - Moved from abroad (%) - Black or African American
Geographical mobility - Moved from abroad (%) - Asian
Geographical mobility - Moved from abroad (%) - Hispanic or Latino
Geographical mobility - Moved from abroad (%) - American Indian and Alaska Native
Geographical mobility - Moved from abroad (%) - Multirace
Geographical mobility - Moved from abroad (%) - Other Race
Place of birth for the foreign-born population - Ireland (%)
Place of birth for the foreign-born population - Denmark (%)
Place of birth for the foreign-born population - Norway (%)
Place of birth for the foreign-born population - Sweden (%)
Place of birth for the foreign-born population - United Kingdom (%)
Place of birth for the foreign-born population - England (%)
Place of birth for the foreign-born population - Scotland (%)
Place of birth for the foreign-born population - Other Northern Europe (%)
Place of birth for the foreign-born population - Austria (%)
Place of birth for the foreign-born population - Belgium (%)
Place of birth for the foreign-born population - France (%)
Place of birth for the foreign-born population - Germany (%)
Place of birth for the foreign-born population - Netherlands (%)
Place of birth for the foreign-born population - Switzerland (%)
Place of birth for the foreign-born population - Other Western Europe (%)
Place of birth for the foreign-born population - Greece (%)
Place of birth for the foreign-born population - Italy (%)
Place of birth for the foreign-born population - Portugal (%)
Place of birth for the foreign-born population - Spain (%)
Place of birth for the foreign-born population - Other Southern Europe (%)
Place of birth for the foreign-born population - Albania (%)
Place of birth for the foreign-born population - Belarus (%)
Place of birth for the foreign-born population - Bosnia and Herzegovina (%)
Place of birth for the foreign-born population - Bulgaria (%)
Place of birth for the foreign-born population - Croatia (%)
Place of birth for the foreign-born population - Czechoslovakia (%)
Place of birth for the foreign-born population - Hungary (%)
Place of birth for the foreign-born population - Latvia (%)
Place of birth for the foreign-born population - Lithuania (%)
Place of birth for the foreign-born population - North Macedonia (Macedonia) (%)
Place of birth for the foreign-born population - Moldova (%)
Place of birth for the foreign-born population - Poland (%)
Place of birth for the foreign-born population - Romania (%)
Place of birth for the foreign-born population - Russia (%)
Place of birth for the foreign-born population - Serbia (%)
Place of birth for the foreign-born population - Ukraine (%)
Place of birth for the foreign-born population - Other Eastern Europe (%)
Place of birth for the foreign-born population - China (%)
Place of birth for the foreign-born population - Hong Kong (%)
Place of birth for the foreign-born population - Taiwan (%)
Place of birth for the foreign-born population - Japan (%)
Place of birth for the foreign-born population - Korea (%)
Place of birth for the foreign-born population - Other Eastern Asia (%)
Place of birth for the foreign-born population - Afghanistan (%)
Place of birth for the foreign-born population - Bangladesh (%)
Place of birth for the foreign-born population - India (%)
Place of birth for the foreign-born population - Iran (%)
Place of birth for the foreign-born population - Kazakhstan (%)
Place of birth for the foreign-born population - Nepal (%)
Place of birth for the foreign-born population - Pakistan (%)
Place of birth for the foreign-born population - Sri Lanka (%)
Place of birth for the foreign-born population - Uzbekistan (%)
Place of birth for the foreign-born population - Other South Central Asia (%)
Place of birth for the foreign-born population - Burma (%)
Place of birth for the foreign-born population - Cambodia (%)
Place of birth for the foreign-born population - Indonesia (%)
Place of birth for the foreign-born population - Laos (%)
Place of birth for the foreign-born population - Malaysia (%)
Place of birth for the foreign-born population - Philippines (%)
Place of birth for the foreign-born population - Singapore (%)
Place of birth for the foreign-born population - Thailand (%)
Place of birth for the foreign-born population - Vietnam (%)
Place of birth for the foreign-born population - Other South Eastern Asia (%)
Place of birth for the foreign-born population - Armenia (%)
Place of birth for the foreign-born population - Iraq (%)
Place of birth for the foreign-born population - Israel (%)
Place of birth for the foreign-born population - Jordan (%)
Place of birth for the foreign-born population - Kuwait (%)
Place of birth for the foreign-born population - Lebanon (%)
Place of birth for the foreign-born population - Saudi Arabia (%)
Place of birth for the foreign-born population - Syria (%)
Place of birth for the foreign-born population - Turkey (%)
Place of birth for the foreign-born population - Yemen (%)
Place of birth for the foreign-born population - Other Western Asia (%)
Place of birth for the foreign-born population - Eritrea (%)
Place of birth for the foreign-born population - Ethiopia (%)
Place of birth for the foreign-born population - Kenya (%)
Place of birth for the foreign-born population - Somalia (%)
Place of birth for the foreign-born population - Uganda (%)
Place of birth for the foreign-born population - Zimbabwe (%)
Place of birth for the foreign-born population - Other Eastern Africa (%)
Place of birth for the foreign-born population - Cameroon (%)
Place of birth for the foreign-born population - Congo (%)
Place of birth for the foreign-born population - Democratic Republic of Congo (Zaire) (%)
Place of birth for the foreign-born population - Other Middle Africa (%)
Place of birth for the foreign-born population - Egypt (%)
Place of birth for the foreign-born population - Morocco (%)
Place of birth for the foreign-born population - Sudan (%)
Place of birth for the foreign-born population - Other Northern Africa (%)
Place of birth for the foreign-born population - South Africa (%)
Place of birth for the foreign-born population - Other Southern Africa (%)
Place of birth for the foreign-born population - Cabo Verde (%)
Place of birth for the foreign-born population - Ghana (%)
Place of birth for the foreign-born population - Liberia (%)
Place of birth for the foreign-born population - Nigeria (%)
Place of birth for the foreign-born population - Senegal (%)
Place of birth for the foreign-born population - Sierra Leone (%)
Place of birth for the foreign-born population - Other Western Africa (%)
Place of birth for the foreign-born population - Australia (%)
Place of birth for the foreign-born population - New Zealand (%)
Place of birth for the foreign-born population - Fiji (%)
Place of birth for the foreign-born population - Micronesia (%)
Place of birth for the foreign-born population - Bahamas (%)
Place of birth for the foreign-born population - Barbados (%)
Place of birth for the foreign-born population - Cuba (%)
Place of birth for the foreign-born population - Dominica (%)
Place of birth for the foreign-born population - Dominican Republic (%)
Place of birth for the foreign-born population - Grenada (%)
Place of birth for the foreign-born population - Haiti (%)
Place of birth for the foreign-born population - Jamaica (%)
Place of birth for the foreign-born population - St. Vincent and the Grenadines (%)
Place of birth for the foreign-born population - Trinidad and Tobago (%)
Place of birth for the foreign-born population - West Indies (%)
Place of birth for the foreign-born population - Other Caribbean (%)
Place of birth for the foreign-born population - Belize (%)
Place of birth for the foreign-born population - Costa Rica (%)
Place of birth for the foreign-born population - El Salvador (%)
Place of birth for the foreign-born population - Guatemala (%)
Place of birth for the foreign-born population - Honduras (%)
Place of birth for the foreign-born population - Mexico (%)
Place of birth for the foreign-born population - Nicaragua (%)
Place of birth for the foreign-born population - Panama (%)
Place of birth for the foreign-born population - Other Central America (%)
Place of birth for the foreign-born population - Argentina (%)
Place of birth for the foreign-born population - Bolivia (%)
Place of birth for the foreign-born population - Brazil (%)
Place of birth for the foreign-born population - Chile (%)
Place of birth for the foreign-born population - Colombia (%)
Place of birth for the foreign-born population - Ecuador (%)
Place of birth for the foreign-born population - Guyana (%)
Place of birth for the foreign-born population - Peru (%)
Place of birth for the foreign-born population - Uruguay (%)
Place of birth for the foreign-born population - Venezuela (%)
Place of birth for the foreign-born population - Other South America (%)
Place of birth for the foreign-born population - Canada (%)
Place of birth for the foreign-born population - Other Northern America (%)
Place of birth for the foreign-born population - Other (%)
Latest news about races in Ocoee, FL collected exclusively by city-data.com from local newspapers, TV, and radio stations
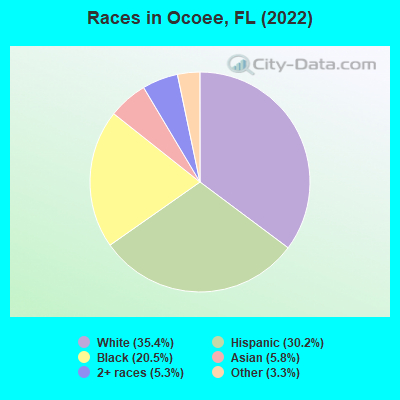
According to 2022 data, the most numerous races in Ocoee, FL are White alone (17,046 residents), Hispanic (14,555 residents), and Black alone (9,850 residents). 69.5% of Ocoee residents speak English at home. 23.7% of Ocoee, FL residents are foreign-born (17.9% born in Latin America, 3.3% born in Asia), which is 11.3% greater than the foreign-born rate of 21.0% across the entire state of Florida.
Race distribution in Ocoee
2000 2022
10,458,509 65.4% White alone 2,682,715 16.8% Hispanic 2,264,268 14.2% Black alone 261,693 1.6% Asian alone 236,954 1.5% Two or more races 42,358 0.3% American Indian alone 28,994 0.2% Other race alone 6,887 0.04% Native Hawaiian and Other
11,309,403 50.8% White alone 6,025,039 27.1% Hispanic 3,241,015 14.6% Black alone 861,630 3.9% Two or more races 623,692 2.8% Asian alone 152,054 0.7% Other race alone 22,504 0.1% American Indian alone 9,486 0.04% Native Hawaiian and Other
Income and house value in Ocoee Median household income in 2022 $92,567 White non-Hispanic householders$95,165 Black householders$104,980 Asian householders$58,680 Some other race householders$77,250 Two or more races householders$82,960 Hispanic or Latino race householdersMedian 2022 house value $364,186 White Non-Hispanic householders$412,177 Black or African American householders$467,996 American Indian or Alaska Native householders $446,213 Asian householders$342,063 Some other race householders$478,548 Two or more races householders$374,397 Hispanic or Latino householders
Median age by race in Ocoee
40.9 Median age for White residents43.4 38.3 33.5 Median age for Black or African American residents33.6 33.5 26.4 Median age for American Indian / Alaska Native residents30.9 30.4 43.7 Median age for Asian residents45.8 43.6 -679,790,025.6 Median age for Native Hawaiian / Pacific Islander residents-1,327,635,326.3 -611,111,110.5 30.1 Median age for Other race residents29.7 30.9 29.6 Median age for Two or more races residents29.0 29.7 42.6 Median age for White alone residents43.0 42.7 30.0 Median age for Hispanic or Latino residents31.4 27.3
Owner/renter occupied households by race in Ocoee
House owners and renters - White residents 5,183 73.6% Owner occupied1,861 26.4% Renter occupiedHouse owners and renters - Black or African American residents 2,361 75.9% Owner occupied751 24.1% Renter occupiedHouse owners and renters - American Indian / Alaska Native residents 57 72.1% Owner occupied22 27.9% Renter occupiedHouse owners and renters - Asian residents 917 86.8% Owner occupied139 13.2% Renter occupiedHouse owners and renters - Other race residents 1,604 62.3% Owner occupied969 37.7% Renter occupiedHouse owners and renters - Two or more races residents 1,363 69.9% Owner occupied587 30.1% Renter occupiedHouse owners and renters - White alone residents 4,945 72.8% Owner occupied1,844 27.2% Renter occupiedHouse owners and renters - Hispanic or Latino residents 2,441 62.8% Owner occupied1,446 37.2% Renter occupied
Language usage in Ocoee
English speakers - Total 69.5% of residents of Ocoee speak English at home.
20.1% of residents speak Spanish at home 5,617 62.5% Speak English very well3,373 37.5% Speak English less than very well10.4% of residents speak other language at home 2,708 58.0% Speak English very well1,961 42.0% Speak English less than very well
English speakers - Born in the United States 88.7% of residents of Ocoee speak English at home.
9.8% of residents speak Spanish at home 1,296 88.2% Speak English very well174 11.8% Speak English less than very well1.6% of residents speak other language at home 159 67.1% Speak English very well78 32.9% Speak English less than very well
English speakers - Native, born elsewhere 29.6% of residents of Ocoee speak English at home.
66.7% of residents speak Spanish at home 927 78.4% Speak English very well256 21.6% Speak English less than very well9.0% of residents speak other language at home 35 21.9% Speak English very well125 78.1% Speak English less than very well
English speakers - Foreign-born 27.2% of residents of Ocoee speak English at home.
42.4% of residents speak Spanish at home 1,822 37.4% Speak English very well3,056 62.6% Speak English less than very well30.5% of residents speak other language at home 1,788 50.9% Speak English very well1,722 49.1% Speak English less than very well
White (Caucasian) - Speak only English Native:
100.0% (16,108)Foreign-born:
16.6% (156)
White (Caucasian) - Speak another language Native:
4.6% (743)Foreign-born:
82.8% (775)
Black or African American - Speak only English Native:
90.9% (6,360)Foreign-born:
60.0% (1,688)
Black or African American - Speak another language Native:
8.8% (619)Foreign-born:
41.9% (1,178)
American Indian / Alaska Native - Speak another language Native:
100.0% (123)Foreign-born:
68.7% (146)
Asian - Speak only English Native:
63.5% (460)Foreign-born:
25.3% (498)
Asian - Speak another language Native:
36.7% (266)Foreign-born:
74.7% (1,471)
Other race - Speak only English Native:
36.8% (1,555)Foreign-born:
11.9% (509)
Other race - Speak another language Native:
63.9% (2,702)Foreign-born:
86.3% (3,693)
Two or more races - Speak only English Native:
71.1% (3,702)Foreign-born:
17.3% (381)
Two or more races - Speak another language Native:
27.3% (1,422)Foreign-born:
82.5% (1,820)
White alone - Speak only English Native:
97.6% (15,111)Foreign-born:
26.9% (184)
White alone - Speak another language Native:
2.5% (387)Foreign-born:
72.3% (495)
Hispanic or Latino - Speak only English Native:
54.2% (4,400)Foreign-born:
7.5% (370)
Hispanic or Latino - Speak another language Native:
49.2% (3,990)Foreign-born:
92.1% (4,537)
Foreign-born residents in Ocoee 11,400 residents are foreign born (17.9% Latin America , 3.3% Asia ).
This city:
23.7%Florida:
21.1%
Marital status for residents in Ocoee Marital status - White (Caucasian) population 15 years and over
Males 29.6% Never married52.7% Now married2.0% Separated1.2% Widowed14.6% DivorcedFemales 28.2% Never married49.9% Now married0.9% Separated7.3% Widowed13.7% DivorcedWomen who gave birth in the past 12 months Now married:
70.2% (167)Unmarried:
29.8% (71)
Women who did not give birth in the past 12 months Now married:
47.4% (1,903)Unmarried:
52.6% (2,111)
Marital status - Black or African American population 15 years and over
Males 41.0% Never married54.2% Now married0.2% Separated1.6% Widowed3.0% DivorcedFemales 36.4% Never married43.9% Now married3.3% Separated3.9% Widowed12.5% DivorcedWomen who gave birth in the past 12 months Now married:
15.6% (5)Unmarried:
84.4% (27)
Women who did not give birth in the past 12 months Now married:
38.9% (1,005)Unmarried:
61.1% (1,579)
Marital status - American Indian / Alaska Native population 15 years and over
Males 27.7% Never married72.3% Now married0.0% Separated0.0% Widowed0.0% DivorcedFemales 18.6% Never married66.7% Now married14.7% Separated0.0% Widowed0.0% DivorcedWomen who did not give birth in the past 12 months Now married:
67.2% (64)Unmarried:
32.8% (31)
Marital status - Asian population 15 years and over
Males 22.8% Never married73.0% Now married0.0% Separated1.9% Widowed2.3% DivorcedFemales 18.2% Never married66.2% Now married0.0% Separated7.2% Widowed8.4% DivorcedWomen who gave birth in the past 12 months Now married:
100.0% (93)Unmarried:
0.0% (0)
Women who did not give birth in the past 12 months Now married:
55.8% (348)Unmarried:
44.2% (276)
Marital status - Other race population 15 years and over
Males 49.7% Never married42.9% Now married1.4% Separated0.4% Widowed5.6% DivorcedFemales 36.1% Never married43.1% Now married5.4% Separated3.3% Widowed12.1% DivorcedWomen who gave birth in the past 12 months Now married:
81.6% (153)Unmarried:
18.4% (34)
Women who did not give birth in the past 12 months Now married:
43.2% (911)Unmarried:
56.8% (1,198)
Marital status - Two or more races population 15 years and over
Males 36.5% Never married49.2% Now married0.5% Separated2.0% Widowed11.7% DivorcedFemales 46.0% Never married36.1% Now married2.7% Separated4.8% Widowed10.3% DivorcedWomen who gave birth in the past 12 months Now married:
87.5% (120)Unmarried:
12.5% (17)
Women who did not give birth in the past 12 months Now married:
35.9% (835)Unmarried:
64.1% (1,488)
Marital status - White alone, not Hispanic / Latino population 15 years and over
Males 32.2% Never married49.6% Now married1.0% Separated1.4% Widowed15.7% DivorcedFemales 25.5% Never married50.8% Now married1.1% Separated8.3% Widowed14.3% DivorcedWomen who gave birth in the past 12 months Now married:
75.5% (178)Unmarried:
24.5% (58)
Women who did not give birth in the past 12 months Now married:
48.9% (1,851)Unmarried:
51.1% (1,932)
Marital status - Hispanic or Latino population 15 years and over
Males 36.5% Never married52.8% Now married2.1% Separated0.6% Widowed8.0% DivorcedFemales 41.3% Never married39.1% Now married3.7% Separated4.2% Widowed11.7% DivorcedWomen who gave birth in the past 12 months Now married:
78.8% (199)Unmarried:
21.2% (54)
Women who did not give birth in the past 12 months Now married:
38.0% (1,335)Unmarried:
62.0% (2,180)
Ancestries in Ocoee
3,207 11.7% American1,953 7.1% Haitian1,412 5.1% Italian1,183 4.3% English1,158 4.2% Jamaican774 2.8% Irish628 2.3% Brazilian585 2.1% German396 1.4% Guyanese357 1.3% Polish326 1.2% European182 0.7% African136 0.5% French Canadian121 0.4% West Indian117 0.4% Trinidadian and Tobagonian105 0.4% Greek104 0.4% Barbadian89 0.3% Slovak82 0.3% Norwegian78 0.3% Nigerian76 0.3% Scottish71 0.3% Scotch-Irish65 0.2% Russian64 0.2% French61 0.2% British49 0.2% Portuguese30 0.1% Dutch26 0.09% Scandinavian24 0.09% Northern European23 0.08% Lebanese23 0.08% Eastern European21 0.08% Swedish21 0.08% Egyptian20 0.07% Danish19 0.07% Canadian19 0.07% Serbian18 0.07% Lithuanian14 0.05% Ukrainian12 0.04% Iranian11 0.04% Syrian10 0.04% Belgian2 0.01% Bulgarian
Geographical mobility in Ocoee Same house 1 year ago 15,988 90.7% White (Caucasian)8,581 83.0% Black or African American485 100.0% American Indian / Alaska Native2,207 78.6% Asian8,359 90.8% Other race6,661 82.9% Two or more races15,411 91.2% White alone, not Hispanic / Latino12,972 90.7% Hispanic or LatinoMoved within same county 681 3.9% White / Caucasian1,191 11.5% Black or African American107 3.8% Asian549 6.0% Other race706 8.8% Two or more races575 3.4% White alone, not Hispanic / Latino701 4.9% Hispanic or LatinoMoved within same state 474 2.7% White / Caucasian296 2.9% Black or African American287 3.6% Two or more races460 2.7% White alone, not Hispanic / Latino133 0.9% Hispanic or LatinoMoved from different state 466 2.6% White / Caucasian156 1.5% Black or African American229 8.2% Asian81 1.0% Two or more races502 3.0% White alone, not Hispanic / Latino45 0.3% Hispanic or LatinoMoved from abroad 66 0.4% White31 0.3% Black or African American219 7.8% Asian175 1.9% Other race254 3.2% Two or more races19 0.1% White alone, not Hispanic / Latino402 2.8% Hispanic or Latino
Children Nativity (place of birth) in Ocoee
Children under 6 years - Living with two parents Both parents native 1,599 100.0% NativeBoth parents foreign-born 602 89.9% Native68 10.1% Foreign-bornOne native, one foreign-born parent 591 100.0% NativeChildren under 6 years - Living with one parent Native parent 649 100.0% NativeForeign-born parent 307 100.0% NativeChildren 6 to 17 years - Living with two parents Both parents native 3,432 100.0% NativeBoth parents foreign-born 1,703 88.2% Native228 11.8% Foreign-bornOne native, one foreign-born parent 723 91.8% Native65 8.2% Foreign-bornChildren 6 to 17 years - Living with one parent Native parent 1,336 100.0% NativeForeign-born parent 806 52.2% Native737 47.8% Foreign-born
Place of birth for residents in Ocoee 9,017 Americas8,932 Latin America3,330 Caribbean3,305 Central America2,295 South America1,662 Asia742 South Eastern Asia465 Eastern Asia413 South Central Asia388 Europe355 China331 Africa314 Northern Africa190 Northern Europe123 Eastern Europe85 Northern America48 Western Europe41 Western Asia26 Southern Europe16 Eastern Africa1,637 Mexico1,137 Guatemala1,116 Haiti1,054 Jamaica682 Guyana583 Dominican Republic562 Brazil547 Venezuela460 Vietnam355 China307 Colombia290 India261 Trinidad and Tobago238 Philippines201 Panama175 El Salvador155 Cuba128 United Kingdom119 Costa Rica92 Chile88 Pakistan85 Canada78 Japan73 Ecuador56 Bahamas51 Russia44 Thailand34 Honduras33 England32 Germany30 Korea29 Lebanon29 Peru28 Scotland26 Greece25 Egypt17 Belarus15 Lithuania15 Netherlands14 Bangladesh14 Iran13 Poland11 Georgia10 Serbia7 Ukraine6 Bulgaria
Grandparents responsible for own grandchildren in Ocoee
Grandparents (30 to 59 years) White / Caucasian 138 60.8% Responsible for grandchildren89 39.2% Not responsible for grandchildrenBlack or African American 16 37.8% Responsible for grandchildren26 62.2% Not responsible for grandchildrenAsian 121 72.9% Responsible for grandchildren45 27.1% Not responsible for grandchildrenOther race 61 100.0% Responsible for grandchildrenTwo or more races 41 37.5% Responsible for grandchildren69 62.5% Not responsible for grandchildrenWhite alone, not Hispanic / Latino 142 57.2% Responsible for grandchildren106 42.8% Not responsible for grandchildrenHispanic or Latino 87 75.9% Responsible for grandchildren28 24.1% Not responsible for grandchildrenGrandparents (60 years and over) White / Caucasian 15 9.8% Responsible for grandchildren139 90.2% Not responsible for grandchildrenBlack or African American 13 8.8% Responsible for grandchildren140 91.2% Not responsible for grandchildrenAsian 89 100.0% Not responsible for grandchildrenOther race 64 37.8% Responsible for grandchildren106 62.2% Not responsible for grandchildrenTwo or more races 35 100.0% Not responsible for grandchildrenWhite alone, not Hispanic / Latino 10 5.4% Responsible for grandchildren168 94.6% Not responsible for grandchildrenHispanic or Latino 67 28.4% Responsible for grandchildren168 71.6% Not responsible for grandchildren