Oakland Park, FL (Florida) Houses and Residents
Estimated median house or condo value in 2022: $360,115 (it was $92,300 in 2000 )
Oakland Park:
$360,115Florida:
$354,100
Lower value quartile - upper value quartile: $235,470 - $548,356Mean price in 2022: Detached houses: $414,493 Here:
$414,493State:
$500,941
Townhouses or other attached units: $324,467 Here:
$324,467State:
$370,869
In 2-unit structures: $301,914 Here:
$301,914State:
$423,188
In 3-to-4-unit structures: $214,506 Here:
$214,506State:
$309,944
In 5-or-more-unit structures: $186,550 Here:
$186,550State:
$447,145
Mobile homes: $37,272 Here:
$37,272State:
$113,202
Total population: 43,800 (Urban population: 31,205, Rural population: 0)
Houses: 19,490 (17,568 occupied: 9,933 owner occupied, 7,742 renter occupied )
% of renters here:
44%State:
33%
Housing density: 3,093 houses/condos per square mile
Median price asked for vacant for-sale houses and condos in 2022: $498,264.
Median contract rent in 2022: $1,456 (lower quartile is $1,171, upper quartile is $1,777)
Median rent asked for vacant for-rent units in 2022: $1,850
Median gross rent in Oakland Park, FL in 2022: $1,578
Housing units in Oakland Park with a mortgage: 6,608 (474 second mortgage, 25 home equity loan, 369 both second mortgage and home equity loan )Houses without a mortgage: 81
Median household income for houses/condos with a mortgage: $88,493
Median household income for apartments without a mortgage: $60,595
Median monthly housing costs: $1,527
Data:
Median house or condo value ($)
Median house or condo value ($ change since 2000)
Median house or condo value ($) - White
Median house or condo value ($) - Black or African American
Median house or condo value ($) - Asian
Median house or condo value ($) - Hispanic or Latino
Median house or condo value ($) - American Indian and Alaska Native
Median house or condo value ($) - Multirace
Median house or condo value ($) - Other Race
Median price asked for mobile homes ($)
Household density (households per square mile)
Mean house or condo value by units in structure - 1, detached ($)
Mean house or condo value by units in structure - 1, attached ($)
Mean house or condo value by units in structure - 2 ($)
Mean house or condo value by units in structure by units in structure - 3 or 4 ($)
Mean house or condo value by units in structure - 5 or more ($)
Mean house or condo value by units in structure - Boat, RV, van, etc. ($)
Mean house or condo value by units in structure - Mobile home ($)
Median contract rent ($)
Median contract rent - Lower quartile ($)
Median contract rent - Upper quartile ($)
Median gross rent ($)
Urban houses (%)
Rural houses (%)
Houses occupied (%)
Houses occupied (% change since 2000)
Houses owner occupied (%)
Houses owner occupied (% change since 2000)
Houses renter occupied (%)
Houses renter occupied (% change since 2000)
Vacant housing units - For rent (%)
Vacant housing units - For rent (% change since 2000)
Vacant housing units - For sale only (%)
Vacant housing units - For sale only (% change since 2000)
Vacant housing units - Rented or sold, not occupied (%)
Vacant housing units - Rented or sold, not occupied (% change since 2000)
Vacant housing units - For seasonal, recreational, or occasional use (%)
Vacant housing units - For seasonal, recreational, or occasional use (% change since 2000)
Vacant housing units - For migrant workers (%)
Vacant housing units - For migrant workers (% change since 2000)
Vacant housing units - Other vacant (%)
Vacant housing units - Other vacant (% change since 2000)
Median monthly housing costs ($)
Median household income for houses/condos with a mortgage ($)
Median household income for houses/condos without a mortgage ($)
Median household income ($)
Median household income ($) - White
Median household income ($) - Black or African American
Median household income ($) - Asian
Median household income ($) - Hispanic or Latino
Median household income ($) - American Indian and Alaska Native
Median household income ($) - Multirace
Median household income ($) - Other Race
Mortgage status - with mortgage (%)
Mortgage status - with second mortgage (%)
Mortgage status - with home equity loan (%)
Mortgage status - with both second mortgage and home equity loan (%)
Mortgage status - without a mortgage (%)
Median year house/condo built
Median year apartment built
Household type by relationship - Male householder living alone (%)
Household type by relationship - Male householder not living alone (%)
Household type by relationship - Female householder living alone (%)
Household type by relationship - Female householder not living alone (%)
Household type by relationship - Opposite-Sex spouse (%)
Household type by relationship - Same-Sex spouse (%)
Household type by relationship - Opposite-Sex unmarried partner (%)
Household type by relationship - Same-Sex unmarried partner (%)
Household type by relationship - In group quarters (%)
Size of family households - 2-person household (%)
Size of family households - 3-person household (%)
Size of family households - 4-person household (%)
Size of family households - 5-person household (%)
Size of family households - 6-person household (%)
Size of family households - 7-or-more-person household (%)
Size of nonfamily households - 1-person household (%)
Size of nonfamily households - 2-person household (%)
Size of nonfamily households - 3-person household (%)
Size of nonfamily households - 4-person household (%)
Size of nonfamily households - 5-person household (%)
Size of nonfamily households - 6-person household (%)
Size of nonfamily households - 7-or-moreperson household (%)
Year house built - Built 2010 or later (%)
Year house built - Built 2000 to 2009 (%)
Year house built - Built 1990 to 1999 (%)
Year house built - Built 1980 to 1989 (%)
Year house built - Built 1970 to 1979 (%)
Year house built - Built 1960 to 1969 (%)
Year house built - Built 1950 to 1959 (%)
Year house built - Built 1940 to 1949 (%)
Year house built - Built 1939 or earlier (%)
Median number of rooms in houses and condos
Median number of rooms in apartments
Median number of bedrooms in owner occupied houses
Mean number of bedrooms in owner occupied houses
Median number of bedrooms in renter occupied houses
Mean number of bedrooms in renter occupied houses
Median number of vehichles in owner occupied houses
Mean number of vehichles in owner occupied houses
Median number of vehichles in renter occupied houses
Mean number of vehichles in renter occupied houses
Rooms in owner-occupied houses - 1 room (%)
Rooms in owner-occupied houses - 2 rooms (%)
Rooms in owner-occupied houses - 3 rooms (%)
Rooms in owner-occupied houses - 4 rooms (%)
Rooms in owner-occupied houses - 5 rooms (%)
Rooms in owner-occupied houses - 6 rooms (%)
Rooms in owner-occupied houses - 7 rooms (%)
Rooms in owner-occupied houses - 8 rooms (%)
Rooms in owner-occupied houses - 9+ rooms (%)
Rooms in renter-occupied houses - 1 room (%)
Rooms in renter-occupied houses - 2 rooms (%)
Rooms in renter-occupied houses - 3 rooms (%)
Rooms in renter-occupied houses - 4 rooms (%)
Rooms in renter-occupied houses - 5 rooms (%)
Rooms in renter-occupied houses - 6 rooms (%)
Rooms in renter-occupied houses - 7 rooms (%)
Rooms in renter-occupied houses - 8 rooms (%)
Rooms in renter-occupied houses - 9+ rooms (%)
Bedrooms in owner-occupied houses - no bedrooms (%)
Bedrooms in owner-occupied houses - 1 bedroom (%)
Bedrooms in owner-occupied houses - 2 bedrooms (%)
Bedrooms in owner-occupied houses - 3 bedrooms (%)
Bedrooms in owner-occupied houses - 4 bedrooms (%)
Bedrooms in owner-occupied houses - 5+ bedrooms (%)
Bedrooms in renter-occupied houses - no bedrooms (%)
Bedrooms in renter-occupied houses - 1 bedroom (%)
Bedrooms in renter-occupied houses - 2 bedrooms (%)
Bedrooms in renter-occupied houses - 3 bedrooms (%)
Bedrooms in renter-occupied houses - 4 bedrooms (%)
Bedrooms in renter-occupied houses - 5+ bedrooms (%)
Vehicles available in owner-occupied houses - no vehicle available (%)
Vehicles available in owner-occupied houses - 1 vehicle available(%)
Vehicles available in owner-occupied houses - 2 Vehicles available (%)
Vehicles available in owner-occupied houses - 3 Vehicles available (%)
Vehicles available in owner-occupied houses - 4 Vehicles available (%)
Vehicles available in owner-occupied houses - 5+ Vehicles available (%)
Vehicles available in renter-occupied houses - no vehicle available (%)
Vehicles available in renter-occupied houses - 1 vehicle available (%)
Vehicles available in renter-occupied houses - 2 Vehicles available (%)
Vehicles available in renter-occupied houses - 3 Vehicles available (%)
Vehicles available in renter-occupied houses - 4 Vehicles available (%)
Vehicles available in renter-occupied houses - 5+ Vehicles available (%)
Housing units in structures - 1, detached (%)
Housing units in structures - 1, attached (%)
Housing units in structures - 2 (%)
Housing units in structures - 3 or 4 (%)
Housing units in structures - 5 to 9 (%)
Housing units in structures - 10 to 19 (%)
Housing units in structures - 20 to 49 (%)
Housing units in structures - 50 or more (%)
Housing units in structures - Mobile home (%)
Housing units in structures - Boat, RV, van, etc. (%)
Housing units in structures - Owners - 1, detached (%)
Housing units in structures - Owners - 1, attached (%)
Housing units in structures - Owners - 2 (%)
Housing units in structures - Owners - 3 or 4 (%)
Housing units in structures - Owners - 5 to 9 (%)
Housing units in structures - Owners - 10 to 19 (%)
Housing units in structures - Owners - 20 to 49 (%)
Housing units in structures - Owners - 50 or more (%)
Housing units in structures - Owners - Mobile home (%)
Housing units in structures - Owners - Boat, RV, van, etc. (%)
Housing units in structures - Renters - 1, detached (%)
Housing units in structures - Renters - 1, attached (%)
Housing units in structures - Renters - 2 (%)
Housing units in structures - Renters - 3 or 4 (%)
Housing units in structures - Renters - 5 to 9 (%)
Housing units in structures - Renters - 10 to 19 (%)
Housing units in structures - Renters - 20 to 49 (%)
Housing units in structures - Renters - 50 or more (%)
Housing units in structures - Renters - Mobile home (%)
Housing units in structures - Renters - Boat, RV, van, etc. (%)
House/condo owner moved in on average (years ago)
Renter moved in on average (years ago)
Year householder moved into unit - Moved in 1999 to March 2000 (%)
Year householder moved into unit - Moved in 1999 to March 2000 (%) - White
Year householder moved into unit - Moved in 1999 to March 2000 (%) - Black or African American
Year householder moved into unit - Moved in 1999 to March 2000 (%) - Asian
Year householder moved into unit - Moved in 1999 to March 2000 (%) - Hispanic or Latino
Year householder moved into unit - Moved in 1999 to March 2000 (%) - American Indian and Alaska Native
Year householder moved into unit - Moved in 1999 to March 2000 (%) - Multirace
Year householder moved into unit - Moved in 1999 to March 2000 (%) - Other Race
Year householder moved into unit - Moved in 1995 to 1998 (%)
Year householder moved into unit - Moved in 1995 to 1998 (%) - White
Year householder moved into unit - Moved in 1995 to 1998 (%) - Black or African American
Year householder moved into unit - Moved in 1995 to 1998 (%) - Asian
Year householder moved into unit - Moved in 1995 to 1998 (%) - Hispanic or Latino
Year householder moved into unit - Moved in 1995 to 1998 (%) - American Indian and Alaska Native
Year householder moved into unit - Moved in 1995 to 1998 (%) - Multirace
Year householder moved into unit - Moved in 1995 to 1998 (%) - Other Race
Year householder moved into unit - Moved in 1990 to 1994 (%)
Year householder moved into unit - Moved in 1990 to 1994 (%) - White
Year householder moved into unit - Moved in 1990 to 1994 (%) - Black or African American
Year householder moved into unit - Moved in 1990 to 1994 (%) - Asian
Year householder moved into unit - Moved in 1990 to 1994 (%) - Hispanic or Latino
Year householder moved into unit - Moved in 1990 to 1994 (%) - American Indian and Alaska Native
Year householder moved into unit - Moved in 1990 to 1994 (%) - Multirace
Year householder moved into unit - Moved in 1990 to 1994 (%) - Other Race
Year householder moved into unit - Moved in 1980 to 1989 (%)
Year householder moved into unit - Moved in 1980 to 1989 (%) - White
Year householder moved into unit - Moved in 1980 to 1989 (%) - Black or African American
Year householder moved into unit - Moved in 1980 to 1989 (%) - Asian
Year householder moved into unit - Moved in 1980 to 1989 (%) - Hispanic or Latino
Year householder moved into unit - Moved in 1980 to 1989 (%) - American Indian and Alaska Native
Year householder moved into unit - Moved in 1980 to 1989 (%) - Multirace
Year householder moved into unit - Moved in 1980 to 1989 (%) - Other Race
Year householder moved into unit - Moved in 1970 to 1979 (%)
Year householder moved into unit - Moved in 1970 to 1979 (%) - White
Year householder moved into unit - Moved in 1970 to 1979 (%) - Black or African American
Year householder moved into unit - Moved in 1970 to 1979 (%) - Asian
Year householder moved into unit - Moved in 1970 to 1979 (%) - Hispanic or Latino
Year householder moved into unit - Moved in 1970 to 1979 (%) - American Indian and Alaska Native
Year householder moved into unit - Moved in 1970 to 1979 (%) - Multirace
Year householder moved into unit - Moved in 1970 to 1979 (%) - Other Race
Year householder moved into unit - Moved in 1969 or earlier (%)
Year householder moved into unit - Moved in 1969 or earlier (%) - White
Year householder moved into unit - Moved in 1969 or earlier (%) - Black or African American
Year householder moved into unit - Moved in 1969 or earlier (%) - Asian
Year householder moved into unit - Moved in 1969 or earlier (%) - Hispanic or Latino
Year householder moved into unit - Moved in 1969 or earlier (%) - American Indian and Alaska Native
Year householder moved into unit - Moved in 1969 or earlier (%) - Multirace
Year householder moved into unit - Moved in 1969 or earlier (%) - Other Race
Housing units lacking complete plumbing facilities (%)
Housing units lacking complete kitchen facilities (%)
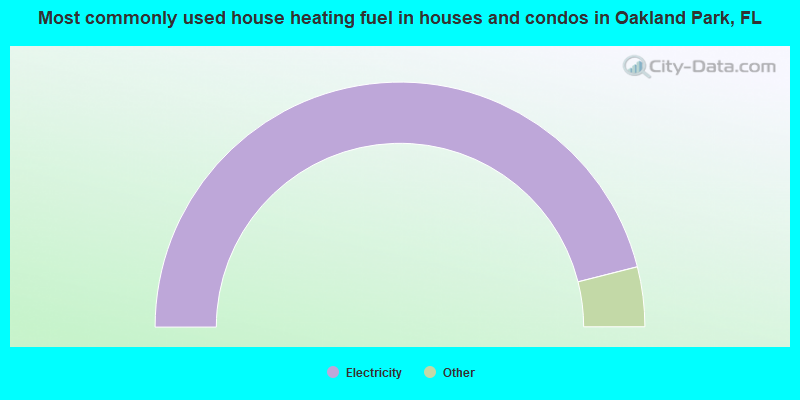
House heating fuel used in houses and condos - Utility gas (%)
House heating fuel used in houses and condos - Bottled, tank, or LP gas (%)
House heating fuel used in houses and condos - Electricity (%)
House heating fuel used in houses and condos - Fuel oil, kerosene, etc. (%)
House heating fuel used in houses and condos - Coal or coke (%)
House heating fuel used in houses and condos - Wood (%)
House heating fuel used in houses and condos - Solar energy (%)
House heating fuel used in houses and condos - Other fuel (%)
House heating fuel used in houses and condos - No fuel used (%)
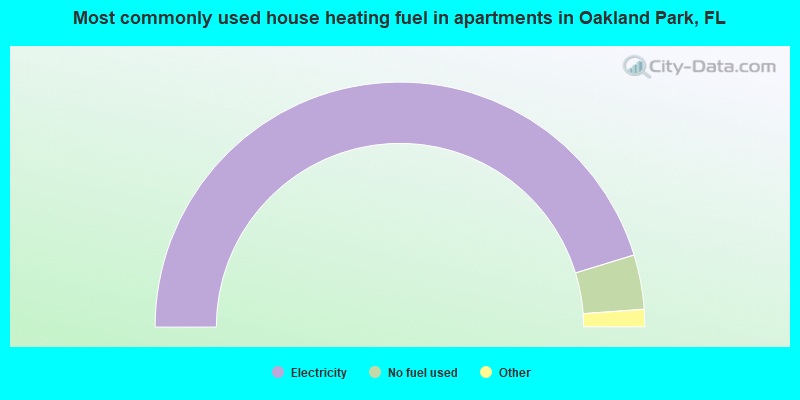
House heating fuel used in apartments - Utility gas (%)
House heating fuel used in apartments - Bottled, tank, or LP gas (%)
House heating fuel used in apartments - Electricity (%)
House heating fuel used in apartments - Fuel oil, kerosene, etc. (%)
House heating fuel used in apartments - Coal or coke (%)
House heating fuel used in apartments - Wood (%)
House heating fuel used in apartments - Solar energy (%)
House heating fuel used in apartments - Other fuel (%)
House heating fuel used in apartments - No fuel used (%)
Median year house/condo built: 1966Median year apartment built: 1976Household type by relationship:
Households: 44,194
Male householders: 9,276 (3,525 living alone ), Female householders: 8,193 (2,436 living alone )5,393 spouses (4,749 opposite-sex spouses ), 2,137 unmarried partners , (1,629 opposite-sex unmarried partners ), 11,449 children (10,969 natural , 118 adopted , 362 stepchildren ), 695 grandchildren , 1,176 brothers or sisters , 1,153 parents , 37 foster children , 2,150 other relatives , 2,329 non-relatives In group quarters: 200
Size of family households: 3,841 2-persons , 2,504 3-persons , 1,446 4-persons , 838 5-persons , 502 6-persons , 381 7-or-more-persons .
Size of nonfamily households: 5,901 1-person , 1,992 2-persons , 131 3-persons , 87 4-persons .
3,512 married couples with children. single-parent households (517 men , 3,585 women ).
56.1% of residents of Oakland Park speak English at home. of residents speak Spanish at home (42% speak English very well , 18% speak English well , 25% speak English not well , 15% don't speak English at all ).of residents speak other Indo-European language at home (61% speak English very well , 19% speak English well , 18% speak English not well , 2% don't speak English at all ).of residents speak Asian or Pacific Island language at home (54% speak English very well , 42% speak English well , 3% speak English not well , 1% don't speak English at all ).of residents speak other language at home (78% speak English very well , 22% speak English well ).
Foreign born population: 15,610 (35.3%)of them are naturalized citizens )
Median number of rooms in houses and condos:
Median number of rooms in apartments
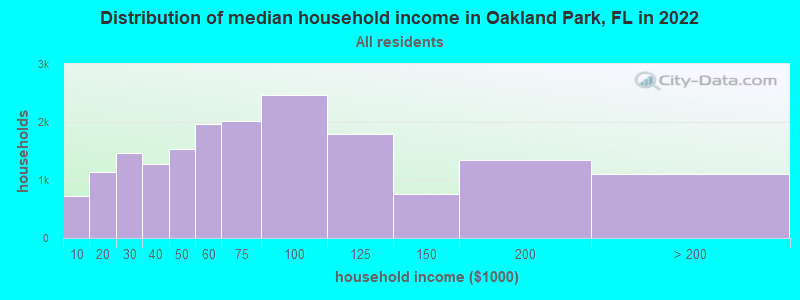
Oakland Park, FL household income distribution 724 Less than $10,0001,140 $10,000 to $19,9991,461 $20,000 to $29,9991,276 $30,000 to $39,9991,537 $40,000 to $49,9991,972 $50,000 to $59,9992,023 $60,000 to $74,9992,469 $75,000 to $99,9991,787 $100,000 to $124,999766 $125,000 to $149,9991,340 $150,000 to $199,9991,098 $200,000 or more
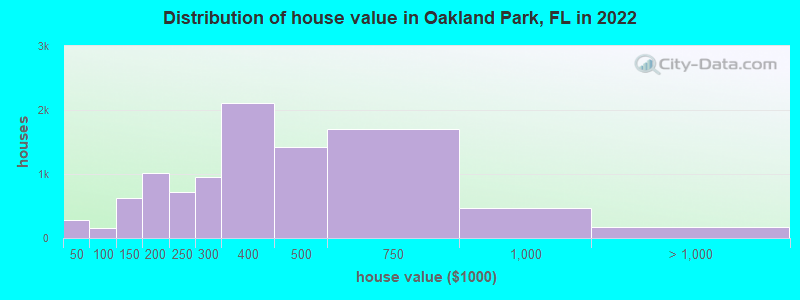
Home value of owner - occupied houses in 2022 in Oakland Park, FL 59 Less than $10,00032 $10,000 to $14,9993 $20,000 to $24,9993 $25,000 to $29,999136 $30,000 to $34,99915 $35,000 to $39,99930 $40,000 to $49,9998 $50,000 to $59,99940 $70,000 to $79,99957 $80,000 to $89,99916 $90,000 to $99,999281 $100,000 to $124,999345 $125,000 to $149,999537 $150,000 to $174,999471 $175,000 to $199,999723 $200,000 to $249,999957 $250,000 to $299,9992,103 $300,000 to $399,9991,421 $400,000 to $499,9991,705 $500,000 to $749,999469 $750,000 to $999,999114 $1,000,000 to $1,499,99921 $1,500,000 to $1,999,99930 $2,000,000 or moreRent paid by renters in 2022 in Oakland Park, FL 102 Less than $1002 $150 to $199124 $500 to $54983 $550 to $59947 $600 to $64949 $650 to $69996 $700 to $74921 $750 to $799140 $800 to $899314 $900 to $9991,493 $1,000 to $1,2491,855 $1,250 to $1,4991,961 $1,500 to $1,999545 $2,000 to $2,499230 $2,500 to $2,99912 $3,000 to $3,499301 No cash rent
Percentage of workers working in this county: 88.2%Number of people working at home: 3,336 (13.0% of all workers )
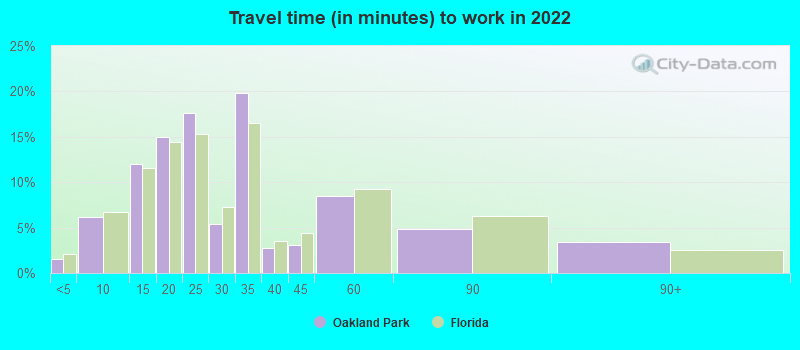
Travel time to work (commute)
Less than 5 minutes: 3805 to 9 minutes: 1,56510 to 14 minutes: 3,22715 to 19 minutes: 3,61120 to 24 minutes: 3,67625 to 29 minutes: 1,56130 to 34 minutes: 3,31235 to 39 minutes: 82040 to 44 minutes: 65645 to 59 minutes: 1,35060 to 89 minutes: 1,16490 or more minutes: 914
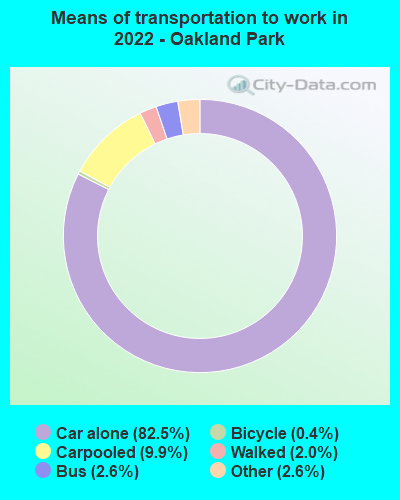
Means of transportation to work:
Drove a car alone: 16,027 (68.9%)Carpooled: 2,186 (9.4%)Bus : 554 (2.4%)Taxi: 543 (2.3%)Bicycle: 96 (0.4%)Walked: 446 (1.9%)Worked at home: 3,336 (14.4%)
Unemployment by race in 2022
Unemployment rate for White non-Hispanic residents 4.7% Males4.3% FemalesUnemployment rate for Black residents 6.5% Males8.6% FemalesUnemployment rate for American Indian and Alaska Native residents 11.1% FemalesUnemployment rate for Asian residents 12.2% FemalesUnemployment rate for other race residents 9.0% Males1.7% FemalesUnemployment rate for two or more race residents 2.1% Males5.3% FemalesUnemployment rate for Hispanic or Latino residents 3.9% Males3.7% Females
Year of entry for the foreign-born population in Oakland Park, Florida
7,176 2010 or later 3,237 2000 to 2009 2,578 1990 to 1999 2,398 1980 to 1989 1,001 1970 to 1979 811 Before 1970
First ancestries reported:
Haitian: 3,697 (12.4%)
Jamaican: 1,259 (4.2%)
Italian: 1,117 (3.7%)
English: 952 (3.2%)
German: 882 (3.0%)
Irish: 732 (2.4%)
Albanian: 705 (2.4%)
American: 676 (2.3%)
British: 316 (1.1%)
Czech: 279 (0.9%)
Polish: 271 (0.9%)
British West Indian: 176 (0.6%)
Romanian: 173 (0.6%)
French: 170 (0.6%)
Russian: 166 (0.6%)
European: 163 (0.5%)
French Canadian: 149 (0.5%)
Brazilian: 119 (0.4%)
African: 118 (0.4%)
Greek: 112 (0.4%)
Slovak: 101 (0.3%)
Portuguese: 100 (0.3%)
Scottish: 89 (0.3%)
Dutch: 83 (0.3%)
Icelander: 77 (0.3%)
U.S. Virgin Islander: 76 (0.3%)
Trinidadian and Tobagonian: 74 (0.2%)
Hungarian: 73 (0.2%)
Turkish: 71 (0.2%)
Welsh: 59 (0.2%)
Lebanese: 55 (0.2%)
Canadian: 49 (0.2%)
Barbadian: 38 (0.1%)
Scotch-Irish: 34 (0.1%)
Austrian: 32 (0.1%)
Bahamian: 31 (0.1%)
Ukrainian: 27 (0.09%)
Swedish: 26 (0.09%)
Eastern European: 25 (0.08%)
Sierra Leonean: 22 (0.07%)
Arab: 19 (0.06%)
Pennsylvania German: 19 (0.06%)
Northern European: 17 (0.06%)
Swiss: 15 (0.05%)
Iranian: 11 (0.04%)
Danish: 8 (0.03%)
Armenian: 8 (0.03%)
Norwegian: 8 (0.03%)
Palestinian: 7 (0.02%)
Luxembourger: 7 (0.02%)
Croatian: 5 (0.02%)
Israeli: 5 (0.02%)
Finnish: 4 (0.01%)
West Indian: 3 (0.01%)
Most common places of birth for foreign-born residents (%): Haiti Oakland Park:
15.8% (2,473)Florida:
7.5% (342,375)
El Salvador Oakland Park:
14.5% (2,267)Florida:
1.1% (49,838)
Guatemala Oakland Park:
8.7% (1,364)Florida:
2.1% (97,632)
Jamaica Oakland Park:
7.4% (1,150)Florida:
5.0% (227,319)
Venezuela Oakland Park:
7.3% (1,144)Florida:
5.7% (262,042)
Cuba Oakland Park:
5.6% (877)Florida:
22.0% (1,006,576)
Honduras Oakland Park:
4.3% (664)Florida:
2.3% (107,160)
Brazil Oakland Park:
3.4% (535)Florida:
2.7% (122,906)
Albania Oakland Park:
3.4% (530)Florida:
0.2% (9,779)
Mexico Oakland Park:
3.4% (529)Florida:
5.6% (257,152)
Colombia Oakland Park:
3.2% (497)Florida:
6.5% (298,669)
Ecuador Oakland Park:
2.7% (418)Florida:
1.2% (54,585)
Place of birth for U.S.-born residents:
This state: 15,030Other state: 11,631Northeast: 6,032Midwest: 2,331South: 2,668West: 578 86.4% of Oakland Park residents lived in the same house 1 years ago.
Out of people who lived in different houses, 41.5% lived in this county.
Out of people who lived in different counties, 51.8% lived in Florida.
Oakland Park:
86.4%State average:
86.3%
Education attainment for males 25 years and older:
No schooling: 307Nursery to 4th grade: 2235th and 6th grade: 1747th and 8th grade: 2509th grade: 37310th grade: 21011th grade: 26512th grade, no diploma: 700High school graduate (or equivalency): 4,994Less than 1 year of college: 919Some college more than 1 year, no degree: 2,061Associate degree: 1,610Bachelor's degree: 3,136Master's degree: 1,126Professional school degree: 333Doctorate degree: 322
Education attainment for females 25 years and older:
No schooling: 336Nursery to 4th grade: 1685th and 6th grade: 3787th and 8th grade: 609th grade: 19410th grade: 38511th grade: 9012th grade, no diploma: 256High school graduate (or equivalency): 4,311Less than 1 year of college: 752Some college more than 1 year, no degree: 1,528Associate degree: 1,751Bachelor's degree: 3,226Master's degree: 1,168Professional school degree: 269Doctorate degree: 114
Housing units in structures:
One, detached: 8,412One, attached: 1,429Two: 9043 or 4: 7455 to 9: 1,41710 to 19: 1,57520 to 49: 2,86450 or more: 1,829Mobile homes: 303Boats, RVs, vans, etc.: 7Median worth of mobile homes: $34,788
Housing units lacking complete plumbing facilities in 2022: 0.8%Housing units lacking complete kitchen facilities in 2022: 1.4%House/condo owner moved in on average 12 years ago
Renter moved in on average 4 years ago
Private vs. public school enrollment:
Students in private schools in grades 1 to 8 (elementary and middle school): 388 Students in private schools in grades 9 to 12 (high school): 199 Students in private undergraduate colleges: 490