Races in Oakland Park, Florida (FL) Detailed Stats
Data:
Races - White alone (%)
Races - White alone (% change since 2000)
Races - Black alone (%)
Races - Black alone (% change since 2000)
Races - American Indian alone (%)
Races - American Indian alone (% change since 2000)
Races - Asian alone (%)
Races - Asian alone (% change since 2000)
Races - Hispanic (%)
Races - Hispanic (% change since 2000)
Races - Native Hawaiian and Other Pacific Islander alone (%)
Races - Native Hawaiian and Other Pacific Islander alone (% change since 2000)
Races - Two or more races(%)
Races - Two or more races(% change since 2000)
Races - Other race alone (%)
Races - Other race alone (% change since 2000)
Racial diversity
Place of birth - Born in state of residence (%)
Place of birth - Born in state of residence (%) - White
Place of birth - Born in state of residence (%) - Black or African American
Place of birth - Born in state of residence (%) - Asian
Place of birth - Born in state of residence (%) - Hispanic or Latino
Place of birth - Born in state of residence (%) - American Indian and Alaska Native
Place of birth - Born in state of residence (%) - Multirace
Place of birth - Born in state of residence (%) - Other Race
Place of birth - Born in other state (%)
Place of birth - Born in other state (%) - White
Place of birth - Born in other state (%) - Black or African American
Place of birth - Born in other state (%) - Asian
Place of birth - Born in other state (%) - Hispanic or Latino
Place of birth - Born in other state (%) - American Indian and Alaska Native
Place of birth - Born in other state (%) - Multirace
Place of birth - Born in other state (%) - Other Race
Place of birth - Native, outside of US (%)
Place of birth - Native, outside of US (%) - White
Place of birth - Native, outside of US (%) - Black or African American
Place of birth - Native, outside of US (%) - Asian
Place of birth - Native, outside of US (%) - Hispanic or Latino
Place of birth - Native, outside of US (%) - American Indian and Alaska Native
Place of birth - Native, outside of US (%) - Multirace
Place of birth - Native, outside of US (%) - Other Race
Place of birth - Foreign born (%)
Place of birth - Foreign born (%) - White
Place of birth - Foreign born (%) - Black or African American
Place of birth - Foreign born (%) - Asian
Place of birth - Foreign born (%) - Hispanic or Latino
Place of birth - Foreign born (%) - American Indian and Alaska Native
Place of birth - Foreign born (%) - Multirace
Place of birth - Foreign born (%) - Other Race
Residents speaking English at home (%)
Residents speaking English at home - Born in the United States (%)
Residents speaking English at home - Native, born elsewhere (%)
Residents speaking English at home - Foreign born (%)
Residents speaking Spanish at home (%)
Residents speaking Spanish at home - Born in the United States (%)
Residents speaking Spanish at home - Native, born elsewhere (%)
Residents speaking Spanish at home - Foreign born (%)
Residents speaking other language at home (%)
Residents speaking other language at home - Born in the United States (%)
Residents speaking other language at home - Native, born elsewhere (%)
Residents speaking other language at home - Foreign born (%)
Marital status - Never married (%)
Marital status - Now married (%)
Marital status - Separated (%)
Marital status - Widowed (%)
Marital status - Divorced (%)
Ancestries Reported - Arab (%)
Ancestries Reported - Czech (%)
Ancestries Reported - Danish (%)
Ancestries Reported - Dutch (%)
Ancestries Reported - English (%)
Ancestries Reported - French (%)
Ancestries Reported - French Canadian (%)
Ancestries Reported - German (%)
Ancestries Reported - Greek (%)
Ancestries Reported - Hungarian (%)
Ancestries Reported - Irish (%)
Ancestries Reported - Italian (%)
Ancestries Reported - Lithuanian (%)
Ancestries Reported - Norwegian (%)
Ancestries Reported - Polish (%)
Ancestries Reported - Portuguese (%)
Ancestries Reported - Russian (%)
Ancestries Reported - Scotch-Irish (%)
Ancestries Reported - Scottish (%)
Ancestries Reported - Slovak (%)
Ancestries Reported - Subsaharan African (%)
Ancestries Reported - Swedish (%)
Ancestries Reported - Swiss (%)
Ancestries Reported - Ukrainian (%)
Ancestries Reported - United States (%)
Ancestries Reported - Welsh (%)
Ancestries Reported - West Indian (%)
Ancestries Reported - Other (%)
Geographical mobility - Same house 1 year ago (%)
Geographical mobility - Same house 1 year ago (%) - White
Geographical mobility - Same house 1 year ago (%) - Black or African American
Geographical mobility - Same house 1 year ago (%) - Asian
Geographical mobility - Same house 1 year ago (%) - Hispanic or Latino
Geographical mobility - Same house 1 year ago (%) - American Indian and Alaska Native
Geographical mobility - Same house 1 year ago (%) - Multirace
Geographical mobility - Same house 1 year ago (%) - Other Race
Geographical mobility - Moved within same county (%)
Geographical mobility - Moved within same county (%) - White
Geographical mobility - Moved within same county (%) - Black or African American
Geographical mobility - Moved within same county (%) - Asian
Geographical mobility - Moved within same county (%) - Hispanic or Latino
Geographical mobility - Moved within same county (%) - American Indian and Alaska Native
Geographical mobility - Moved within same county (%) - Multirace
Geographical mobility - Moved within same county (%) - Other Race
Geographical mobility - Moved from different county within same state (%)
Geographical mobility - Moved from different county within same state (%) - White
Geographical mobility - Moved from different county within same state (%) - Black or African American
Geographical mobility - Moved from different county within same state (%) - Asian
Geographical mobility - Moved from different county within same state (%) - Hispanic or Latino
Geographical mobility - Moved from different county within same state (%) - American Indian and Alaska Native
Geographical mobility - Moved from different county within same state (%) - Multirace
Geographical mobility - Moved from different county within same state (%) - Other Race
Geographical mobility - Moved from different state (%)
Geographical mobility - Moved from different state (%) - White
Geographical mobility - Moved from different state (%) - Black or African American
Geographical mobility - Moved from different state (%) - Asian
Geographical mobility - Moved from different state (%) - Hispanic or Latino
Geographical mobility - Moved from different state (%) - American Indian and Alaska Native
Geographical mobility - Moved from different state (%) - Multirace
Geographical mobility - Moved from different state (%) - Other Race
Geographical mobility - Moved from abroad (%)
Geographical mobility - Moved from abroad (%) - White
Geographical mobility - Moved from abroad (%) - Black or African American
Geographical mobility - Moved from abroad (%) - Asian
Geographical mobility - Moved from abroad (%) - Hispanic or Latino
Geographical mobility - Moved from abroad (%) - American Indian and Alaska Native
Geographical mobility - Moved from abroad (%) - Multirace
Geographical mobility - Moved from abroad (%) - Other Race
Place of birth for the foreign-born population - Ireland (%)
Place of birth for the foreign-born population - Denmark (%)
Place of birth for the foreign-born population - Norway (%)
Place of birth for the foreign-born population - Sweden (%)
Place of birth for the foreign-born population - United Kingdom (%)
Place of birth for the foreign-born population - England (%)
Place of birth for the foreign-born population - Scotland (%)
Place of birth for the foreign-born population - Other Northern Europe (%)
Place of birth for the foreign-born population - Austria (%)
Place of birth for the foreign-born population - Belgium (%)
Place of birth for the foreign-born population - France (%)
Place of birth for the foreign-born population - Germany (%)
Place of birth for the foreign-born population - Netherlands (%)
Place of birth for the foreign-born population - Switzerland (%)
Place of birth for the foreign-born population - Other Western Europe (%)
Place of birth for the foreign-born population - Greece (%)
Place of birth for the foreign-born population - Italy (%)
Place of birth for the foreign-born population - Portugal (%)
Place of birth for the foreign-born population - Spain (%)
Place of birth for the foreign-born population - Other Southern Europe (%)
Place of birth for the foreign-born population - Albania (%)
Place of birth for the foreign-born population - Belarus (%)
Place of birth for the foreign-born population - Bosnia and Herzegovina (%)
Place of birth for the foreign-born population - Bulgaria (%)
Place of birth for the foreign-born population - Croatia (%)
Place of birth for the foreign-born population - Czechoslovakia (%)
Place of birth for the foreign-born population - Hungary (%)
Place of birth for the foreign-born population - Latvia (%)
Place of birth for the foreign-born population - Lithuania (%)
Place of birth for the foreign-born population - North Macedonia (Macedonia) (%)
Place of birth for the foreign-born population - Moldova (%)
Place of birth for the foreign-born population - Poland (%)
Place of birth for the foreign-born population - Romania (%)
Place of birth for the foreign-born population - Russia (%)
Place of birth for the foreign-born population - Serbia (%)
Place of birth for the foreign-born population - Ukraine (%)
Place of birth for the foreign-born population - Other Eastern Europe (%)
Place of birth for the foreign-born population - China (%)
Place of birth for the foreign-born population - Hong Kong (%)
Place of birth for the foreign-born population - Taiwan (%)
Place of birth for the foreign-born population - Japan (%)
Place of birth for the foreign-born population - Korea (%)
Place of birth for the foreign-born population - Other Eastern Asia (%)
Place of birth for the foreign-born population - Afghanistan (%)
Place of birth for the foreign-born population - Bangladesh (%)
Place of birth for the foreign-born population - India (%)
Place of birth for the foreign-born population - Iran (%)
Place of birth for the foreign-born population - Kazakhstan (%)
Place of birth for the foreign-born population - Nepal (%)
Place of birth for the foreign-born population - Pakistan (%)
Place of birth for the foreign-born population - Sri Lanka (%)
Place of birth for the foreign-born population - Uzbekistan (%)
Place of birth for the foreign-born population - Other South Central Asia (%)
Place of birth for the foreign-born population - Burma (%)
Place of birth for the foreign-born population - Cambodia (%)
Place of birth for the foreign-born population - Indonesia (%)
Place of birth for the foreign-born population - Laos (%)
Place of birth for the foreign-born population - Malaysia (%)
Place of birth for the foreign-born population - Philippines (%)
Place of birth for the foreign-born population - Singapore (%)
Place of birth for the foreign-born population - Thailand (%)
Place of birth for the foreign-born population - Vietnam (%)
Place of birth for the foreign-born population - Other South Eastern Asia (%)
Place of birth for the foreign-born population - Armenia (%)
Place of birth for the foreign-born population - Iraq (%)
Place of birth for the foreign-born population - Israel (%)
Place of birth for the foreign-born population - Jordan (%)
Place of birth for the foreign-born population - Kuwait (%)
Place of birth for the foreign-born population - Lebanon (%)
Place of birth for the foreign-born population - Saudi Arabia (%)
Place of birth for the foreign-born population - Syria (%)
Place of birth for the foreign-born population - Turkey (%)
Place of birth for the foreign-born population - Yemen (%)
Place of birth for the foreign-born population - Other Western Asia (%)
Place of birth for the foreign-born population - Eritrea (%)
Place of birth for the foreign-born population - Ethiopia (%)
Place of birth for the foreign-born population - Kenya (%)
Place of birth for the foreign-born population - Somalia (%)
Place of birth for the foreign-born population - Uganda (%)
Place of birth for the foreign-born population - Zimbabwe (%)
Place of birth for the foreign-born population - Other Eastern Africa (%)
Place of birth for the foreign-born population - Cameroon (%)
Place of birth for the foreign-born population - Congo (%)
Place of birth for the foreign-born population - Democratic Republic of Congo (Zaire) (%)
Place of birth for the foreign-born population - Other Middle Africa (%)
Place of birth for the foreign-born population - Egypt (%)
Place of birth for the foreign-born population - Morocco (%)
Place of birth for the foreign-born population - Sudan (%)
Place of birth for the foreign-born population - Other Northern Africa (%)
Place of birth for the foreign-born population - South Africa (%)
Place of birth for the foreign-born population - Other Southern Africa (%)
Place of birth for the foreign-born population - Cabo Verde (%)
Place of birth for the foreign-born population - Ghana (%)
Place of birth for the foreign-born population - Liberia (%)
Place of birth for the foreign-born population - Nigeria (%)
Place of birth for the foreign-born population - Senegal (%)
Place of birth for the foreign-born population - Sierra Leone (%)
Place of birth for the foreign-born population - Other Western Africa (%)
Place of birth for the foreign-born population - Australia (%)
Place of birth for the foreign-born population - New Zealand (%)
Place of birth for the foreign-born population - Fiji (%)
Place of birth for the foreign-born population - Micronesia (%)
Place of birth for the foreign-born population - Bahamas (%)
Place of birth for the foreign-born population - Barbados (%)
Place of birth for the foreign-born population - Cuba (%)
Place of birth for the foreign-born population - Dominica (%)
Place of birth for the foreign-born population - Dominican Republic (%)
Place of birth for the foreign-born population - Grenada (%)
Place of birth for the foreign-born population - Haiti (%)
Place of birth for the foreign-born population - Jamaica (%)
Place of birth for the foreign-born population - St. Vincent and the Grenadines (%)
Place of birth for the foreign-born population - Trinidad and Tobago (%)
Place of birth for the foreign-born population - West Indies (%)
Place of birth for the foreign-born population - Other Caribbean (%)
Place of birth for the foreign-born population - Belize (%)
Place of birth for the foreign-born population - Costa Rica (%)
Place of birth for the foreign-born population - El Salvador (%)
Place of birth for the foreign-born population - Guatemala (%)
Place of birth for the foreign-born population - Honduras (%)
Place of birth for the foreign-born population - Mexico (%)
Place of birth for the foreign-born population - Nicaragua (%)
Place of birth for the foreign-born population - Panama (%)
Place of birth for the foreign-born population - Other Central America (%)
Place of birth for the foreign-born population - Argentina (%)
Place of birth for the foreign-born population - Bolivia (%)
Place of birth for the foreign-born population - Brazil (%)
Place of birth for the foreign-born population - Chile (%)
Place of birth for the foreign-born population - Colombia (%)
Place of birth for the foreign-born population - Ecuador (%)
Place of birth for the foreign-born population - Guyana (%)
Place of birth for the foreign-born population - Peru (%)
Place of birth for the foreign-born population - Uruguay (%)
Place of birth for the foreign-born population - Venezuela (%)
Place of birth for the foreign-born population - Other South America (%)
Place of birth for the foreign-born population - Canada (%)
Place of birth for the foreign-born population - Other Northern America (%)
Place of birth for the foreign-born population - Other (%)
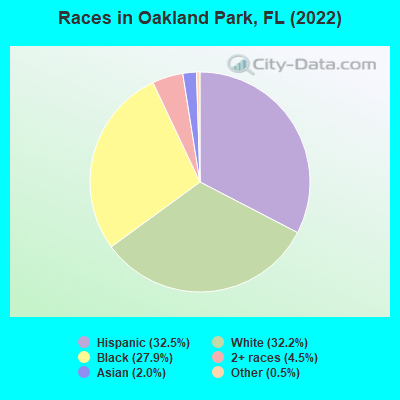
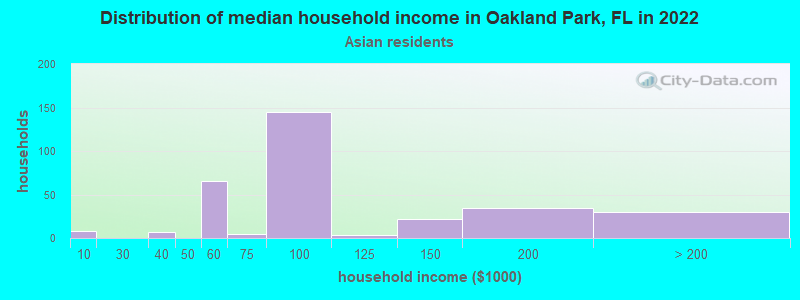
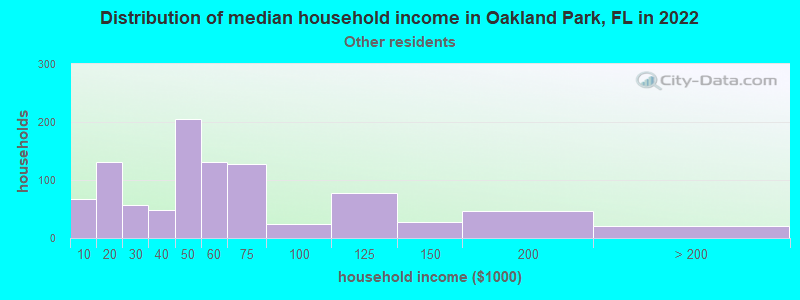
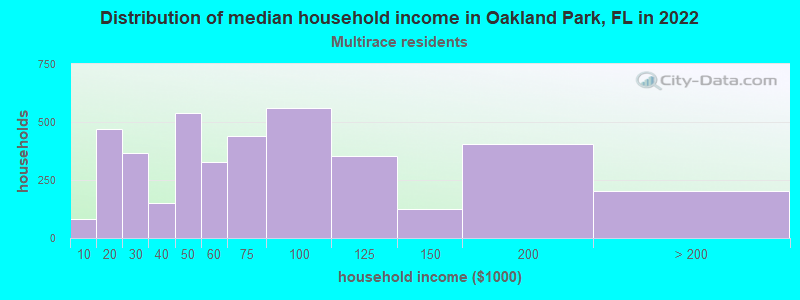
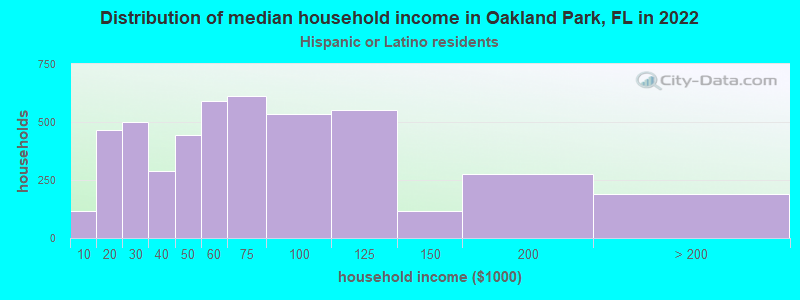
According to 2022 data, the most numerous races in Oakland Park, FL are White alone (14,248 residents), Hispanic (14,349 residents), and Black alone (12,328 residents). 56.2% of Oakland Park residents speak English at home. 35.3% of Oakland Park, FL residents are foreign-born (28.1% born in Latin America, 3.8% born in Europe), which is 40.5% greater than the foreign-born rate of 21.0% across the entire state of Florida.
Race distribution in Oakland Park
2000 2022
10,458,509 65.4% White alone 2,682,715 16.8% Hispanic 2,264,268 14.2% Black alone 261,693 1.6% Asian alone 236,954 1.5% Two or more races 42,358 0.3% American Indian alone 28,994 0.2% Other race alone 6,887 0.04% Native Hawaiian and Other
11,309,403 50.8% White alone 6,025,039 27.1% Hispanic 3,241,015 14.6% Black alone 861,630 3.9% Two or more races 623,692 2.8% Asian alone 152,054 0.7% Other race alone 22,504 0.1% American Indian alone 9,486 0.04% Native Hawaiian and Other
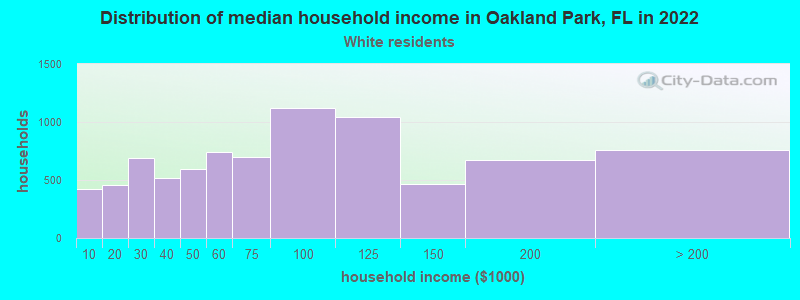
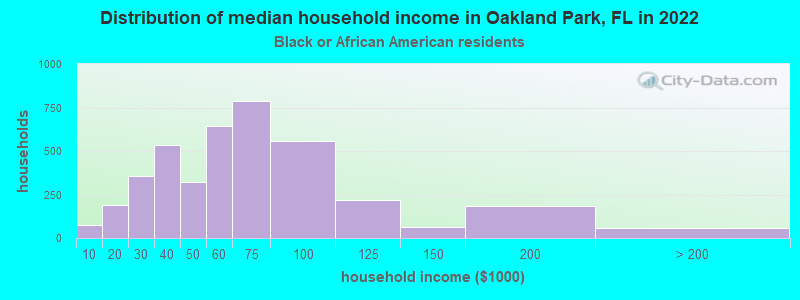
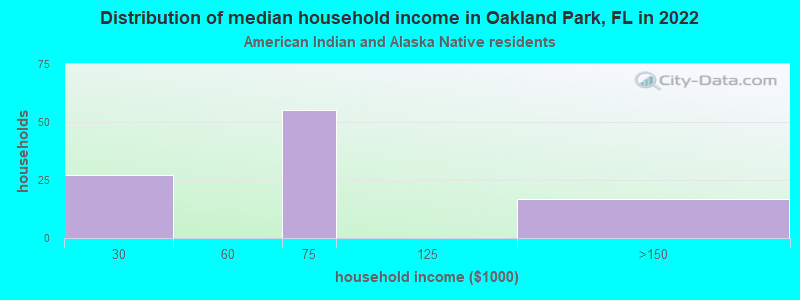
Income and house value in Oakland Park Median household income in 2022 $78,441 White non-Hispanic householders$54,664 Black householders$89,848 Asian householders$47,360 Some other race householders$64,658 Two or more races householders$59,923 Hispanic or Latino race householdersMedian 2022 house value $504,472 White Non-Hispanic householders$359,724 Black or African American householders$253,601 American Indian or Alaska Native householders $422,539 Asian householders$372,209 Some other race householders$388,595 Two or more races householders$404,592 Hispanic or Latino householders
Median age by race in Oakland Park
48.7 Median age for White residents51.2 45.6 31.8 Median age for Black or African American residents29.4 34.1 52.3 Median age for American Indian / Alaska Native residents44.5 47.3 49.0 Median age for Asian residents48.8 46.1 21.5 Median age for Native Hawaiian / Pacific Islander residents-454,756,380.1 -666,666,666.0 43.7 Median age for Other race residents46.6 40.5 34.2 Median age for Two or more races residents33.5 34.5 51.4 Median age for White alone residents52.8 48.0 35.8 Median age for Hispanic or Latino residents36.4 34.6
Owner/renter occupied households by race in Oakland Park
House owners and renters - White residents 5,837 71.0% Owner occupied2,382 29.0% Renter occupiedHouse owners and renters - Black or African American residents 1,390 33.5% Owner occupied2,755 66.5% Renter occupiedHouse owners and renters - American Indian / Alaska Native residents 15 22.6% Owner occupied52 77.4% Renter occupiedHouse owners and renters - Asian residents 240 85.4% Owner occupied41 14.6% Renter occupiedHouse owners and renters - Native Hawaiian / Pacific Islander residents 11 100.0% Renter occupiedHouse owners and renters - Other race residents 456 47.9% Owner occupied497 52.1% Renter occupiedHouse owners and renters - Two or more races residents 1,702 43.3% Owner occupied2,228 56.7% Renter occupiedHouse owners and renters - White alone residents 5,734 75.2% Owner occupied1,894 24.8% Renter occupiedHouse owners and renters - Hispanic or Latino residents 1,966 42.3% Owner occupied2,685 57.7% Renter occupied
Language usage in Oakland Park
English speakers - Total 56.2% of residents of Oakland Park speak English at home.
28.9% of residents speak Spanish at home 5,157 43.0% Speak English very well6,849 57.0% Speak English less than very well15.3% of residents speak other language at home 3,774 59.6% Speak English very well2,556 40.4% Speak English less than very well
English speakers - Born in the United States 85.2% of residents of Oakland Park speak English at home.
9.5% of residents speak Spanish at home 892 82.4% Speak English very well190 17.6% Speak English less than very well5.8% of residents speak other language at home 636 96.4% Speak English very well24 3.6% Speak English less than very well
English speakers - Native, born elsewhere 33.4% of residents of Oakland Park speak English at home.
63.0% of residents speak Spanish at home 788 70.3% Speak English very well333 29.7% Speak English less than very well3.3% of residents speak other language at home 58 100.0% Speak English very well
English speakers - Foreign-born 18.6% of residents of Oakland Park speak English at home.
51.6% of residents speak Spanish at home 2,015 25.2% Speak English very well5,976 74.8% Speak English less than very well30.5% of residents speak other language at home 2,382 50.5% Speak English very well2,339 49.5% Speak English less than very well
White (Caucasian) - Speak only English Native:
88.1% (11,438)Foreign-born:
22.0% (662)
White (Caucasian) - Speak another language Native:
12.6% (1,635)Foreign-born:
78.8% (2,368)
Black or African American - Speak only English Native:
90.1% (6,556)Foreign-born:
36.5% (1,454)
Black or African American - Speak another language Native:
10.1% (733)Foreign-born:
64.8% (2,583)
American Indian / Alaska Native - Speak another language Native:
8.8% (8)Foreign-born:
97.0% (58)
Asian - Speak only English Native:
66.3% (170)Foreign-born:
43.4% (273)
Asian - Speak another language Native:
32.1% (82)Foreign-born:
54.9% (345)
Other race - Speak only English Native:
20.2% (222)Foreign-born:
8.4% (115)
Other race - Speak another language Native:
77.7% (854)Foreign-born:
91.4% (1,257)
Two or more races - Speak only English Native:
41.9% (1,701)Foreign-born:
4.6% (325)
Two or more races - Speak another language Native:
58.5% (2,376)Foreign-born:
96.0% (6,824)
White alone - Speak only English Native:
93.6% (11,100)Foreign-born:
29.3% (613)
White alone - Speak another language Native:
6.4% (761)Foreign-born:
70.6% (1,478)
Hispanic or Latino - Speak only English Native:
26.9% (1,391)Foreign-born:
5.4% (446)
Hispanic or Latino - Speak another language Native:
72.9% (3,767)Foreign-born:
94.6% (7,758)
Foreign-born residents in Oakland Park 15,610 residents are foreign born (28.1% Latin America , 3.8% Europe ).
This city:
35.3%Florida:
21.1%
Marital status for residents in Oakland Park Marital status - White (Caucasian) population 15 years and over
Males 45.0% Never married36.8% Now married1.8% Separated1.6% Widowed14.9% DivorcedFemales 32.7% Never married41.4% Now married2.3% Separated7.7% Widowed15.8% DivorcedWomen who gave birth in the past 12 months Now married:
65.2% (76)Unmarried:
34.8% (41)
Women who did not give birth in the past 12 months Now married:
40.1% (1,323)Unmarried:
59.9% (1,975)
Marital status - Black or African American population 15 years and over
Males 54.8% Never married32.1% Now married3.6% Separated0.6% Widowed8.9% DivorcedFemales 46.9% Never married25.2% Now married6.6% Separated6.9% Widowed14.3% DivorcedWomen who gave birth in the past 12 months Now married:
36.2% (110)Unmarried:
63.8% (194)
Women who did not give birth in the past 12 months Now married:
32.3% (1,057)Unmarried:
67.7% (2,211)
Marital status - American Indian / Alaska Native population 15 years and over
Males 38.9% Never married9.7% Now married0.0% Separated0.0% Widowed51.4% DivorcedFemales 0.0% Never married11.9% Now married0.0% Separated19.4% Widowed68.7% DivorcedWomen who did not give birth in the past 12 months Now married:
21.1% (13)Unmarried:
78.9% (49)
Marital status - Asian population 15 years and over
Males 37.1% Never married39.3% Now married0.0% Separated0.0% Widowed23.6% DivorcedFemales 20.5% Never married48.8% Now married0.0% Separated19.2% Widowed11.5% DivorcedWomen who gave birth in the past 12 months Now married:
100.0% (18)Unmarried:
0.0% (0)
Women who did not give birth in the past 12 months Now married:
35.0% (76)Unmarried:
65.0% (142)
Marital status - Native Hawaiian / Pacific Islander population 15 years and over
Males 82.0% Never married18.0% Now married0.0% Separated0.0% Widowed0.0% DivorcedFemales 0.0% Never married100.0% Now married0.0% Separated0.0% Widowed0.0% DivorcedMarital status - Other race population 15 years and over
Males 40.4% Never married41.7% Now married2.0% Separated0.0% Widowed15.9% DivorcedFemales 40.5% Never married31.5% Now married0.0% Separated12.2% Widowed15.8% DivorcedWomen who gave birth in the past 12 months Now married:
100.0% (16)Unmarried:
0.0% (0)
Women who did not give birth in the past 12 months Now married:
28.4% (168)Unmarried:
71.6% (424)
Marital status - Two or more races population 15 years and over
Males 43.7% Never married39.9% Now married3.6% Separated0.1% Widowed12.6% DivorcedFemales 38.0% Never married32.9% Now married5.6% Separated2.1% Widowed21.4% DivorcedWomen who gave birth in the past 12 months Now married:
67.3% (106)Unmarried:
32.7% (51)
Women who did not give birth in the past 12 months Now married:
33.4% (791)Unmarried:
66.6% (1,577)
Marital status - White alone, not Hispanic / Latino population 15 years and over
Males 42.4% Never married37.0% Now married2.1% Separated1.7% Widowed16.8% DivorcedFemales 33.2% Never married38.1% Now married2.1% Separated9.6% Widowed17.1% DivorcedWomen who gave birth in the past 12 months Now married:
22.4% (12)Unmarried:
77.6% (40)
Women who did not give birth in the past 12 months Now married:
35.4% (960)Unmarried:
64.6% (1,755)
Marital status - Hispanic or Latino population 15 years and over
Males 46.7% Never married38.0% Now married2.5% Separated0.5% Widowed12.3% DivorcedFemales 32.7% Never married42.8% Now married4.4% Separated3.9% Widowed16.2% DivorcedWomen who gave birth in the past 12 months Now married:
79.5% (175)Unmarried:
20.5% (45)
Women who did not give birth in the past 12 months Now married:
43.8% (1,340)Unmarried:
56.2% (1,720)
Ancestries in Oakland Park
3,697 12.4% Haitian1,259 4.2% Jamaican1,117 3.7% Italian952 3.2% English882 3.0% German732 2.4% Irish705 2.4% Albanian676 2.3% American316 1.1% British279 0.9% Czech271 0.9% Polish176 0.6% British West Indian173 0.6% Romanian170 0.6% French166 0.6% Russian163 0.5% European149 0.5% French Canadian119 0.4% Brazilian118 0.4% African112 0.4% Greek101 0.3% Slovak100 0.3% Portuguese89 0.3% Scottish83 0.3% Dutch77 0.3% Icelander76 0.3% U.S. Virgin Islander74 0.2% Trinidadian and Tobagonian73 0.2% Hungarian71 0.2% Turkish59 0.2% Welsh55 0.2% Lebanese49 0.2% Canadian38 0.1% Barbadian34 0.1% Scotch-Irish32 0.1% Austrian31 0.1% Bahamian27 0.09% Ukrainian26 0.09% Swedish25 0.08% Eastern European22 0.07% Sierra Leonean19 0.06% Arab19 0.06% Pennsylvania German17 0.06% Northern European15 0.05% Swiss11 0.04% Iranian8 0.03% Danish8 0.03% Armenian8 0.03% Norwegian7 0.02% Palestinian7 0.02% Luxembourger5 0.02% Croatian5 0.02% Israeli4 0.01% Finnish3 0.01% West Indian
Geographical mobility in Oakland Park Same house 1 year ago 14,454 89.1% White (Caucasian)10,568 86.6% Black or African American109 51.3% American Indian / Alaska Native776 85.6% Asian69 100.0% Native Hawaiian / Pacific Islander2,400 91.3% Other race9,612 80.1% Two or more races12,816 90.1% White alone, not Hispanic / Latino11,705 83.4% Hispanic or LatinoMoved within same county 1,018 6.3% White / Caucasian1,205 9.9% Black or African American35 16.7% American Indian / Alaska Native69 7.6% Asian149 5.7% Other race1,266 10.5% Two or more races934 6.6% White alone, not Hispanic / Latino1,148 8.2% Hispanic or LatinoMoved within same state 126 0.8% White / Caucasian151 1.2% Black or African American63 7.0% Asian544 4.5% Two or more races66 0.5% White alone, not Hispanic / Latino353 2.5% Hispanic or LatinoMoved from different state 239 1.5% White / Caucasian144 1.2% Black or African American38 18.0% American Indian / Alaska Native6 0.7% Asian64 2.4% Other race227 1.9% Two or more races181 1.3% White alone, not Hispanic / Latino313 2.2% Hispanic or LatinoMoved from abroad 443 2.7% White16 7.4% American Indian / Alaska Native14 0.5% Other race310 2.6% Two or more races210 1.5% White alone, not Hispanic / Latino560 4.0% Hispanic or Latino
Children Nativity (place of birth) in Oakland Park
Children under 6 years - Living with two parents Both parents native 572 97.4% Native15 2.6% Foreign-bornBoth parents foreign-born 534 89.0% Native66 11.0% Foreign-bornOne native, one foreign-born parent 146 82.4% Native31 17.6% Foreign-bornChildren under 6 years - Living with one parent Native parent 647 99.4% Native4 0.6% Foreign-bornForeign-born parent 782 87.6% Native111 12.4% Foreign-bornChildren 6 to 17 years - Living with two parents Both parents native 648 99.6% Native3 0.4% Foreign-bornBoth parents foreign-born 853 67.1% Native418 32.9% Foreign-bornOne native, one foreign-born parent 238 90.0% Native26 10.0% Foreign-bornChildren 6 to 17 years - Living with one parent Native parent 1,202 100.0% NativeForeign-born parent 1,302 61.6% Native813 38.4% Foreign-born
Place of birth for residents in Oakland Park 13,369 Americas13,154 Latin America5,640 Caribbean4,597 Central America2,917 South America1,761 Europe952 Eastern Europe442 Northern Europe433 Asia291 Western Europe280 South Eastern Asia214 Northern America75 Southern Europe59 South Central Asia56 Western Asia38 Africa37 Eastern Asia37 China21 Northern Africa12 Southern Africa7 Oceania7 Australia and New Zealand Subregion4 Eastern Africa2,546 Haiti1,959 El Salvador1,269 Jamaica1,094 Guatemala999 Venezuela884 Cuba664 Mexico655 Albania608 Honduras511 Brazil495 Colombia348 Ecuador239 Trinidad and Tobago237 England214 Canada196 Peru175 Bahamas170 Argentina170 France138 United Kingdom127 Nicaragua121 Vietnam119 Chile105 Romania90 Ukraine87 Dominican Republic73 Costa Rica71 St. Lucia69 Philippines65 Thailand61 Panama53 Netherlands52 Germany49 Greece41 Bolivia39 Russia32 Barbados32 India31 Hungary28 China27 Scotland26 Pakistan25 Italy25 Israel22 Uruguay21 Dominica18 Laos17 Turkey12 South Africa12 Guyana11 Egypt9 Algeria8 Lebanon8 Hong Kong8 Bulgaria7 Australia7 Czechoslovakia6 Singapore5 West Indies5 Sweden5 Poland5 Saudi Arabia4 Austria
Grandparents responsible for own grandchildren in Oakland Park
Grandparents (30 to 59 years) White / Caucasian 28 100.0% Not responsible for grandchildrenBlack or African American 45 21.6% Responsible for grandchildren162 78.4% Not responsible for grandchildrenOther race 4 100.0% Not responsible for grandchildrenTwo or more races 128 100.0% Not responsible for grandchildrenWhite alone, not Hispanic / Latino 16 100.0% Not responsible for grandchildrenHispanic or Latino 104 100.0% Not responsible for grandchildrenGrandparents (60 years and over) White / Caucasian 61 24.0% Responsible for grandchildren191 76.0% Not responsible for grandchildrenBlack or African American 45 100.0% Not responsible for grandchildrenOther race 32 100.0% Not responsible for grandchildrenTwo or more races 9 72.9% Responsible for grandchildren3 27.1% Not responsible for grandchildrenWhite alone, not Hispanic / Latino 7 2.7% Responsible for grandchildren249 97.3% Not responsible for grandchildrenHispanic or Latino 69 51.0% Responsible for grandchildren66 49.0% Not responsible for grandchildren